Twelve years of district-level Average Daily Attendance for 234 Arkansas districts and 414,600 students – from the Natural State’s Annual Statistical Reports, plus assessment data from ATLAS and ACT Aspire.
Part of the njschooldata family.
Full documentation – all 15 stories with charts, getting-started guide, and complete function reference.
Highlights
1. State ADA peaked in 2020, then dropped 5% post-COVID
Arkansas’s total ADA hit 436,116 in 2020, then fell sharply to 421,997 in 2021 – a one-year drop of 14,000 students. By 2024, the state had not recovered.
years_to_check <- c(2018, 2019, 2020, 2021, 2022, 2023, 2024)
enr_years <- fetch_enr_multi(years_to_check, use_cache = TRUE)

# Filter out header and Totals rows using district ID
ada_by_year <- enr_years %>%
  filter(!is.na(`2`), grepl("^[0-9]", `2`)) %>%
  mutate(ada = as.numeric(gsub(",", "", `2_ada`))) %>%
  filter(!is.na(ada)) %>%
  group_by(end_year) %>%
  summarize(total_ada = round(sum(ada, na.rm = TRUE))) %>%
  arrange(end_year)

stopifnot(nrow(ada_by_year) == 7)
print(ada_by_year)
#> # A tibble: 7 x 2
#> end_year total_ada
#> <dbl> <dbl>
#> 1 2018 432503
#> 2 2019 430705
#> 3 2020 436116
#> 4 2021 421997
#> 5 2022 414984
#> 6 2023 416836
#> 7 2024 414633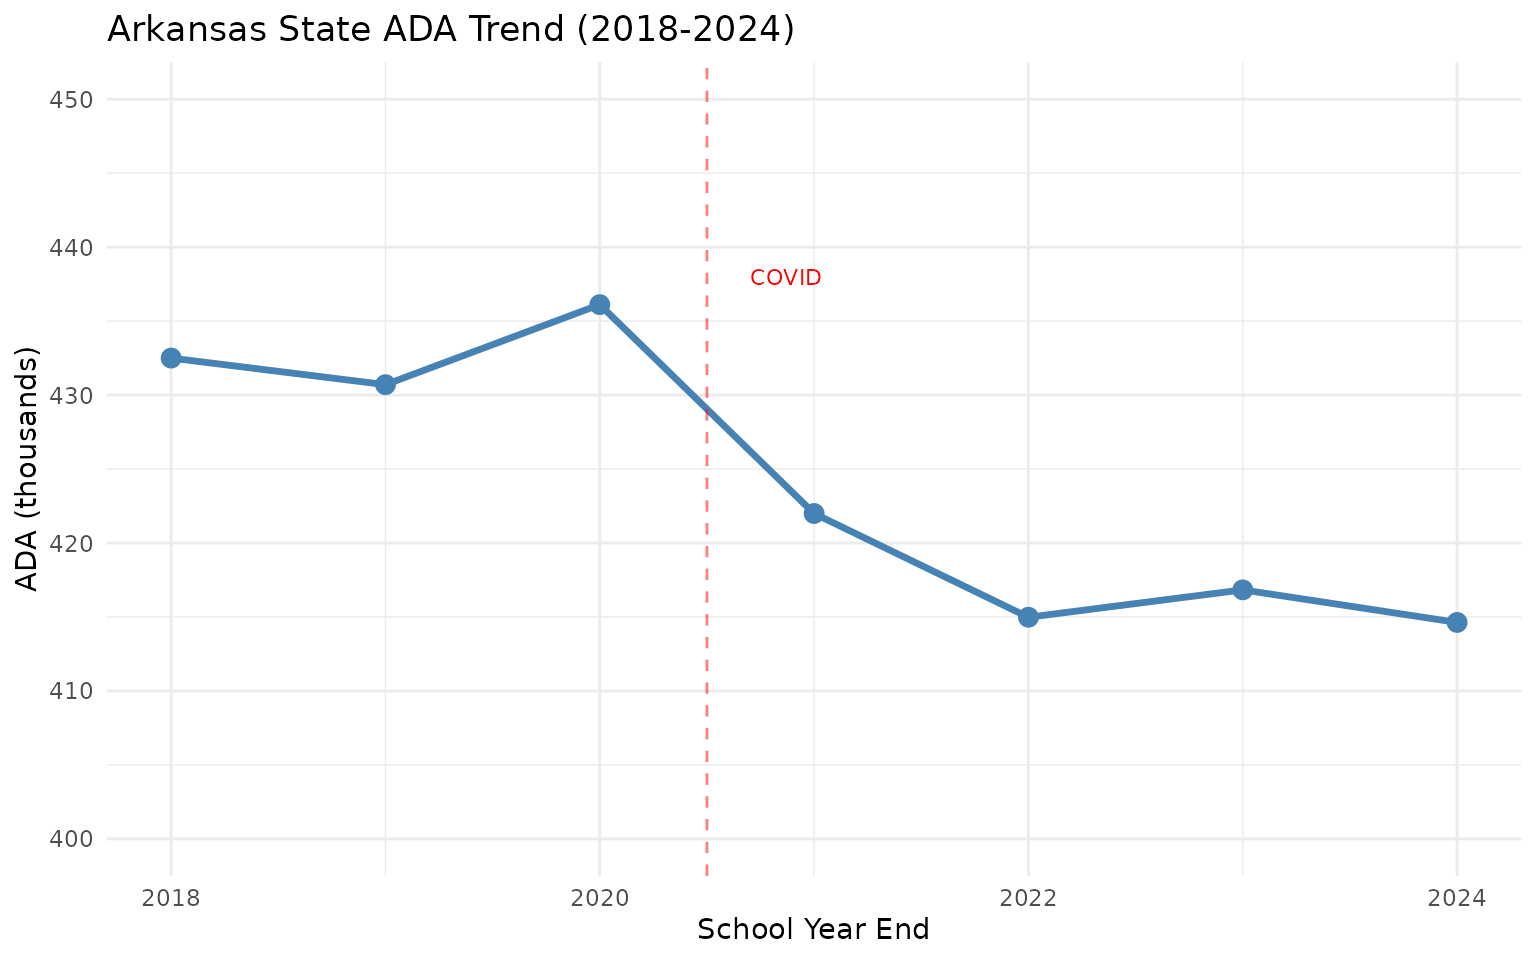
2. Springdale is now Arkansas’s largest district
Springdale Public Schools has overtaken Little Rock to become the state’s largest school district by Average Daily Attendance.
enr_2024 <- fetch_enr(2024, use_cache = TRUE)

# Clean data - skip header rows, filter by valid district ID
enr_clean <- enr_2024[3:nrow(enr_2024), ] %>%
  rename(district_name = `1`, district_id = `2`, ada = `2_ada`) %>%
  mutate(ada = as.numeric(gsub(",", "", ada))) %>%
  filter(!is.na(district_name), !is.na(ada), ada > 0, district_name != "Totals") %>%
  arrange(desc(ada))

stopifnot(nrow(enr_clean) > 0)

top_10 <- head(enr_clean %>% select(district_name, ada), 10)
print(top_10)
#> # A tibble: 10 x 2
#> district_name ada
#> <chr> <dbl>
#> 1 SPRINGDALE SCHOOL DISTRICT 20313.
#> 2 BENTONVILLE SCHOOL DISTRICT 17929.
#> 3 LITTLE ROCK SCHOOL DISTRICT 17582.
#> 4 ROGERS SCHOOL DISTRICT 14333.
#> 5 FORT SMITH SCHOOL DISTRICT 12404.
#> 6 PULASKI COUNTY SPECIAL SCHOOL DISTRICT 10726.
#> 7 CABOT SCHOOL DISTRICT 9485.
#> 8 FAYETTEVILLE SCHOOL DISTRICT 9377.
#> 9 CONWAY SCHOOL DISTRICT 9214.
#> 10 BRYANT SCHOOL DISTRICT 9027.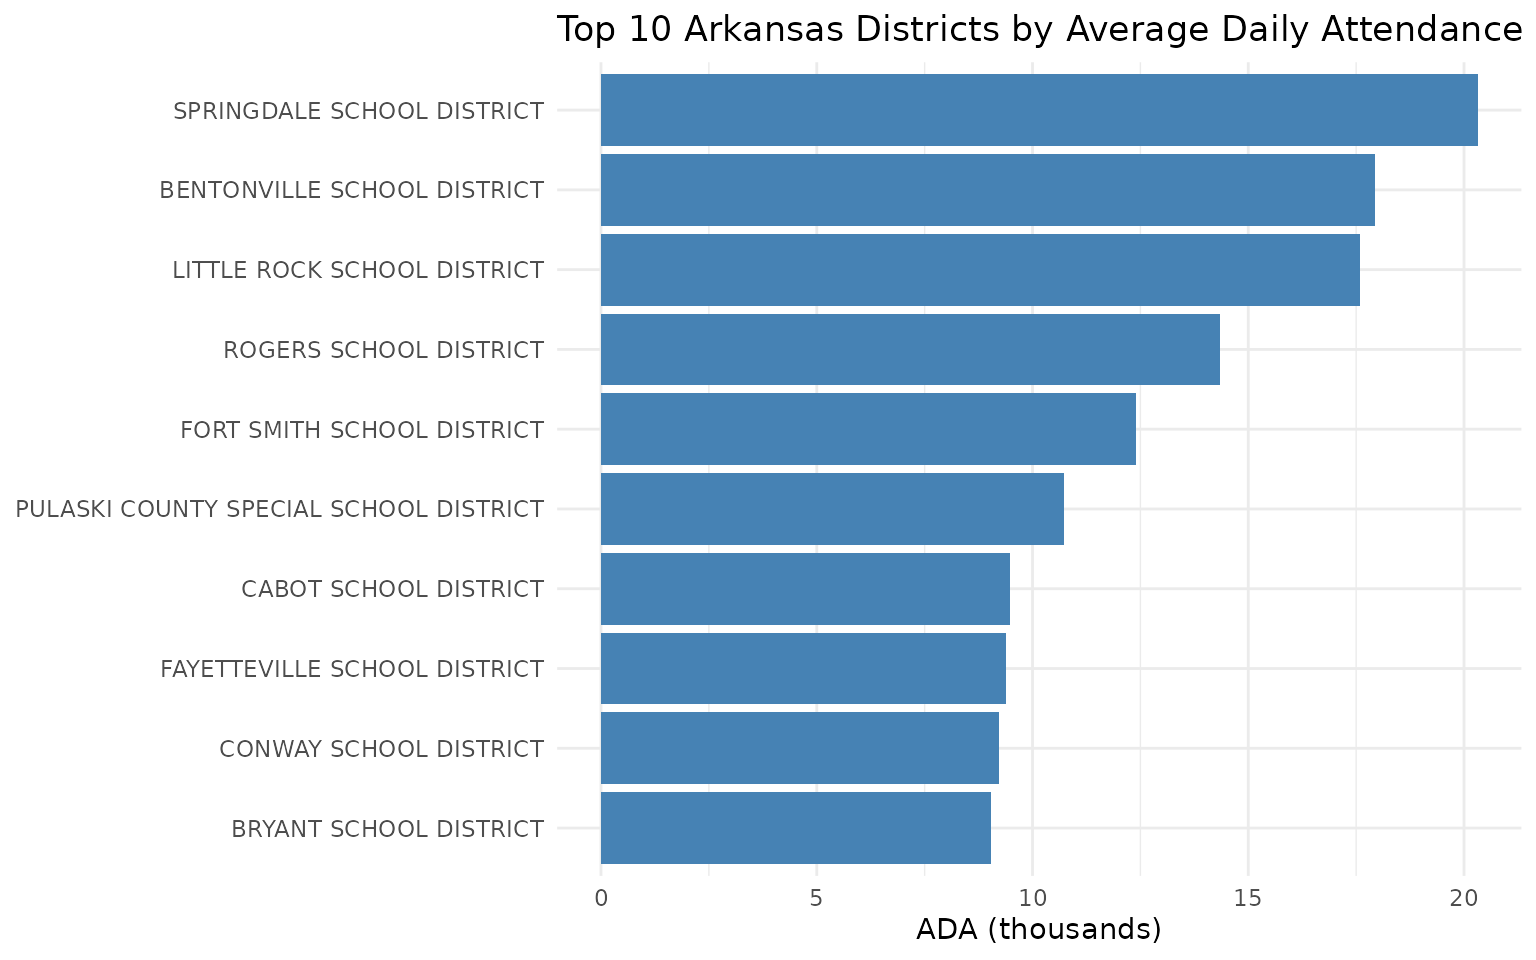
3. 57% of districts have fewer than 1,000 students
More than half of Arkansas’s 234 districts serve fewer than 1,000 students, but they account for only 19% of the state’s ADA. Meanwhile, just 6 districts with 10,000+ students serve 22% of all students.
size_breakdown <- enr_clean %>%
  mutate(size_category = case_when(
    ada < 500 ~ "Under 500",
    ada < 1000 ~ "500-999",
    ada < 5000 ~ "1,000-4,999",
    ada < 10000 ~ "5,000-9,999",
    TRUE ~ "10,000+"
  )) %>%
  group_by(size_category) %>%
  summarize(n_districts = n(), total_ada = sum(ada)) %>%
  arrange(match(size_category, c("Under 500", "500-999", "1,000-4,999", "5,000-9,999", "10,000+")))

stopifnot(nrow(size_breakdown) > 0)
print(size_breakdown)
#> # A tibble: 5 x 3
#> size_category n_districts total_ada
#> <chr> <int> <dbl>
#> 1 Under 500 47 18211.
#> 2 500-999 86 60555.
#> 3 1,000-4,999 86 177499.
#> 4 5,000-9,999 9 65081.
#> 5 10,000+ 6 93288.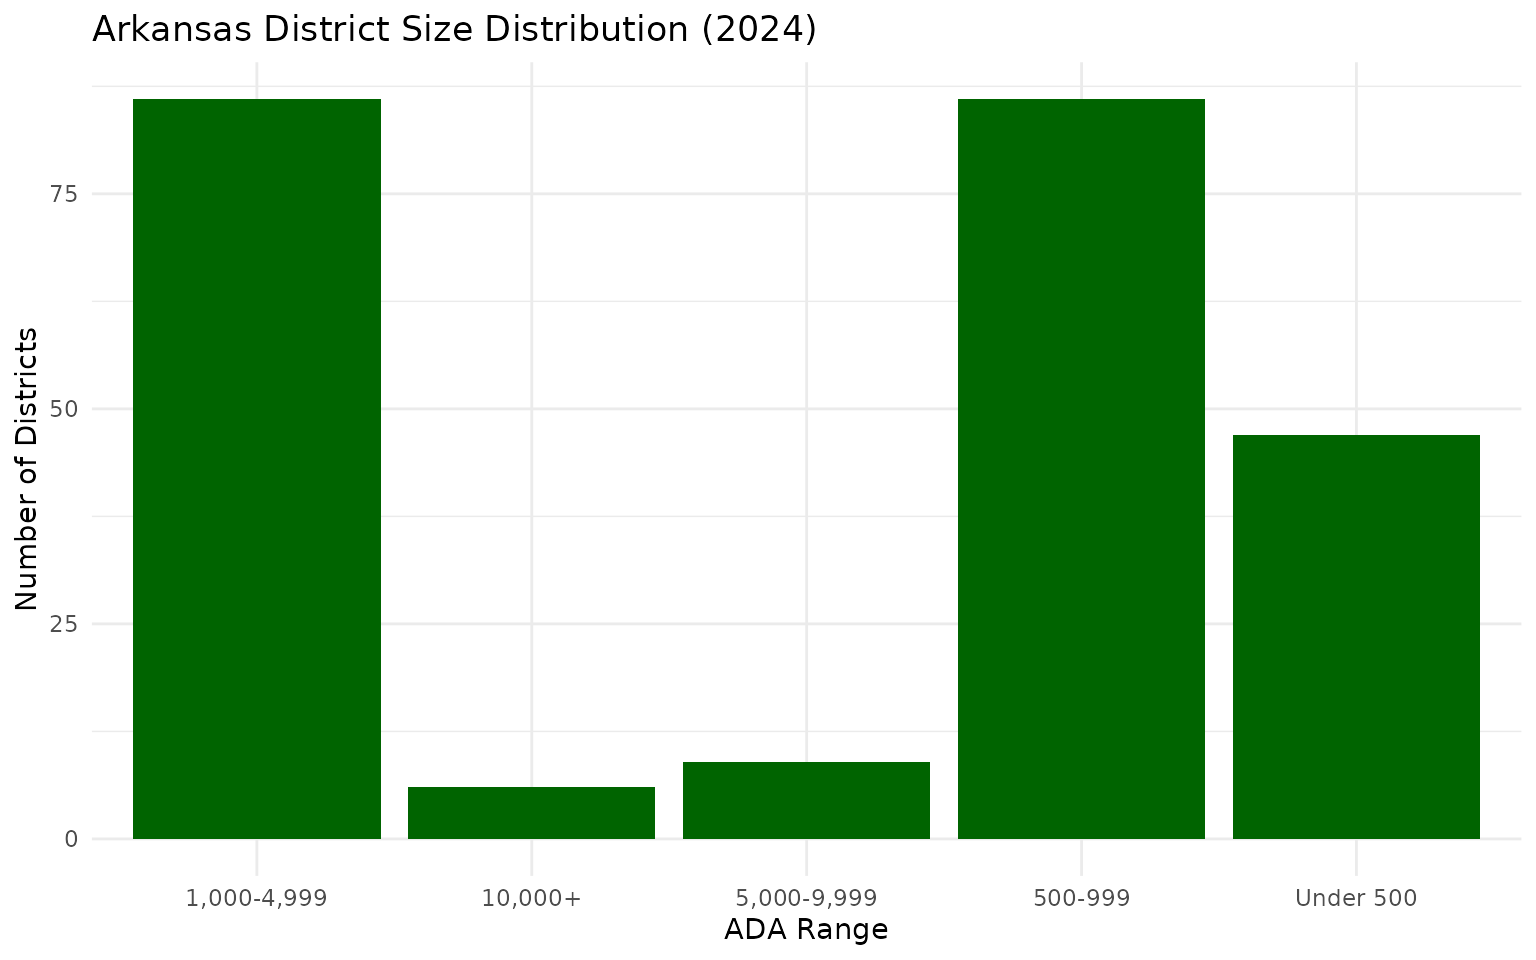
Data Taxonomy
| Category | Years | Function | Details |
|---|---|---|---|
| Enrollment | 2006, 2013-2024 |
fetch_enr() / fetch_enr_multi()
|
District. ADA |
| Assessments | 2016-2019, 2021-2025 |
fetch_assessment() / fetch_assessment_multi()
|
District, school. ATLAS, ACT Aspire |
| Graduation | – | – | Not yet available |
| Directory | 2005-2026 | fetch_directory() |
District, school. Superintendent/principal contacts, emails, addresses |
| Per-Pupil Spending | – | – | Not yet available |
| Accountability | – | – | Not yet available |
| Chronic Absence | – | – | Not yet available |
| EL Progress | – | – | Not yet available |
| Special Ed | – | – | Not yet available |
See the full data category taxonomy for what each category covers.
Quick Start
R
# install.packages("remotes")
remotes::install_github("almartin82/arschooldata")
library(arschooldata)
library(dplyr)

# Check available years
get_available_years()

# Fetch one year
enr_2024 <- fetch_enr(2024)

# Fetch multiple years
enr_multi <- fetch_enr_multi(2020:2024)

# View top districts by ADA
enr_2024[3:nrow(enr_2024), ] %>%
  rename(district_name = `1`, ada = `2_ada`) %>%
  mutate(ada = as.numeric(gsub(",", "", ada))) %>%
  filter(!is.na(ada)) %>%
  arrange(desc(ada)) %>%
head(10)Explore More
Full analysis with 15 stories: - Enrollment trends – 15 stories - Assessment analysis - Function reference
Data Notes
Data Source: Arkansas Division of Elementary and Secondary Education (DESE)
Enrollment Data
- Source: Annual Statistical Reports
- Available years: 2006, 2013-2024 (gap: 2007-2012)
- Key metric: Average Daily Attendance (ADA)
- Coverage: ~234 school districts
Assessment Data
- Source: Assessment Test Scores
- Available years: 2016-2019, 2021-2025 (no 2020 due to COVID)
- Coverage: 1,000+ schools across 250+ districts
Limitations: - Enrollment data provides ADA and fiscal data from Annual Statistical Reports - For enrollment demographics by race/ethnicity, visit the ADE Data Center - No school-level enrollment data (district only) - Years 2007-2012 not available due to missing source URLs
Deeper Dive
4. Northwest Arkansas districts dominate growth
The four largest NWA districts (Springdale, Bentonville, Rogers, Fayetteville) account for nearly 62,000 students combined – 15% of the state from four districts.
nwa_districts <- enr_clean %>%
  filter(grepl("SPRINGDALE|BENTONVILLE|ROGERS|FAYETTEVILLE", district_name)) %>%
  select(district_name, ada)

stopifnot(nrow(nwa_districts) > 0)
print(nwa_districts)

cat("\nNWA Combined ADA:", format(round(sum(nwa_districts$ada)), big.mark = ","), "\n")
cat("Share of state:", round(sum(nwa_districts$ada) / state_total * 100, 1), "%\n")
#> # A tibble: 4 x 2
#> district_name ada
#> <chr> <dbl>
#> 1 SPRINGDALE SCHOOL DISTRICT 20313.
#> 2 BENTONVILLE SCHOOL DISTRICT 17929.
#> 3 ROGERS SCHOOL DISTRICT 14333.
#> 4 FAYETTEVILLE SCHOOL DISTRICT 9377.
#>
#> NWA Combined ADA: 61,953
#> Share of state: 14.9 %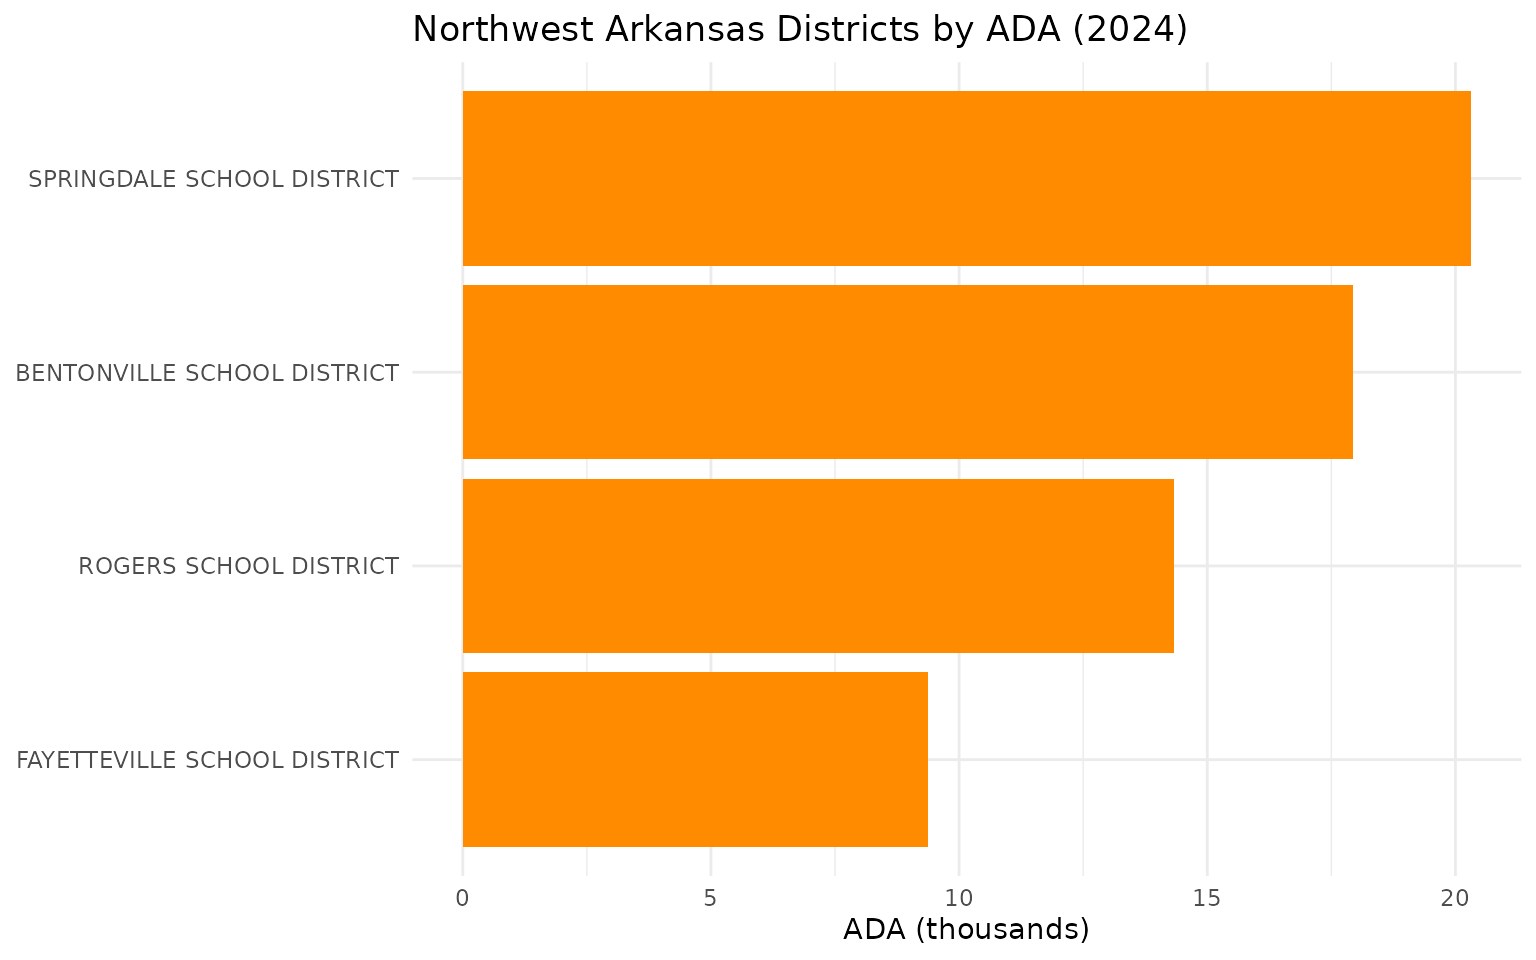
5. Little Rock is Pulaski County’s largest district
Despite losing the top spot statewide, Little Rock remains the largest single district in Pulaski County – but the other three Pulaski County districts combined (21,303 ADA) now exceed Little Rock (17,582).
pulaski <- enr_clean %>%
  filter(grepl("LITTLE ROCK|PULASKI|JACKSONVILLE", district_name)) %>%
  select(district_name, ada) %>%
  arrange(desc(ada))

stopifnot(nrow(pulaski) > 0)
print(pulaski)
#> # A tibble: 4 x 2
#> district_name ada
#> <chr> <dbl>
#> 1 LITTLE ROCK SCHOOL DISTRICT 17582.
#> 2 PULASKI COUNTY SPECIAL SCHOOL DISTRICT 10726.
#> 3 N. LITTLE ROCK SCHOOL DISTRICT 6671.
#> 4 JACKSONVILLE NORTH PULASKI SCHOOL DISTRICT 3906.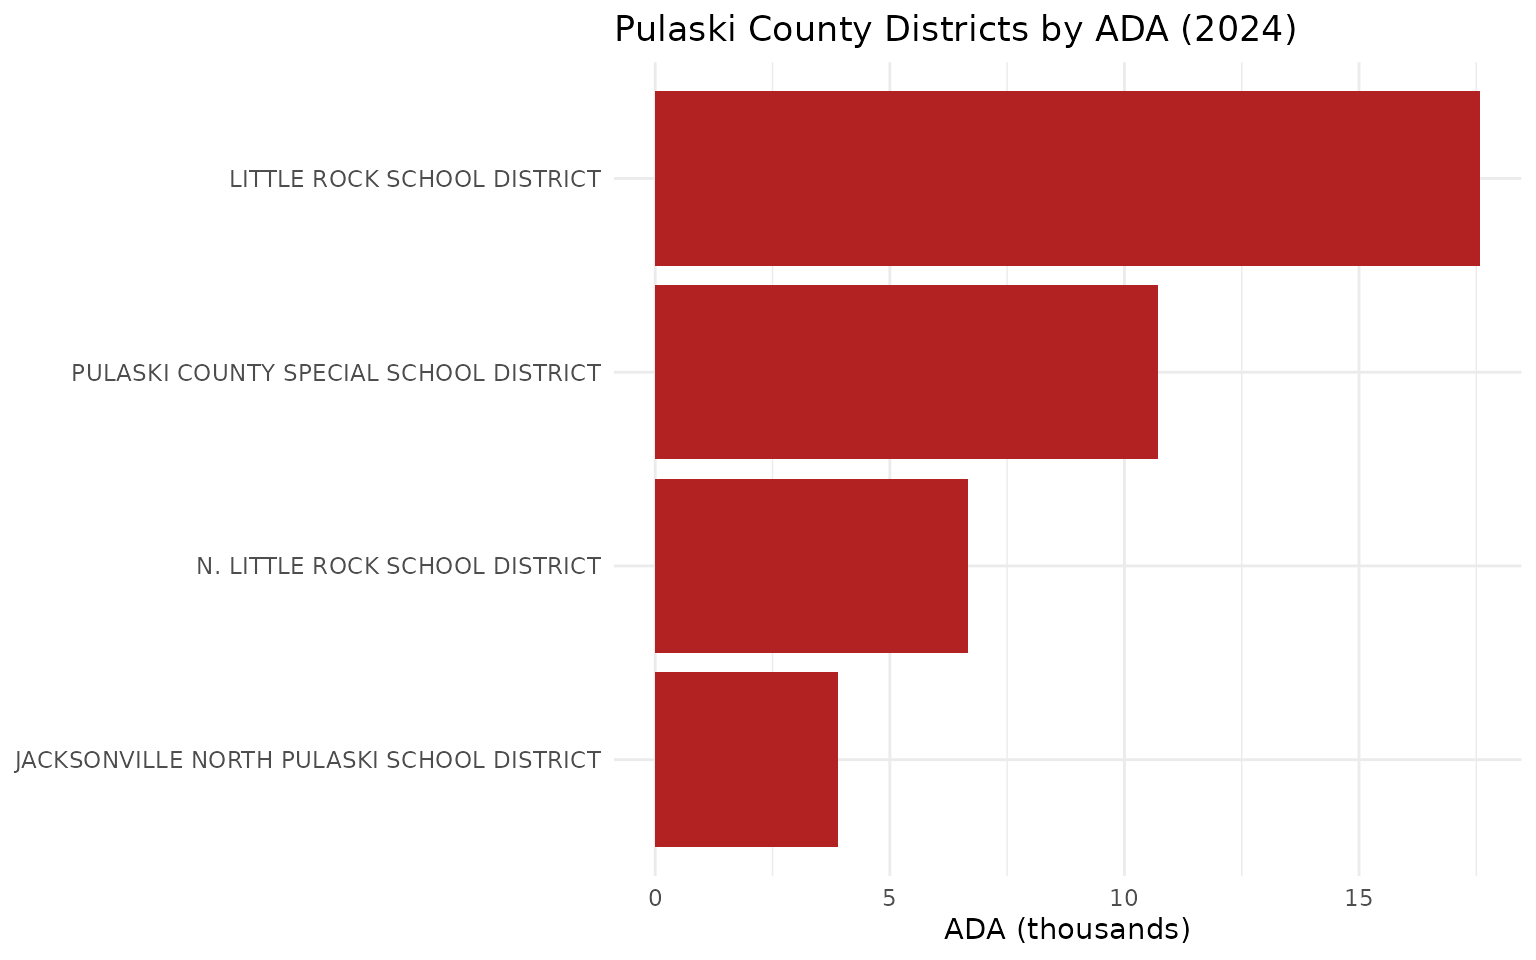
6. Fort Smith leads the River Valley
Fort Smith School District is the largest in western Arkansas outside NWA, more than double the next-largest River Valley district.
western <- enr_clean %>%
  filter(grepl("FORT SMITH|VAN BUREN|GREENWOOD|ALMA", district_name)) %>%
  select(district_name, ada) %>%
  arrange(desc(ada))

stopifnot(nrow(western) > 0)
print(western)
#> # A tibble: 4 x 2
#> district_name ada
#> <chr> <dbl>
#> 1 FORT SMITH SCHOOL DISTRICT 12404.
#> 2 VAN BUREN SCHOOL DISTRICT 5213.
#> 3 GREENWOOD SCHOOL DISTRICT 3655.
#> 4 ALMA SCHOOL DISTRICT 2990.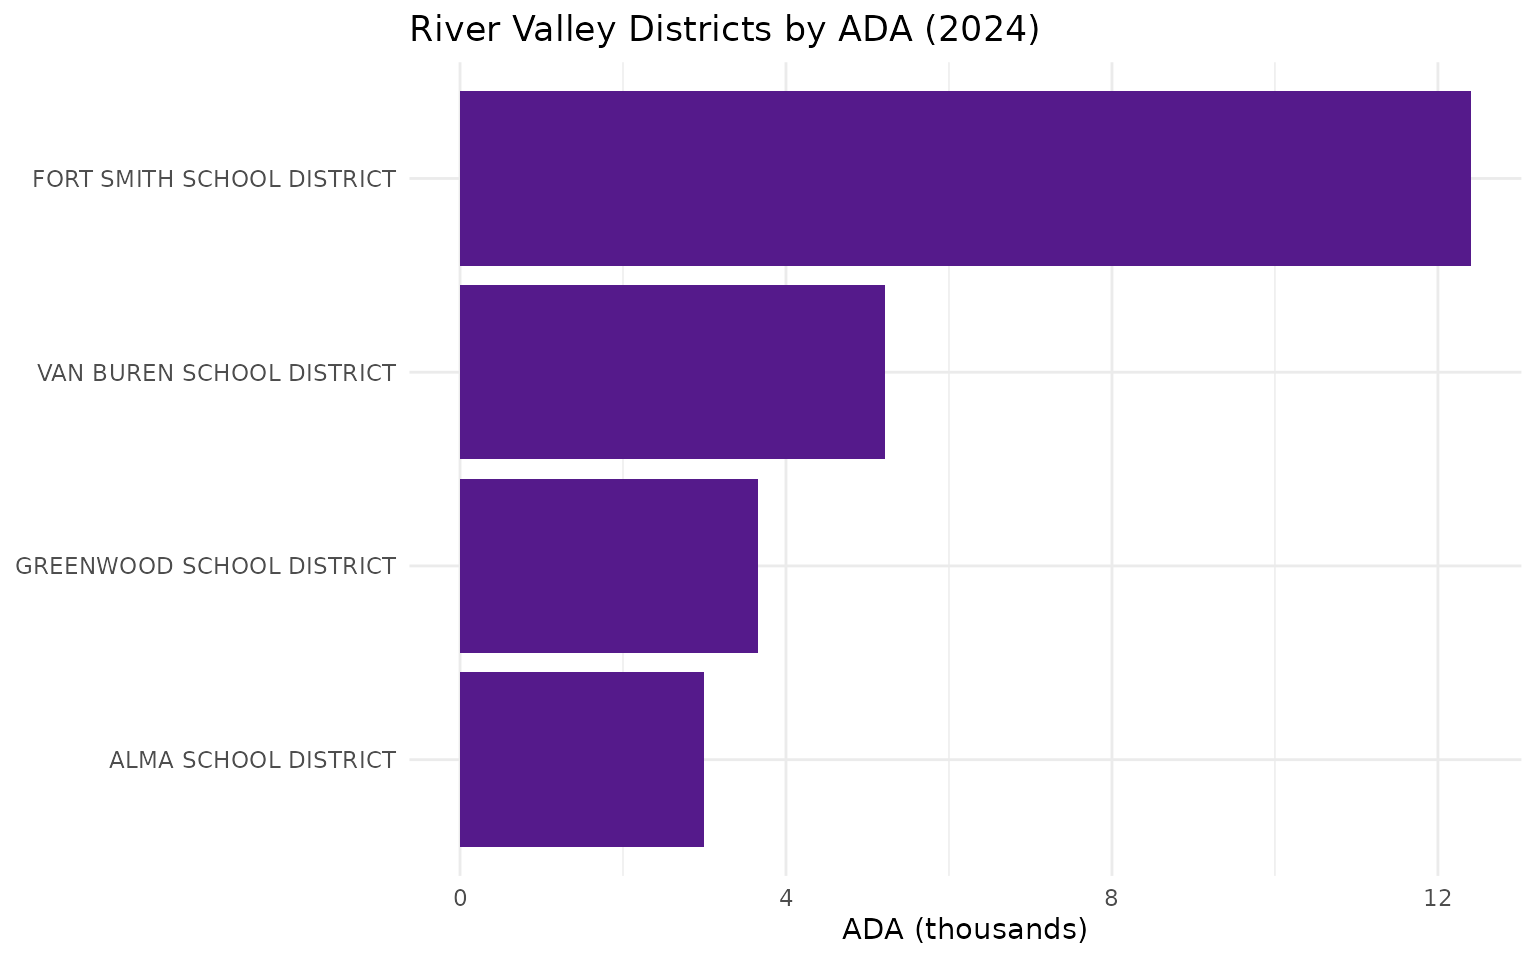
7. Cabot is the largest district in the ring suburbs
Cabot leads the suburban ring around Little Rock in ADA, narrowly edging out Conway and Bryant.
suburbs <- enr_clean %>%
  filter(district_name %in% c(
    "CABOT SCHOOL DISTRICT",
    "CONWAY SCHOOL DISTRICT",
    "BRYANT SCHOOL DISTRICT",
    "BENTON SCHOOL DISTRICT",
    "SHERIDAN SCHOOL DISTRICT",
    "LONOKE SCHOOL DISTRICT"
  )) %>%
  select(district_name, ada) %>%
  arrange(desc(ada))

stopifnot(nrow(suburbs) > 0)
print(suburbs)
#> # A tibble: 6 x 2
#> district_name ada
#> <chr> <dbl>
#> 1 CABOT SCHOOL DISTRICT 9485.
#> 2 CONWAY SCHOOL DISTRICT 9214.
#> 3 BRYANT SCHOOL DISTRICT 9027.
#> 4 BENTON SCHOOL DISTRICT 5335.
#> 5 SHERIDAN SCHOOL DISTRICT 3908.
#> 6 LONOKE SCHOOL DISTRICT 1488.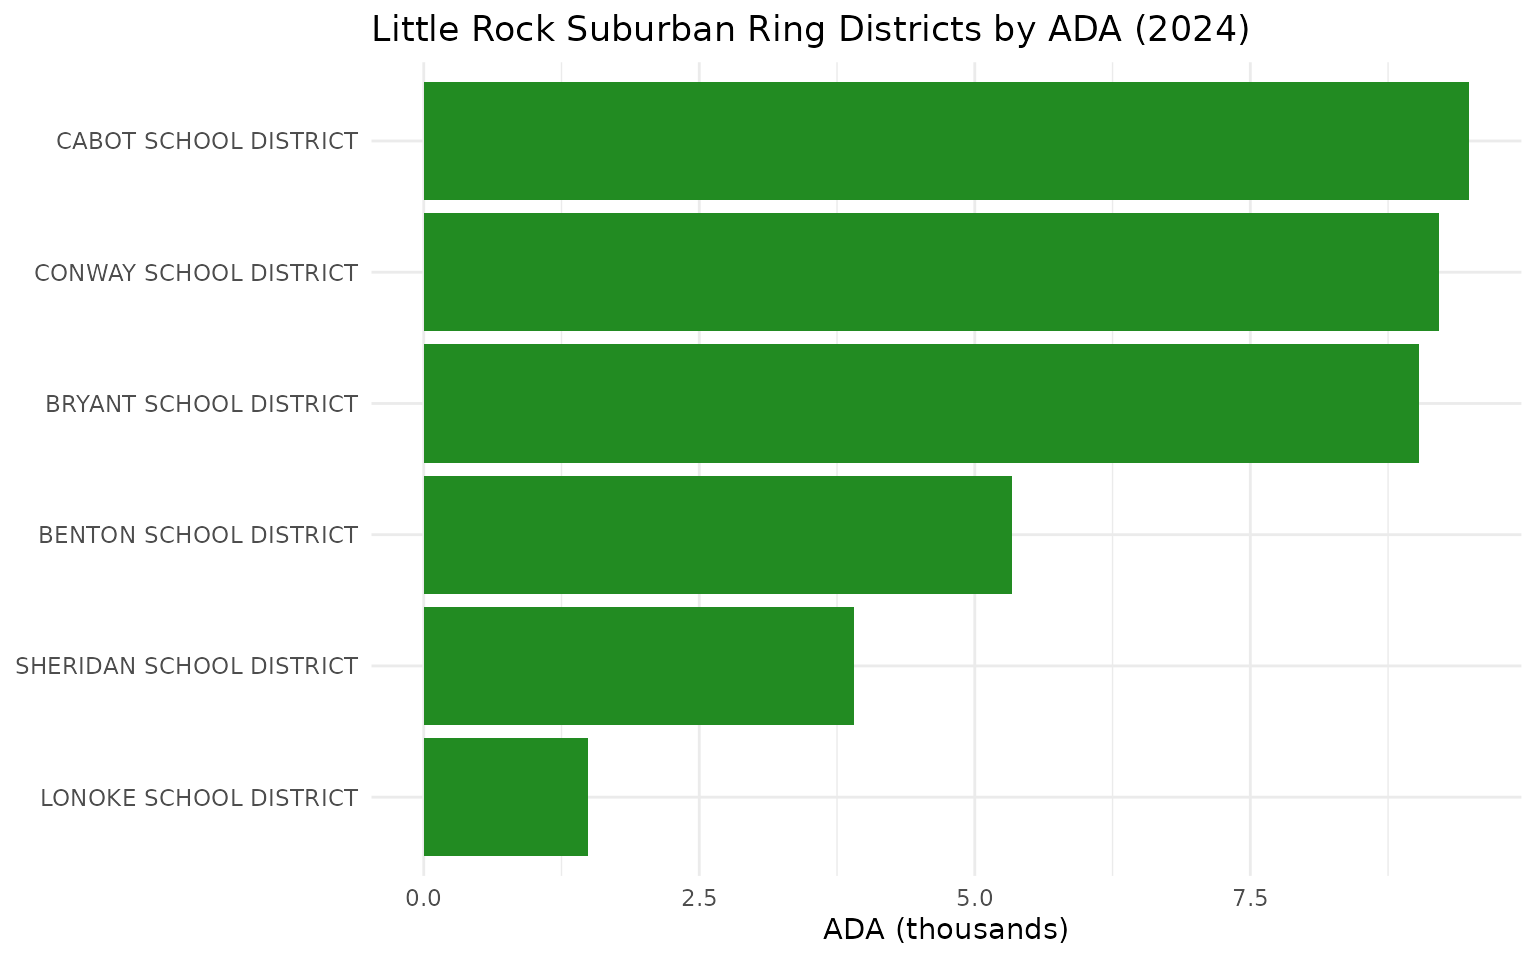
8. Bentonville has grown 27% in a decade
Bentonville’s ADA has grown from 14,100 to 17,900 since 2013, fueled by corporate relocations and the Walmart economy.
# Fetch multi-year data
enr_multi <- fetch_enr_multi(c(2013, 2024), use_cache = TRUE)

# 2013 uses "actual_amount" for district name; 2024 uses "1"
# Create unified district_name column
enr_multi <- enr_multi %>%
  mutate(district_name = coalesce(actual_amount, `1`))

get_ada <- function(df, year) {
  df %>%
    filter(end_year == year) %>%
    mutate(ada = as.numeric(gsub(",", "", `2_ada`))) %>%
    filter(!is.na(district_name), !is.na(ada), ada > 0,
           !grepl("^Totals$|^DISTRICT$", district_name))
}

enr_2013 <- get_ada(enr_multi, 2013)
enr_2024_v2 <- get_ada(enr_multi, 2024)

bentonville_2013 <- enr_2013 %>% filter(grepl("BENTONVILLE", district_name)) %>% pull(ada)
bentonville_2024 <- enr_2024_v2 %>% filter(grepl("BENTONVILLE", district_name)) %>% pull(ada)

stopifnot(length(bentonville_2013) == 1, length(bentonville_2024) == 1)

cat("Bentonville ADA 2013:", format(round(bentonville_2013), big.mark = ","), "\n")
cat("Bentonville ADA 2024:", format(round(bentonville_2024), big.mark = ","), "\n")
cat("Growth:", round((bentonville_2024 / bentonville_2013 - 1) * 100, 1), "%\n")
#> Bentonville ADA 2013: 14,128
#> Bentonville ADA 2024: 17,929
#> Growth: 26.9 %9. Arkansas has 414,600 students across 234 districts
Arkansas has approximately 414,600 students in Average Daily Attendance across 234 school districts.
state_total <- sum(enr_clean$ada, na.rm = TRUE)
n_districts <- nrow(enr_clean)

cat("State ADA total:", format(round(state_total), big.mark = ","), "\n")
cat("Number of districts:", n_districts, "\n")
#> State ADA total: 414,634
#> Number of districts: 23410. Top 20 districts educate 43% of the state
The largest 20 districts by ADA account for 43% of all students – but that is only 20 out of 234 districts.
top_20 <- enr_clean %>%
  head(20)

stopifnot(nrow(top_20) == 20)

cat("Top 20 districts ADA:", format(round(sum(top_20$ada)), big.mark = ","), "\n")
cat("Percent of state:", round(sum(top_20$ada) / state_total * 100, 1), "%\n")
#> Top 20 districts ADA: 178,020
#> Percent of state: 42.9 %11. The smallest district has just 203 students
Marvell-Elaine School District, in the Mississippi Delta, is Arkansas’s smallest with about 203 students in ADA.
smallest <- enr_clean %>%
  filter(ada > 0) %>%
  arrange(ada) %>%
  head(10) %>%
  select(district_name, ada)

stopifnot(nrow(smallest) == 10)
print(smallest)
#> # A tibble: 10 x 2
#> district_name ada
#> <chr> <dbl>
#> 1 MARVELL-ELAINE SCHOOL DISTRICT 203.
#> 2 WESTERN YELL CO. SCHOOL DIST. 260.
#> 3 DERMOTT SCHOOL DISTRICT 268.
#> 4 STRONG-HUTTIG SCHOOL DISTRICT 292.
#> 5 SHIRLEY SCHOOL DISTRICT 299.
#> 6 GUY-PERKINS SCHOOL DISTRICT 300.
#> 7 AUGUSTA SCHOOL DISTRICT 307.
#> 8 LEAD HILL SCHOOL DISTRICT 319.
#> 9 DEER/MT. JUDEA SCHOOL DISTRICT 321.
#> 10 CALICO ROCK SCHOOL DISTRICT 334.12. The Delta has multiple small districts
Mississippi Delta districts in eastern Arkansas tend to be smaller due to decades of population decline. Lee County has just 596 students in ADA.
delta <- enr_clean %>%
  filter(grepl("HELENA|LEE COUNTY|FORREST CITY", district_name)) %>%
  select(district_name, ada) %>%
  arrange(ada)

stopifnot(nrow(delta) > 0)
print(delta)
#> # A tibble: 3 x 2
#> district_name ada
#> <chr> <dbl>
#> 1 LEE COUNTY SCHOOL DISTRICT 596.
#> 2 HELENA/ W.HELENA SCHOOL DIST. 860.
#> 3 FORREST CITY SCHOOL DISTRICT 1826.13. Jonesboro anchors northern Arkansas
Jonesboro is the largest district in the northern half of the state, followed by Mountain Home and Batesville in the Ozarks.
ozarks <- enr_clean %>%
  filter(grepl("MOUNTAIN HOME|HARRISON|BATESVILLE|JONESBORO|PARAGOULD", district_name)) %>%
  select(district_name, ada) %>%
  arrange(desc(ada))

stopifnot(nrow(ozarks) > 0)
print(ozarks)
#> # A tibble: 5 x 2
#> district_name ada
#> <chr> <dbl>
#> 1 JONESBORO SCHOOL DISTRICT 5741.
#> 2 MOUNTAIN HOME SCHOOL DISTRICT 3530.
#> 3 BATESVILLE SCHOOL DISTRICT 2916.
#> 4 PARAGOULD SCHOOL DISTRICT 2708.
#> 5 HARRISON SCHOOL DISTRICT 2567.14. Nettleton leads Paragould in northeast Arkansas
After Jonesboro, Nettleton (3,433 ADA) leads the next tier of northeast Arkansas districts, with Paragould (2,708) close behind.
northeast <- enr_clean %>%
  filter(grepl("JONESBORO|PARAGOULD|POCAHONTAS|TRUMANN|NETTLETON", district_name)) %>%
  select(district_name, ada) %>%
  arrange(desc(ada))

stopifnot(nrow(northeast) > 0)
print(northeast)
#> # A tibble: 5 x 2
#> district_name ada
#> <chr> <dbl>
#> 1 JONESBORO SCHOOL DISTRICT 5741.
#> 2 NETTLETON SCHOOL DISTRICT 3433.
#> 3 PARAGOULD SCHOOL DISTRICT 2708.
#> 4 POCAHONTAS SCHOOL DISTRICT 1723.
#> 5 TRUMANN SCHOOL DISTRICT 1346.15. Educational Service Cooperatives support small districts
Arkansas has Educational Service Cooperatives (ESCs) that support small rural districts with shared services. They do not appear in this ADA data because they do not directly serve students.
coops <- enr_2024[3:nrow(enr_2024), ] %>%
  rename(district_name = `1`, ada = `2_ada`) %>%
  mutate(ada = as.numeric(gsub(",", "", ada))) %>%
  filter(grepl("COOP|COOPERATIVE|SERVICE", district_name, ignore.case = TRUE)) %>%
  select(district_name, ada)

if(nrow(coops) > 0) {
  print(coops)
} else {
  cat("ESCs are not included in this enrollment data.\n")
}
#> ESCs are not included in this enrollment data.