Colorado shed 31,584 students between 2020 and 2024 – and 9 of the 10 largest districts shrank. Fetch and analyze Colorado school enrollment data from the Colorado Department of Education (CDE) in R or Python.
Part of the njschooldata family.
Full documentation – all 15 stories with charts, getting-started guide, and complete function reference.
Highlights
library(coschooldata)
library(dplyr)
library(tidyr)
library(ggplot2)

theme_set(theme_minimal(base_size = 14))

enr <- fetch_enr_multi(c(2020, 2024), use_cache = TRUE)
enr_2024 <- fetch_enr(2024, use_cache = TRUE)
1. Colorado lost 31,584 students since 2020
The pandemic accelerated enrollment decline in a state that had been growing for a decade. Colorado shed 3.5% of its student population between 2020 and 2024.
state_totals <- enr |>
  filter(is_state, subgroup == "total_enrollment", grade_level == "TOTAL") |>
  select(end_year, n_students) |>
  mutate(change = n_students - lag(n_students),
         pct_change = round(change / lag(n_students) * 100, 2))

stopifnot(nrow(state_totals) > 0)
state_totals
#>   end_year n_students change pct_change
#> 1     2020     913030     NA         NA
#> 2     2024     881446 -31584      -3.46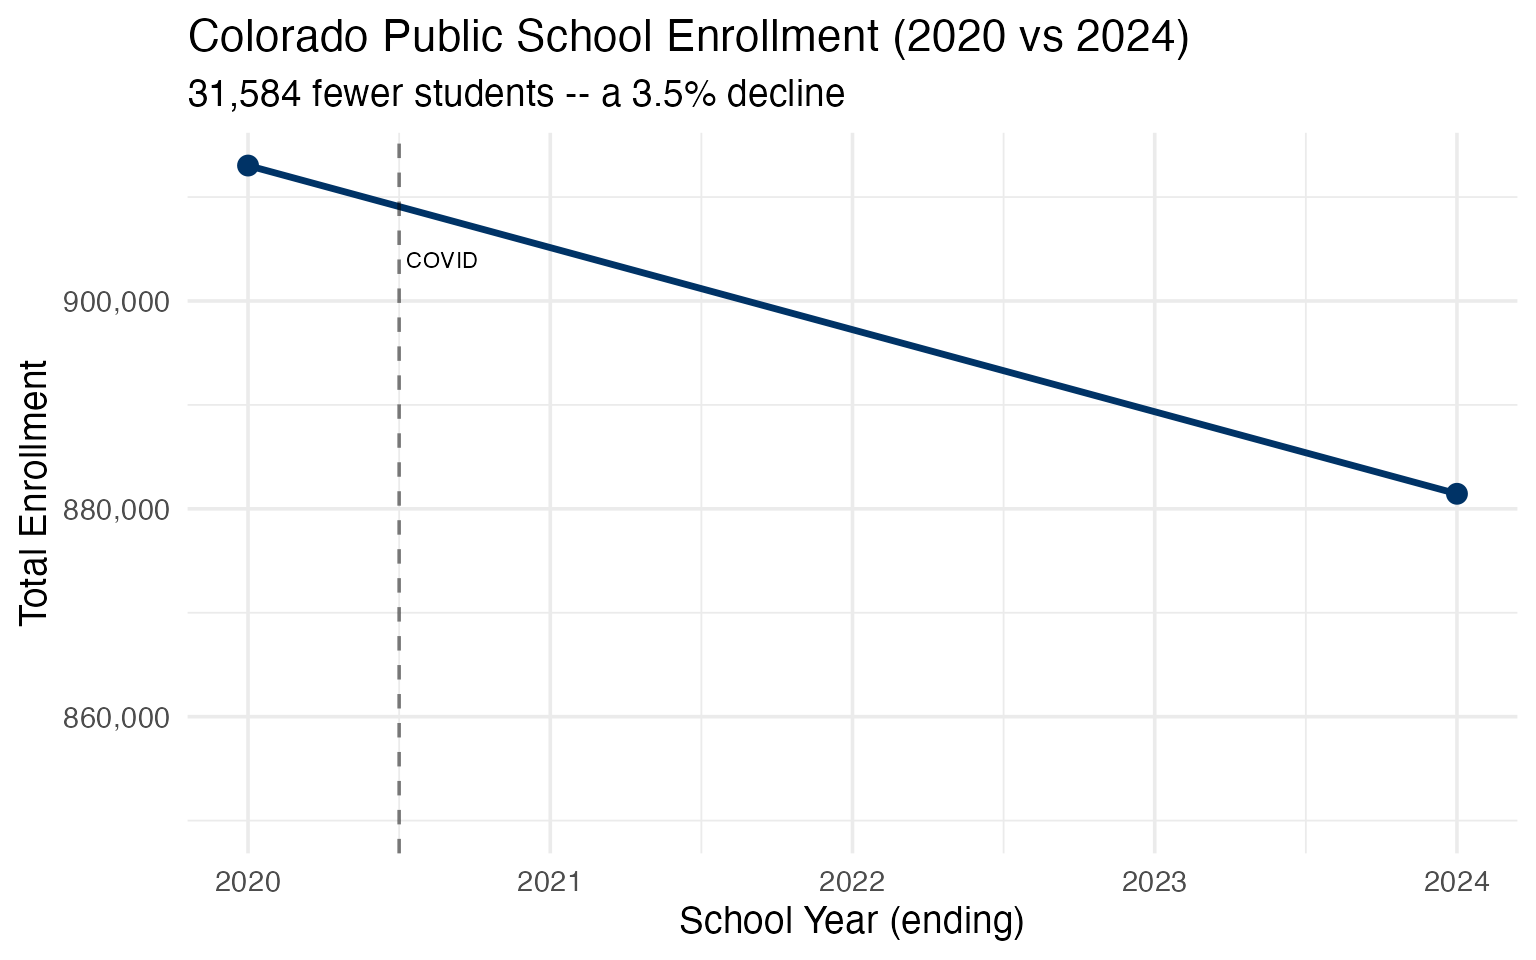
2. 9 of the 10 largest districts lost students
Academy 20 was the sole top-10 district to hold steady (gaining 4 students). Everyone else shrank, led by Jefferson County (-9.4%) and Adams 12 Five Star (-9.4%).
top10_names <- enr_2024 |>
  filter(is_district, subgroup == "total_enrollment", grade_level == "TOTAL") |>
  arrange(desc(n_students)) |>
  head(10) |>
  pull(district_name)

top10_compare <- enr |>
  filter(is_district, subgroup == "total_enrollment", grade_level == "TOTAL",
         district_name %in% top10_names) |>
  select(end_year, district_name, n_students) |>
  pivot_wider(names_from = end_year, values_from = n_students, values_fn = sum) |>
  mutate(change = `2024` - `2020`,
         pct_change = round(change / `2020` * 100, 1)) |>
  arrange(pct_change)

stopifnot(nrow(top10_compare) == 10)
top10_compare
#> # A tibble: 10 x 5
#>    district_name              `2020` `2024` change pct_change
#>    <chr>                       <dbl>  <dbl>  <dbl>      <dbl>
#>  1 Adams 12 Five Star Schools  38648  34998  -3650       -9.4
#>  2 Jefferson County R-1        84032  76172  -7860       -9.4
#>  3 Boulder Valley Re 2         31000  28362  -2638       -8.5
#>  4 Douglas County Re 1         67305  61964  -5341       -7.9
#>  5 Cherry Creek 5              56172  52419  -3753       -6.7
#>  6 Denver County 1             92112  88235  -3877       -4.2
#>  7 Poudre R-1                  30727  29896   -831       -2.7
#>  8 Adams-Arapahoe 28J          40088  39148   -940       -2.3
#>  9 St Vrain Valley RE1J        32855  32506   -349       -1.1
#> 10 Academy 20                  26603  26607      4        0.0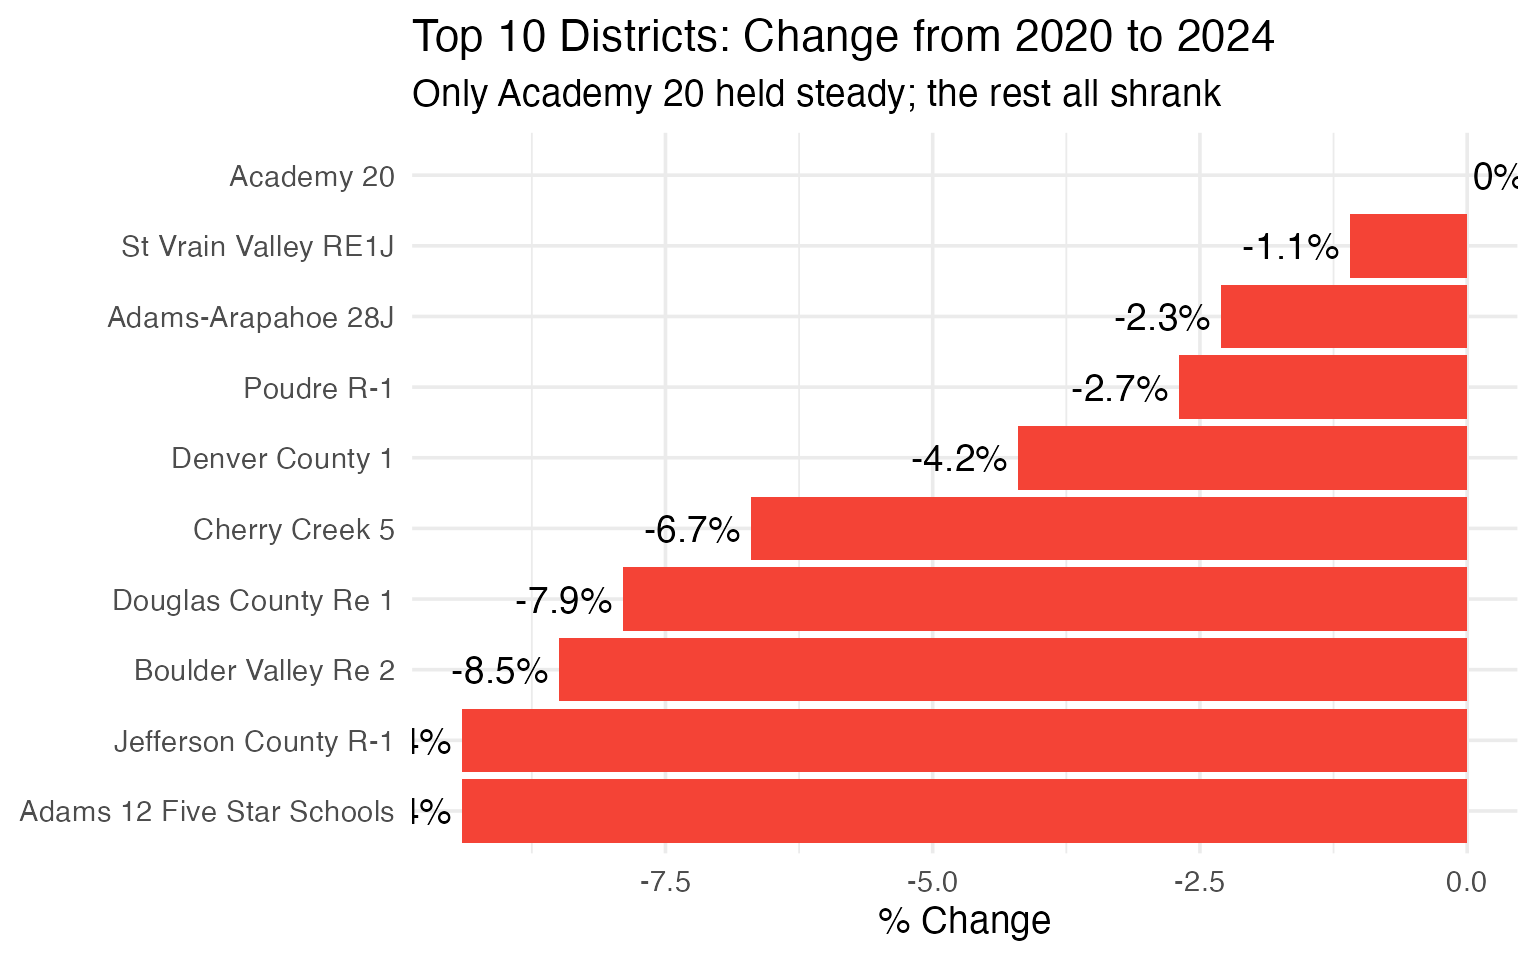
3. Hispanic students are now 35.5% of enrollment
Hispanic students make up the second-largest group in Colorado, just behind white students. The Hispanic share grew from 33.9% in 2020 to 35.5% in 2024.
demographics <- enr_2024 |>
  filter(is_state, grade_level == "TOTAL",
         subgroup %in% c("hispanic", "white", "black", "asian",
                         "native_american", "multiracial", "pacific_islander")) |>
  mutate(pct = round(pct * 100, 1)) |>
  select(subgroup, n_students, pct) |>
  arrange(desc(n_students))

stopifnot(nrow(demographics) > 0)
demographics
#>           subgroup n_students  pct
#> 1            white     444973 50.5
#> 2         hispanic     312685 35.5
#> 3      multiracial      46570  5.3
#> 4            black      40070  4.5
#> 5            asian      28899  3.3
#> 6  native_american       5348  0.6
#> 7 pacific_islander       2901  0.3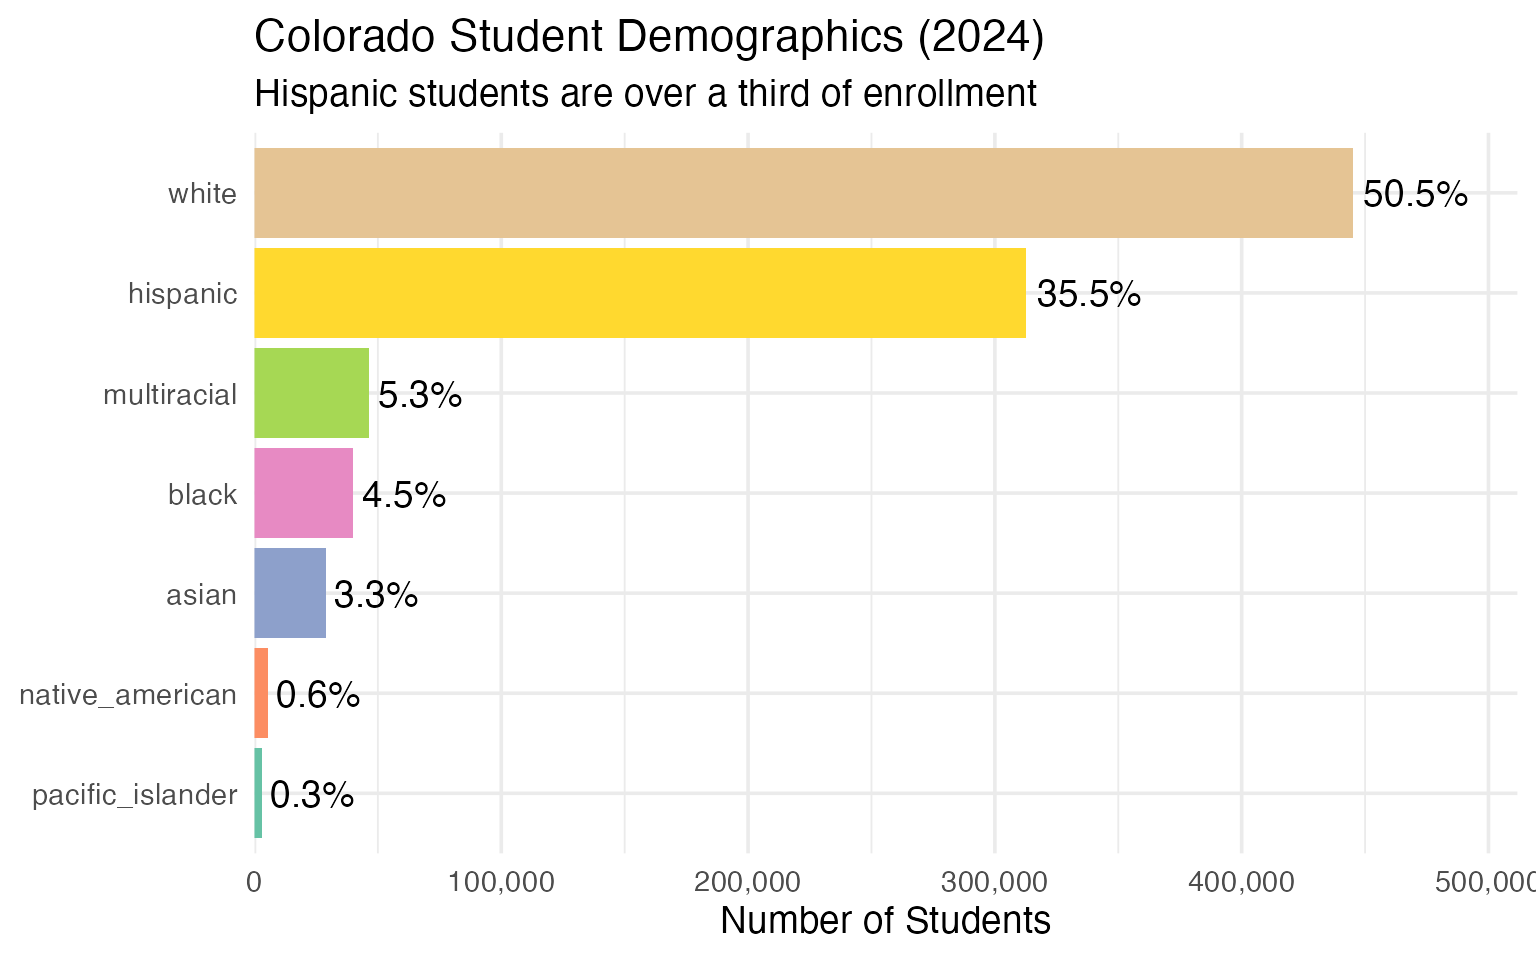
Data Taxonomy
| Category | Years | Function | Details |
|---|---|---|---|
| Enrollment | 2020, 2024 |
fetch_enr() / fetch_enr_multi()
|
State, district, school. Race, gender, FRPL, charter |
| Assessments | 2015-2019, 2021-2025 |
fetch_assessment() / fetch_assessment_multi()
|
CMAS: ELA, Math, Science, CSLA. State, district, school |
| Graduation | — | — | Not yet available |
| Directory | current | fetch_directory() |
School names, IDs, addresses, type |
| Per-Pupil Spending | — | — | Not yet available |
| Accountability | — | — | Not yet available |
| Chronic Absence | — | — | Not yet available |
| EL Progress | — | — | Not yet available |
| Special Ed | — | — | Not yet available |
See the full data category taxonomy for what each category covers.
Quick Start
R
# install.packages("remotes")
remotes::install_github("almartin82/coschooldata")
library(coschooldata)
library(dplyr)

# Fetch one year
enr_2024 <- fetch_enr(2024, use_cache = TRUE)

# Fetch multiple years
enr_multi <- fetch_enr_multi(c(2020, 2024), use_cache = TRUE)

# State totals
enr_2024 |>
  filter(is_state, subgroup == "total_enrollment", grade_level == "TOTAL")

# District breakdown
enr_2024 |>
  filter(is_district, subgroup == "total_enrollment", grade_level == "TOTAL") |>
  arrange(desc(n_students))

# Demographics
enr_2024 |>
  filter(is_state, grade_level == "TOTAL",
         subgroup %in% c("hispanic", "white", "black", "asian")) |>
  select(subgroup, n_students, pct)
Python
import pycoschooldata as co

# Fetch one year
enr_2024 = co.fetch_enr(2024)

# Fetch multiple years
enr_multi = co.fetch_enr_multi([2020, 2024])

# State totals
state_total = enr_2024[
    (enr_2024['is_state'] == True) &
    (enr_2024['subgroup'] == 'total_enrollment') &
    (enr_2024['grade_level'] == 'TOTAL')
]

# District breakdown
districts = enr_2024[
    (enr_2024['is_district'] == True) &
    (enr_2024['subgroup'] == 'total_enrollment') &
    (enr_2024['grade_level'] == 'TOTAL')
].sort_values('n_students', ascending=False)

# Demographics
demographics = enr_2024[
    (enr_2024['is_state'] == True) &
    (enr_2024['grade_level'] == 'TOTAL') &
    (enr_2024['subgroup'].isin(['hispanic', 'white', 'black', 'asian']))
][['subgroup', 'n_students', 'pct']]
Explore More
Full analysis with 15 stories: - Enrollment trends – 15 stories - Function reference
Data Notes
Source
Colorado Department of Education Student October Count: Pupil Membership
Data is from the Student October Count, collected on the first school day in October each year.
Note: The primary CDE data server (www.cde.state.co.us) has been down since January 2026. The package uses cached data while the server is unavailable. The new site (ed.cde.state.co.us) hosts pages but data file links still point to the old domain.
Available Years
| Years | Status | Notes |
|---|---|---|
| 2020, 2024 | Cached | Available via use_cache = TRUE
|
| 2020-2025 | Supported | When CDE server returns |
What’s Included
- Levels: State, district (~187), school (~1,900)
- Demographics: Hispanic, White, Black, Asian, Native American, Pacific Islander, Multiracial
- Gender: Male, Female
- Economic: Free/Reduced Lunch (2024 only)
- Charter: Charter school flag (2024 only)
- Grade levels: PK-12 plus totals (per-grade data in 2020; school-level totals in 2024)
Deeper Dive
4. Denver lost 3,877 students but remains the largest district
Denver County 1 dropped from 92,112 to 88,235 students, a 4.2% decline. Despite the losses, it is still Colorado’s biggest district by a wide margin.
denver <- enr |>
  filter(is_district, subgroup == "total_enrollment", grade_level == "TOTAL",
         grepl("Denver County", district_name)) |>
  select(end_year, district_name, n_students) |>
  mutate(change = n_students - lag(n_students),
         pct_change = round(change / lag(n_students) * 100, 2))

stopifnot(nrow(denver) > 0)
denver
#>   end_year   district_name n_students change pct_change
#> 1     2020 Denver County 1      92112     NA         NA
#> 2     2024 Denver County 1      88235  -3877      -4.21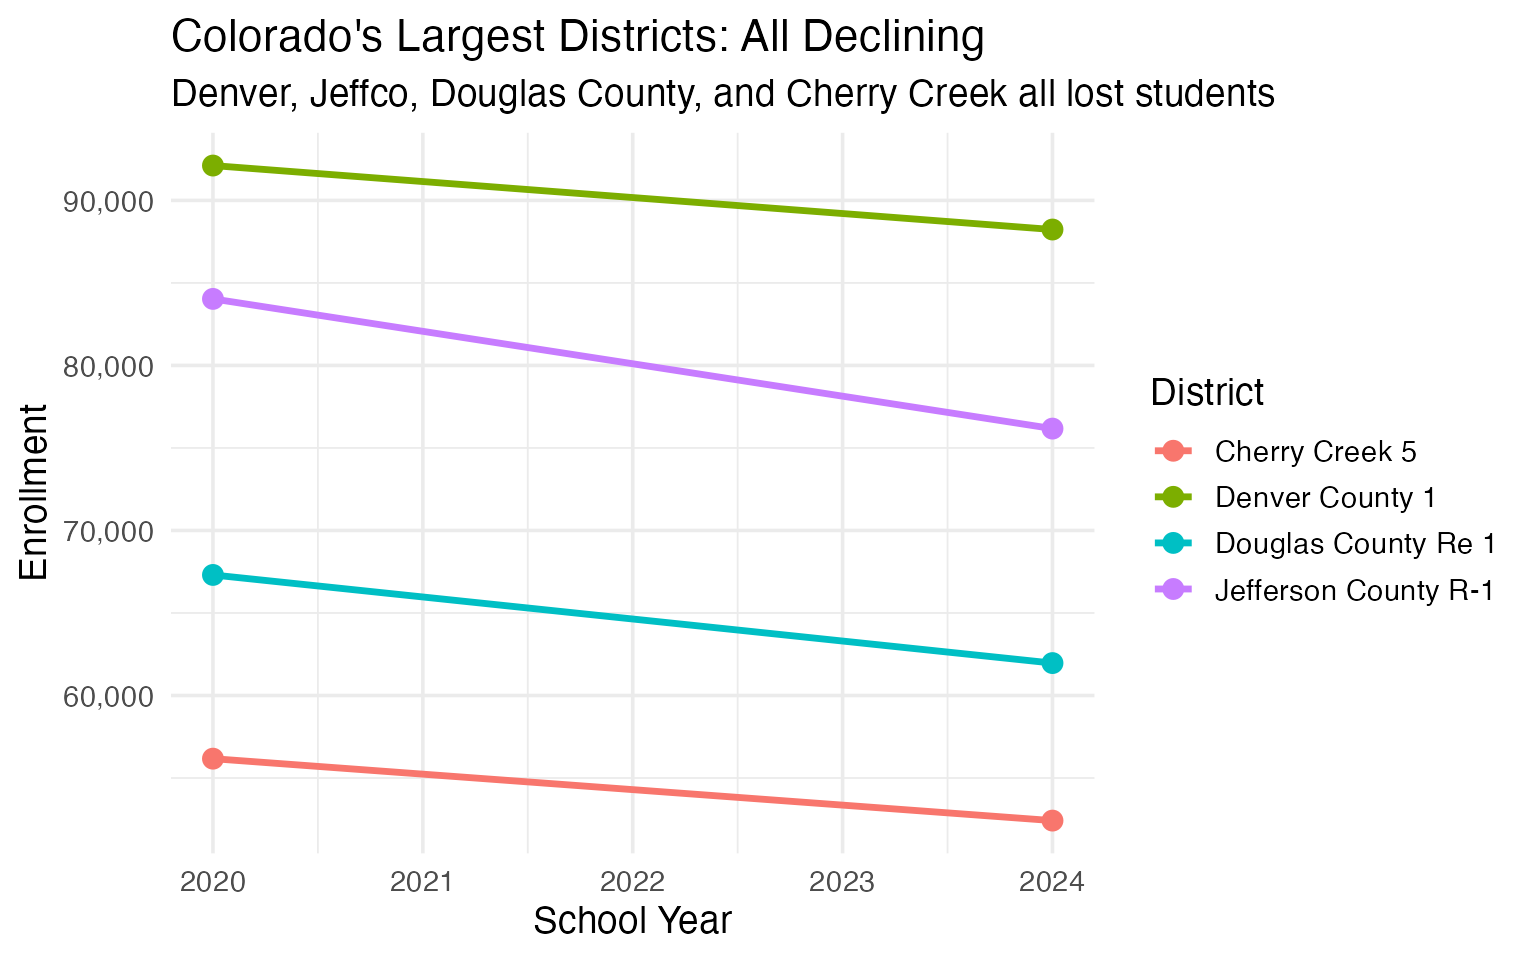
5. Jefferson County lost 7,860 students – shrinking faster than Denver
Jeffco shed 9.4% of its enrollment between 2020 and 2024, nearly 8,000 students. That is a steeper percentage decline than Denver.
jeffco <- enr |>
  filter(is_district, subgroup == "total_enrollment", grade_level == "TOTAL",
         grepl("Jefferson County", district_name)) |>
  select(end_year, district_name, n_students) |>
  mutate(change = n_students - lag(n_students),
         pct_change = round(change / lag(n_students) * 100, 2))

stopifnot(nrow(jeffco) > 0)
jeffco
#>   end_year        district_name n_students change pct_change
#> 1     2020 Jefferson County R-1      84032     NA         NA
#> 2     2024 Jefferson County R-1      76172  -7860      -9.35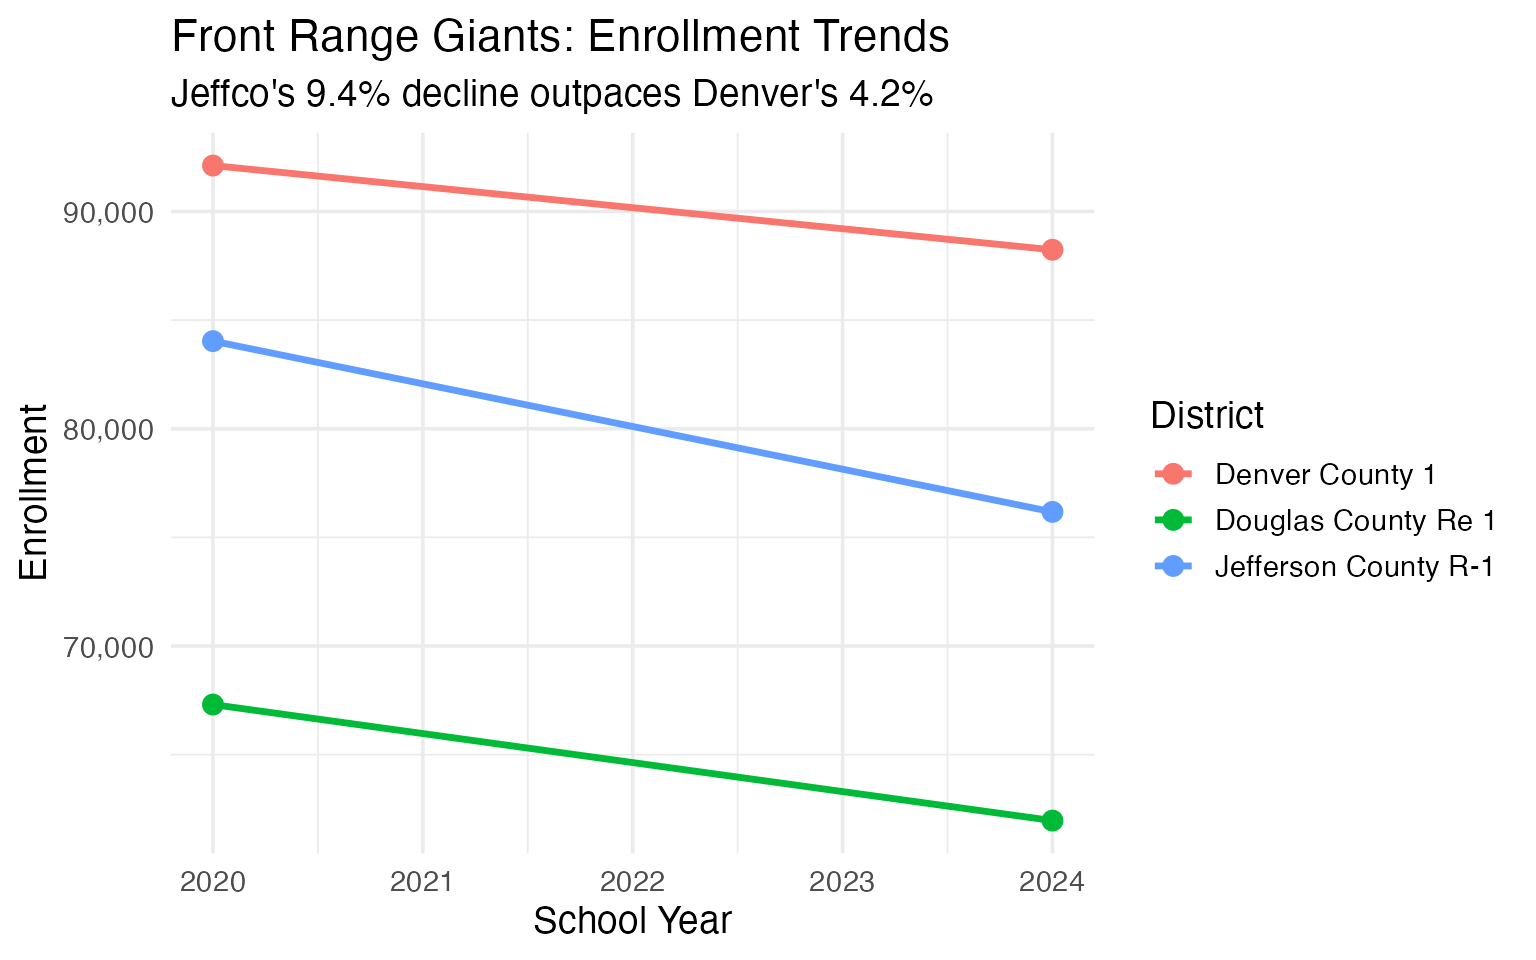
6. White share dropped below 52.9% to 50.5% in four years
White students are still the largest group but their share fell 2.4 percentage points while the multiracial population surged from 4.5% to 5.3%.
demo_shift <- enr |>
  filter(is_state, grade_level == "TOTAL",
         subgroup %in% c("hispanic", "white", "black", "asian", "multiracial")) |>
  select(end_year, subgroup, n_students, pct) |>
  mutate(pct = round(pct * 100, 1))

stopifnot(nrow(demo_shift) > 0)
demo_shift
#>    end_year    subgroup n_students  pct
#> 1      2020       asian      29207  3.2
#> 2      2020       black      41550  4.6
#> 3      2020    hispanic     309900 33.9
#> 4      2020 multiracial      40785  4.5
#> 5      2020       white     482951 52.9
#> 6      2024       asian      28899  3.3
#> 7      2024       black      40070  4.5
#> 8      2024    hispanic     312685 35.5
#> 9      2024 multiracial      46570  5.3
#> 10     2024       white     444973 50.5
7. 261 charter schools serve 135,223 students
Colorado has one of the most expansive charter sectors in the country. Charter schools now enroll 15.3% of all public school students.
charters <- enr_2024 |>
  filter(is_school, is_charter, subgroup == "total_enrollment", grade_level == "TOTAL")

state_total <- enr_2024 |>
  filter(is_state, subgroup == "total_enrollment", grade_level == "TOTAL") |>
  pull(n_students)

charter_summary <- tibble(
  sector = c("All Public Schools", "Charter Schools"),
  enrollment = c(state_total, sum(charters$n_students, na.rm = TRUE)),
  pct = c(100, round(sum(charters$n_students, na.rm = TRUE) / state_total * 100, 1))
)

stopifnot(charter_summary$enrollment[2] > 0)
charter_summary
#> # A tibble: 2 x 3
#>   sector             enrollment   pct
#>   <chr>                   <dbl> <dbl>
#> 1 All Public Schools     881446 100
#> 2 Charter Schools        135223  15.3
top_charters <- charters |>
  arrange(desc(n_students)) |>
  head(5) |>
  select(district_name, campus_name, n_students)

print(top_charters)
#>              district_name                     campus_name n_students
#> 1              District 49                    GOAL Academy       6142
#> 2      Douglas County Re 1                American Academy       2579
#> 3               Academy 20   The Classical Academy Charter       2149
#> 4 Charter School Institute Colorado Early Colleges Windsor       2139
#> 5 Charter School Institute     The Pinnacle Charter School       1909
8. Adams-Arapahoe (Aurora) is Colorado’s most diverse district
Aurora Public Schools has no racial majority. Hispanic students make up 57.3%, followed by Black (16.8%), White (13.7%), Multiracial (5.9%), and Asian (4.8%).
aurora <- enr_2024 |>
  filter(is_district, grade_level == "TOTAL",
         grepl("Adams-Arapahoe", district_name),
         subgroup %in% c("hispanic", "white", "black", "asian", "multiracial")) |>
  mutate(pct = round(pct * 100, 1)) |>
  select(district_name, subgroup, n_students, pct) |>
  arrange(desc(pct))

stopifnot(nrow(aurora) > 0)
aurora
#>        district_name    subgroup n_students  pct
#> 1 Adams-Arapahoe 28J    hispanic      22430 57.3
#> 2 Adams-Arapahoe 28J       black       6573 16.8
#> 3 Adams-Arapahoe 28J       white       5355 13.7
#> 4 Adams-Arapahoe 28J multiracial       2305  5.9
#> 5 Adams-Arapahoe 28J       asian       1867  4.8
9. Nearly half of Colorado students qualify for free or reduced lunch
45.2% of Colorado students – 398,112 children – are economically disadvantaged, qualifying for free or reduced-price lunch.
frl <- enr_2024 |>
  filter(is_state, grade_level == "TOTAL",
         subgroup == "free_reduced_lunch") |>
  mutate(pct = round(pct * 100, 1)) |>
  select(subgroup, n_students, pct)

stopifnot(nrow(frl) > 0)
frl
#>             subgroup n_students  pct
#> 1 free_reduced_lunch     398112 45.2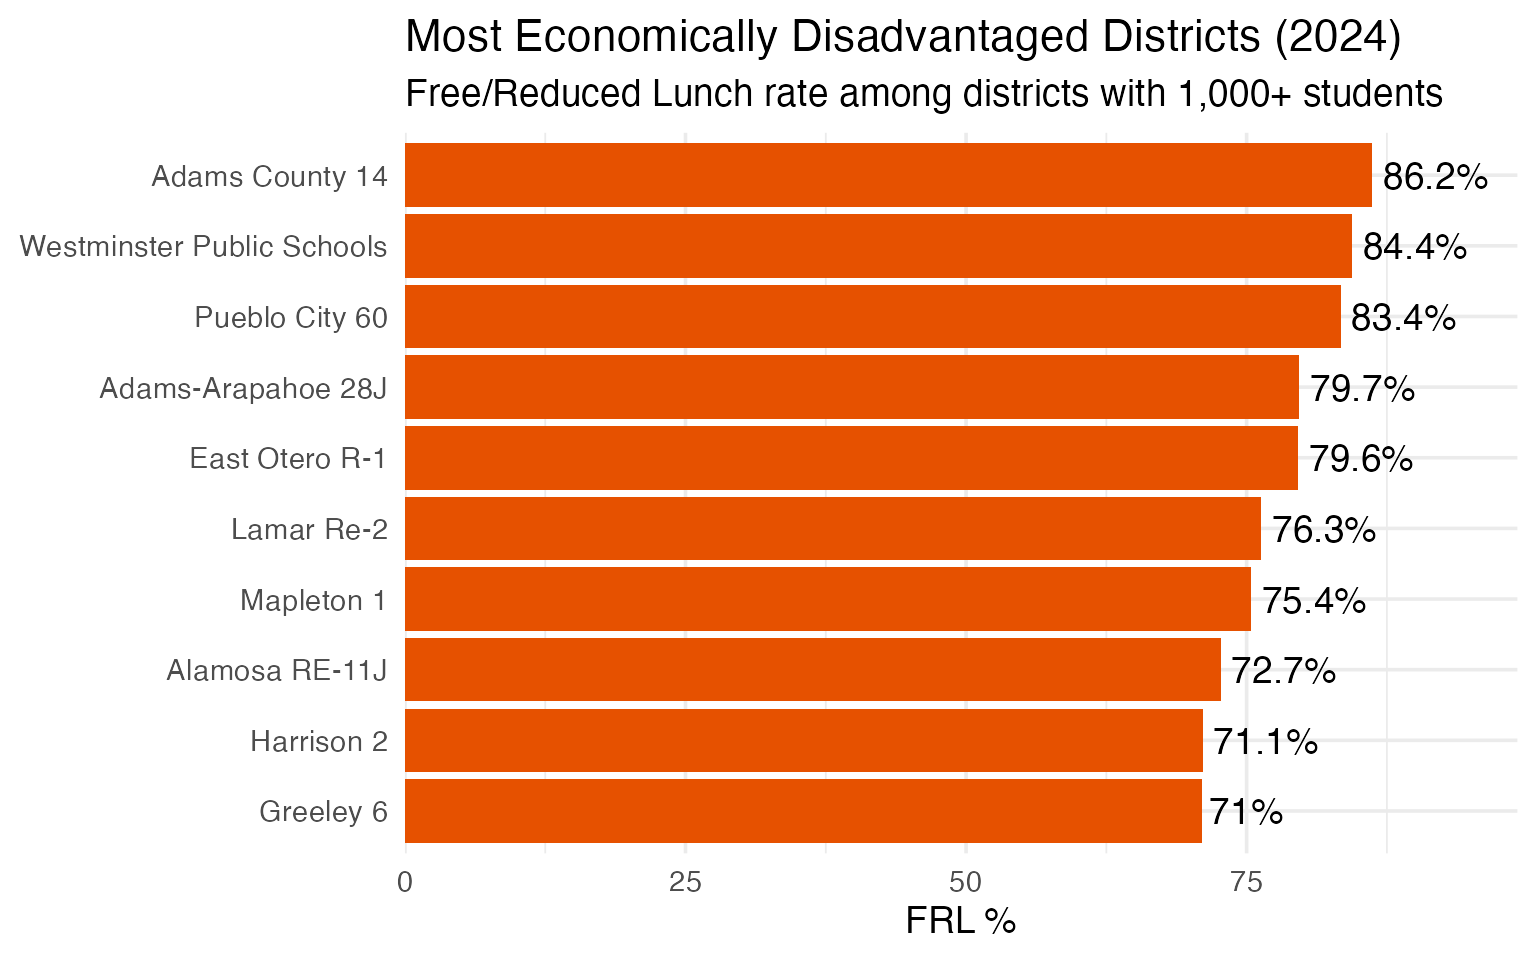
10. Byers 32J grew 175% in four years
Byers 32J, northeast of Denver, surged from 2,344 to 6,456 students – the fastest growth rate of any district in Colorado.
changes <- enr |>
  filter(is_district, subgroup == "total_enrollment", grade_level == "TOTAL") |>
  select(end_year, district_name, n_students) |>
  pivot_wider(names_from = end_year, values_from = n_students, values_fn = sum) |>
  filter(!is.na(`2020`) & !is.na(`2024`)) |>
  mutate(change = `2024` - `2020`,
         pct_change = round(change / `2020` * 100, 1)) |>
  filter(`2020` >= 1000)

gainers <- changes |>
  arrange(desc(pct_change)) |>
  head(10)

stopifnot(nrow(gainers) > 0)
gainers
#> # A tibble: 10 x 5
#>    district_name                `2020` `2024` change pct_change
#>    <chr>                         <dbl>  <dbl>  <dbl>      <dbl>
#>  1 Byers 32J                      2344   6456   4112      175.4
#>  2 Education reEnvisioned BOCES   2836   7114   4278      150.8
#>  3 Bennett 29J                    1117   1645    528       47.3
#>  4 Charter School Institute      18275  23013   4738       25.9
#>  5 School District 27J           19248  23108   3860       20.1
#>  6 Elizabeth School District      2373   2614    241       10.2
#>  7 Strasburg 31J                  1080   1187    107        9.9
#>  8 District 49                   23890  25799   1909        8.0
#>  9 Platte Valley RE-7             1093   1179     86        7.9
#> 10 Harrison 2                    11518  12386    868        7.5
11. 115 tiny districts serve fewer than 1,000 students each
Colorado has an extraordinarily fragmented school system. Over 60% of districts enroll fewer than 1,000 students, though they educate a small fraction of the total.
size_cats <- enr_2024 |>
  filter(is_district, subgroup == "total_enrollment", grade_level == "TOTAL") |>
  mutate(size = case_when(
    n_students >= 20000 ~ "Large (20K+)",
    n_students >= 5000 ~ "Medium (5K-20K)",
    n_students >= 1000 ~ "Small (1K-5K)",
    TRUE ~ "Tiny (<1K)"
  )) |>
  group_by(size) |>
  summarize(
    n_districts = n(),
    total_students = sum(n_students),
    .groups = "drop"
  ) |>
  mutate(pct_students = round(total_students / sum(total_students) * 100, 1))

stopifnot(nrow(size_cats) > 0)
size_cats
#> # A tibble: 4 x 4
#>   size            n_districts total_students pct_students
#>   <chr>                 <int>          <dbl>        <dbl>
#> 1 Large (20K+)             16         607827         69.0
#> 2 Medium (5K-20K)          18         155496         17.6
#> 3 Small (1K-5K)            37          78414          8.9
#> 4 Tiny (<1K)              115          39709          4.5
12. Las Animas RE-1 lost 60% of its enrollment
The starkest decline in Colorado. Las Animas RE-1 went from 2,406 students in 2020 to just 956 in 2024 – a loss of 1,450 students.
losers <- changes |>
  arrange(pct_change) |>
  head(10)

stopifnot(nrow(losers) > 0)
losers
#> # A tibble: 10 x 5
#>    district_name              `2020` `2024` change pct_change
#>    <chr>                       <dbl>  <dbl>  <dbl>      <dbl>
#>  1 Las Animas RE-1              2406    956  -1450      -60.3
#>  2 Cheyenne Mountain 12         5309   3739  -1570      -29.6
#>  3 Mapleton 1                   9131   7017  -2114      -23.2
#>  4 Sheridan 2                   1359   1058   -301      -22.1
#>  5 Adams County 14              6610   5484  -1126      -17.0
#>  6 Valley RE-1                  2258   1887   -371      -16.4
#>  7 Westminster Public Schools   9089   7631  -1458      -16.0
#>  8 Manitou Springs 14           1441   1238   -203      -14.1
#>  9 Monte Vista C-8              1168   1010   -158      -13.5
#> 10 Ellicott 22                  1142    990   -152      -13.3
13. Adams County 14 has 86% economically disadvantaged students
Adams County 14, in the northern Denver metro area, has the highest free/reduced lunch rate among districts with 1,000+ students.
frl_top5 <- enr_2024 |>
  filter(is_district, subgroup == "free_reduced_lunch", grade_level == "TOTAL") |>
  mutate(pct = round(pct * 100, 1)) |>
  filter(n_students >= 1000) |>
  arrange(desc(pct)) |>
  head(5) |>
  select(district_name, n_students, pct)

stopifnot(nrow(frl_top5) > 0)
frl_top5
#>                district_name n_students  pct
#> 1            Adams County 14       4728 86.2
#> 2 Westminster Public Schools       6442 84.4
#> 3             Pueblo City 60      12130 83.4
#> 4         Adams-Arapahoe 28J      31204 79.7
#> 5             East Otero R-1       1055 79.6
14. Colorado’s gender split: 51.3% male, 48.7% female
Like most states, Colorado enrolls slightly more boys than girls – a gap of about 23,000 students.
gender <- enr_2024 |>
  filter(is_state, grade_level == "TOTAL",
         subgroup %in% c("male", "female")) |>
  mutate(pct = round(pct * 100, 1)) |>
  select(subgroup, n_students, pct)

stopifnot(nrow(gender) == 2)
gender
#>   subgroup n_students  pct
#> 1   female     428834 48.7
#> 2     male     452215 51.3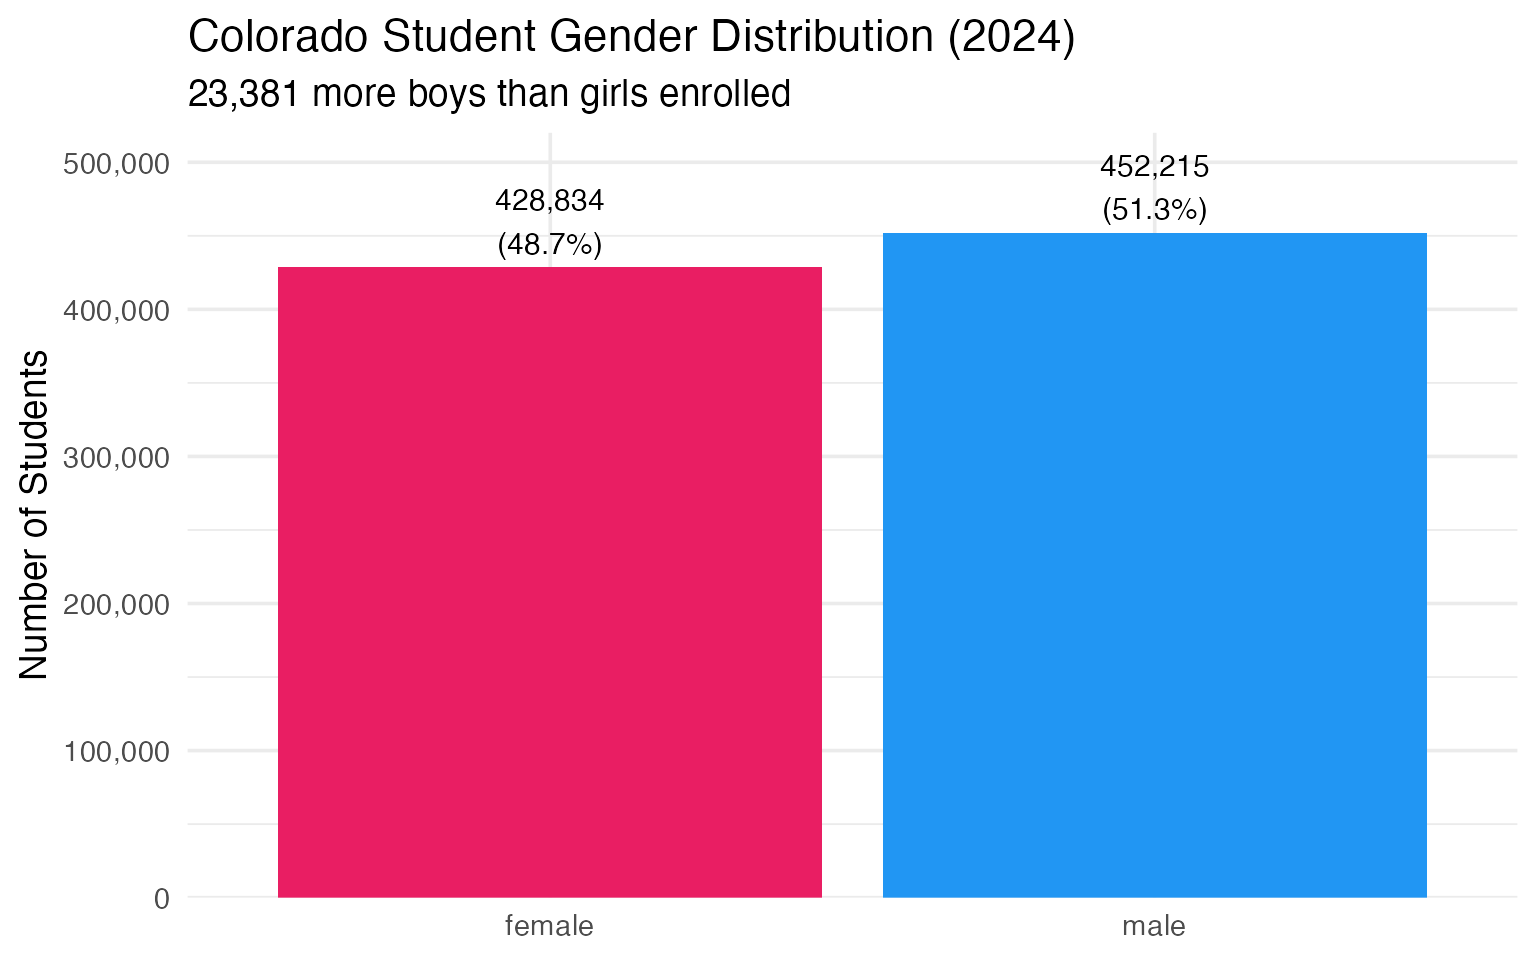
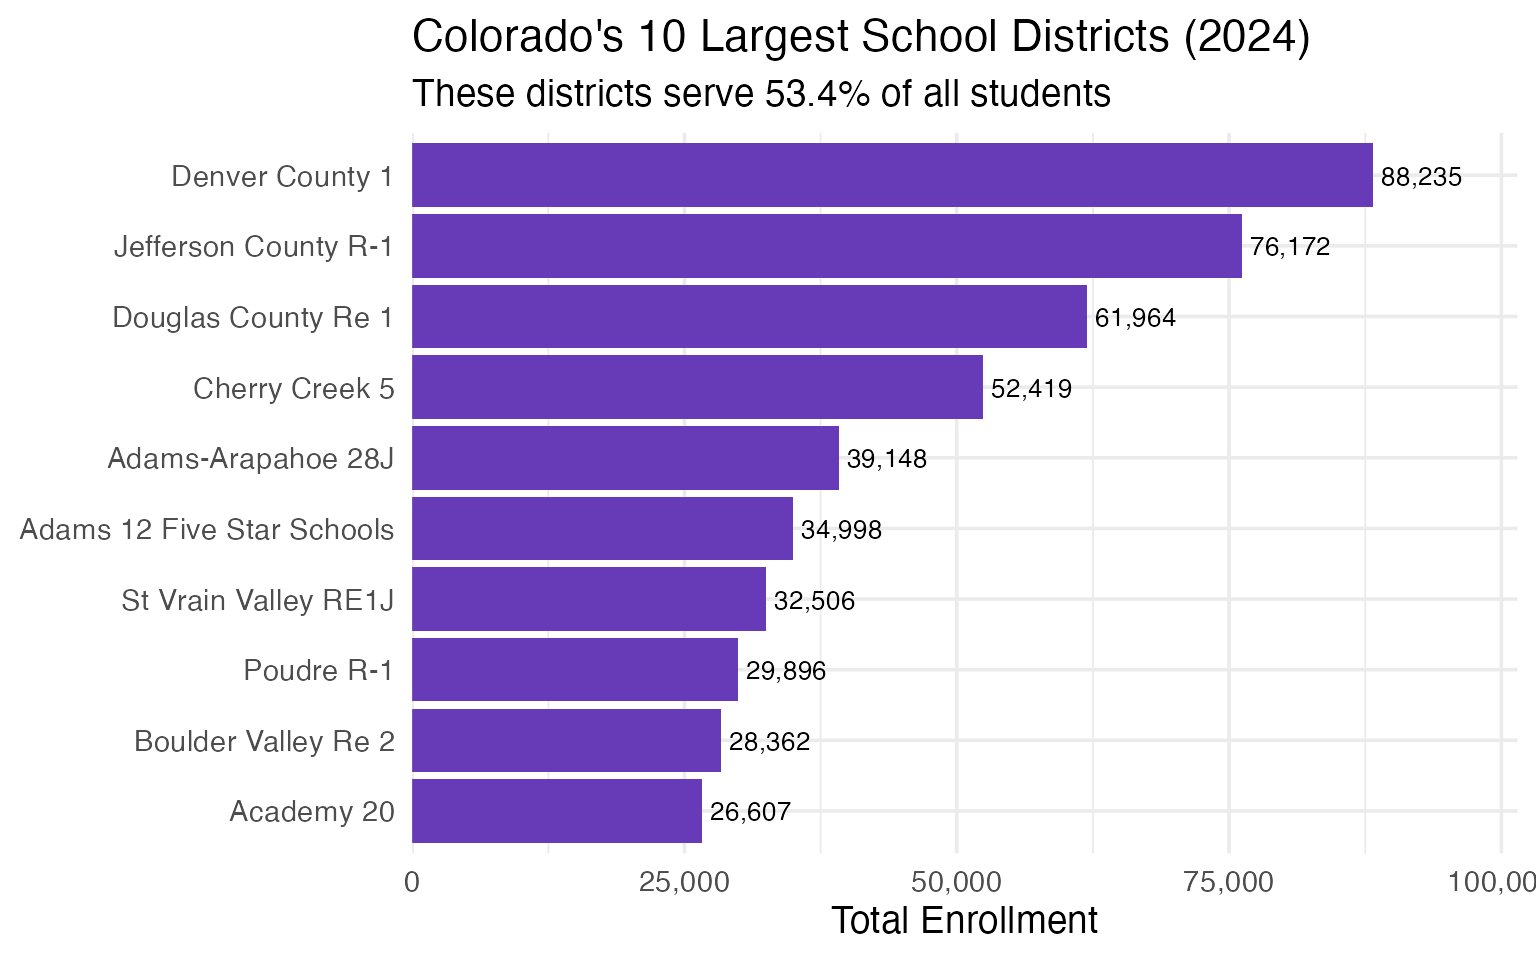
15. Top 10 districts serve 55% of all students
Just 10 districts out of 187 educate more than half of Colorado’s public school students, showing extreme concentration of enrollment in the Front Range metro areas.
district_totals <- enr_2024 |>
  filter(is_district, subgroup == "total_enrollment", grade_level == "TOTAL") |>
  arrange(desc(n_students)) |>
  head(10) |>
  select(district_name, n_students)

state_total_val <- enr_2024 |>
  filter(is_state, subgroup == "total_enrollment", grade_level == "TOTAL") |>
  pull(n_students)

top_10_pct <- round(sum(district_totals$n_students) / state_total_val * 100, 1)

result <- district_totals |>
  mutate(pct_of_state = round(n_students / state_total_val * 100, 1))

stopifnot(nrow(result) == 10)
result
#>                 district_name n_students pct_of_state
#>  1             Denver County 1      88235         10.0
#>  2        Jefferson County R-1      76172          8.6
#>  3         Douglas County Re 1      61964          7.0
#>  4              Cherry Creek 5      52419          5.9
#>  5          Adams-Arapahoe 28J      39148          4.4
#>  6  Adams 12 Five Star Schools      34998          4.0
#>  7        St Vrain Valley RE1J      32506          3.7
#>  8                  Poudre R-1      29896          3.4
#>  9         Boulder Valley Re 2      28362          3.2
#> 10                 Academy 20      26607          3.0