Fetch and analyze Louisiana school enrollment data from the Louisiana Department of Education (LDOE) in R or Python.
Part of the njschooldata family.
Full documentation — all 15 stories with interactive charts, getting-started guide, and complete function reference.
Highlights
library(laschooldata)
library(ggplot2)
library(dplyr)
library(scales)

theme_readme <- function() {
  theme_minimal(base_size = 14) +
    theme(
      plot.title = element_text(face = "bold", size = 16),
      plot.subtitle = element_text(color = "gray40"),
      panel.grid.minor = element_blank(),
      legend.position = "bottom"
    )
}

colors <- c("total" = "#2C3E50", "white" = "#3498DB", "black" = "#E74C3C",
            "hispanic" = "#F39C12", "asian" = "#9B59B6")

enr <- fetch_enr_multi(2019:2024, use_cache = TRUE)
enr_current <- fetch_enr(2024, use_cache = TRUE)

# Calculate state totals for percentage calculations
state_totals <- enr %>%
  filter(is_state, grade_level == "TOTAL", subgroup == "total_enrollment") %>%
  select(end_year, total = n_students)
1. White students fell below Black students for the first time
White enrollment dropped from 47.1% in 2019 to 40.7% in 2024, while Black students held steady at 41.7%, making Louisiana’s public schools majority-minority.
demo <- enr %>%
  filter(is_state, grade_level == "TOTAL",
         subgroup %in% c("white", "black", "hispanic", "asian")) %>%
  left_join(state_totals, by = "end_year") %>%
  mutate(pct = n_students / total * 100)
stopifnot(nrow(demo) > 0)
demo %>% filter(end_year == 2024) %>% select(subgroup, n_students, pct)
#>   subgroup n_students      pct
#> 1    asian      10745   1.5878
#> 2    black     282521  41.7441
#> 3 hispanic      77836  11.5010
#> 4    white     275265  40.6721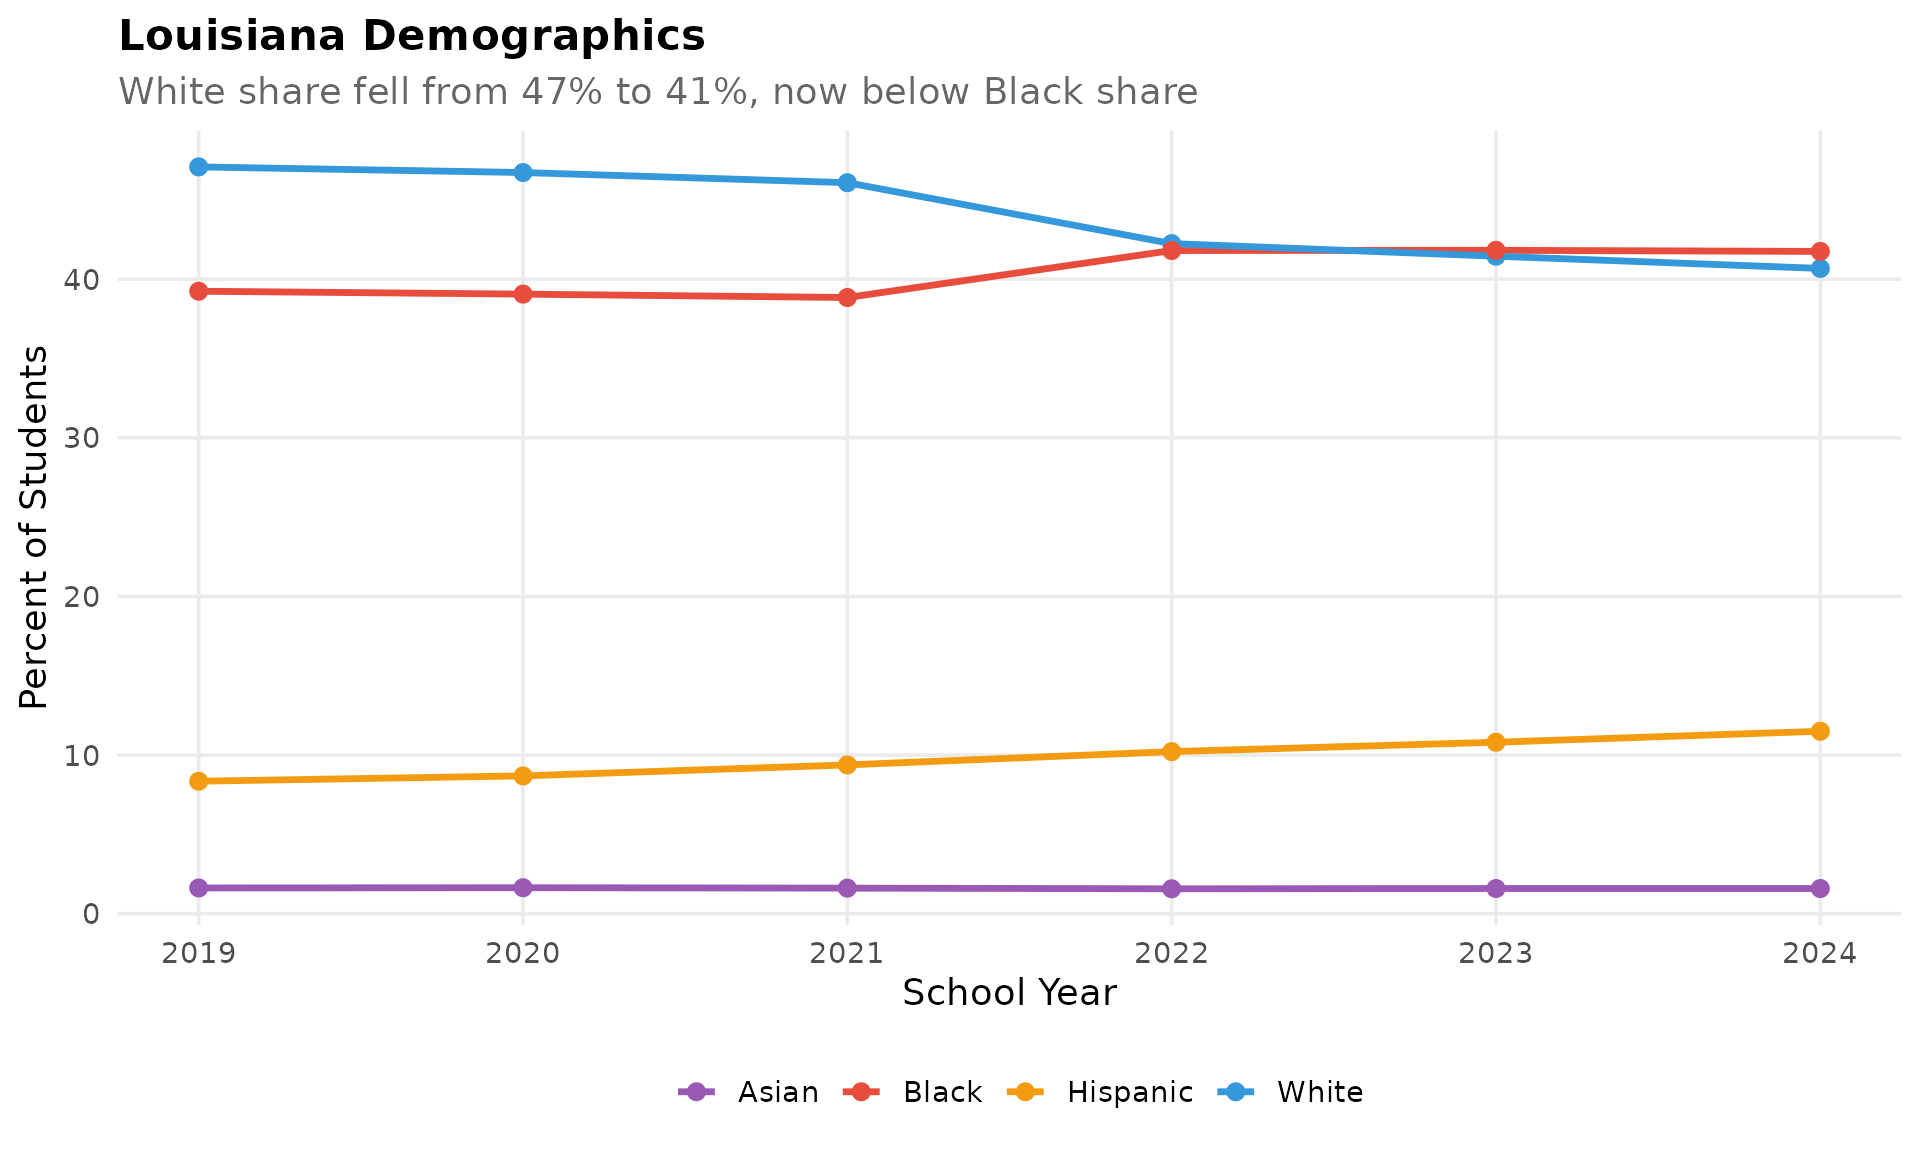
2. Calcasieu Parish never recovered from Hurricane Laura
Calcasieu Parish (Lake Charles) lost 11.3% of enrollment in a single year (2019-2020) after Hurricane Laura devastated southwest Louisiana.
calcasieu <- enr %>%
  filter(is_district, district_name == "Calcasieu Parish",
         subgroup == "total_enrollment", grade_level == "TOTAL")
stopifnot(nrow(calcasieu) > 0)
calcasieu %>% select(end_year, district_name, n_students)
#>   end_year    district_name n_students
#> 1     2019 Calcasieu Parish      31879
#> 2     2020 Calcasieu Parish      28265
#> 3     2021 Calcasieu Parish      27681
#> 4     2022 Calcasieu Parish      27871
#> 5     2023 Calcasieu Parish      28392
#> 6     2024 Calcasieu Parish      28623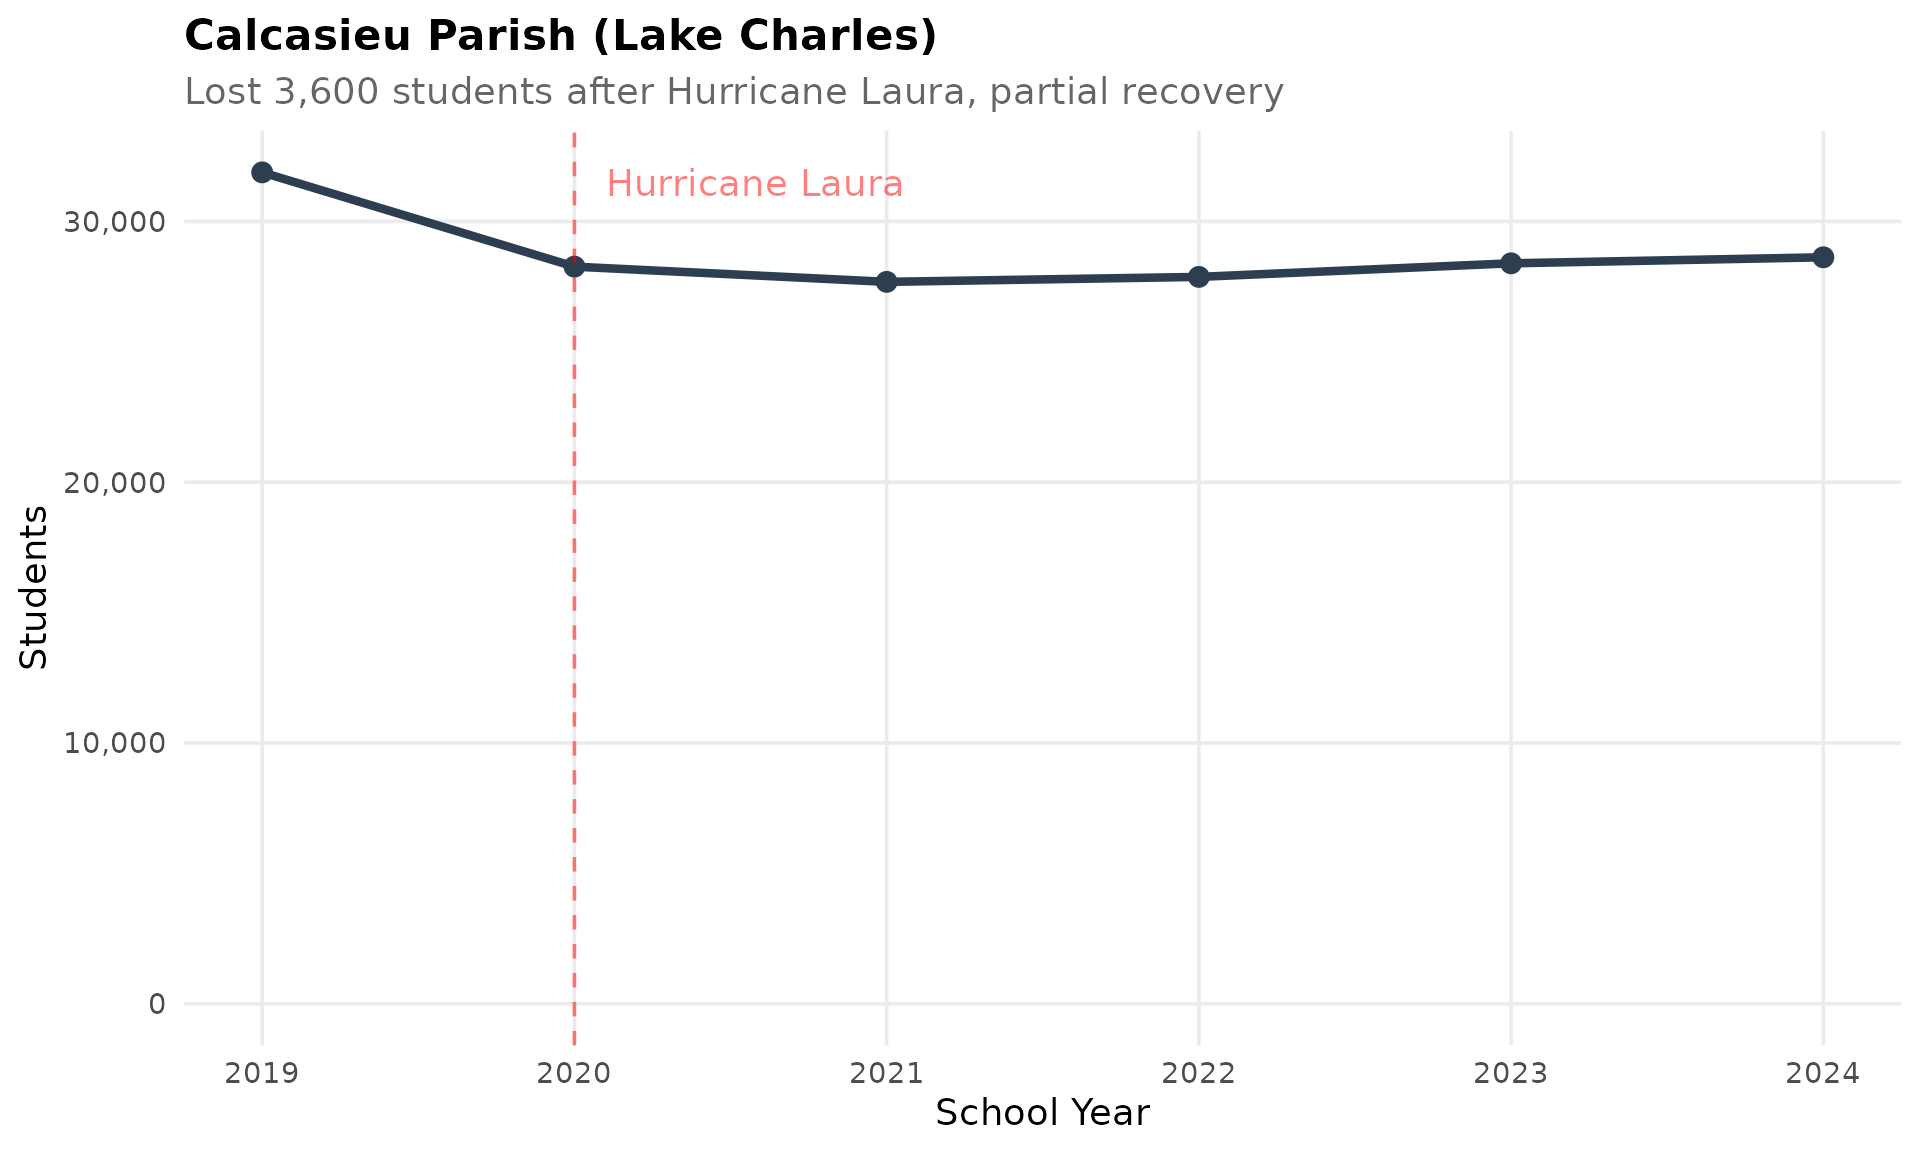
3. Hispanic enrollment surged 45% in five years
Hispanic students grew from 53,778 (8.4%) in 2019 to 77,836 (11.5%) in 2024, the fastest-growing demographic group in Louisiana schools.
hisp <- enr %>%
  filter(is_state, grade_level == "TOTAL", subgroup == "hispanic") %>%
  left_join(state_totals, by = "end_year") %>%
  mutate(pct = n_students / total * 100)
stopifnot(nrow(hisp) > 0)
hisp %>% select(end_year, n_students, pct)
#>   end_year n_students       pct
#> 1     2019      53778   8.35073
#> 2     2020      54251   8.68684
#> 3     2021      57761   9.37892
#> 4     2022      70054  10.21793
#> 5     2023      73627  10.80900
#> 6     2024      77836  11.50105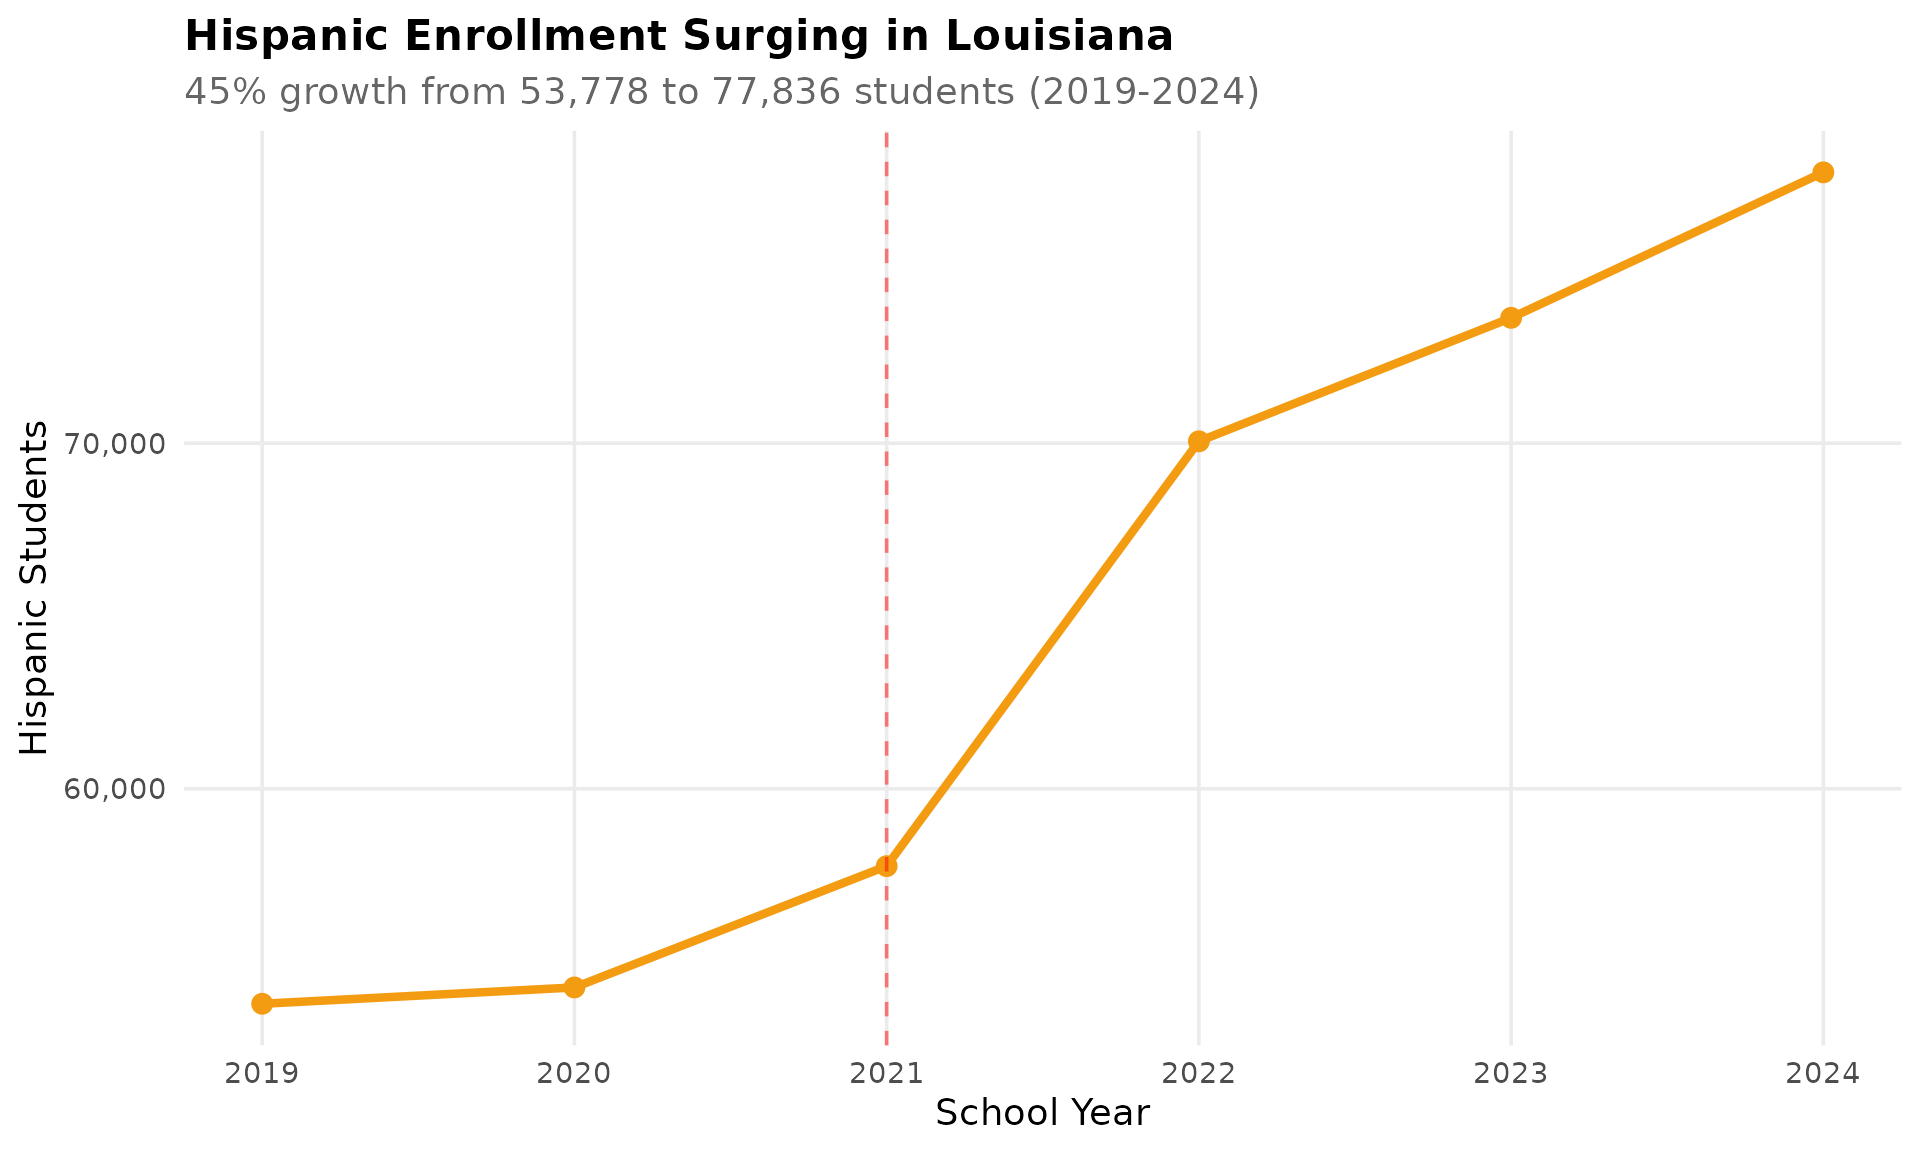
Data Taxonomy
| Category | Years | Function | Details |
|---|---|---|---|
| Enrollment | 2019-2024 |
fetch_enr() / fetch_enr_multi()
|
State, district, school. Race, gender, FRPL, LEP |
| Assessments | 2018-2019, 2021-2025 |
fetch_assessment() / fetch_assessment_multi()
|
LEAP 2025. ELA, Math, Science, Social Studies |
| Directory | 2026 | fetch_directory() |
School names, addresses, coordinates, grades served |
| Graduation | — | — | Not yet available |
| Per-Pupil Spending | — | — | Not yet available |
| Accountability | — | — | Not yet available |
| Chronic Absence | — | — | Not yet available |
| EL Progress | — | — | Not yet available |
| Special Ed | — | — | Not yet available |
See DATA-CATEGORY-TAXONOMY.md for what each category covers.
Quick Start
R
# install.packages("remotes")
remotes::install_github("almartin82/laschooldata")
library(laschooldata)
library(dplyr)

# Fetch one year
enr_2024 <- fetch_enr(2024)

# Fetch recent years
enr_recent <- fetch_enr_multi(2020:2024)

# State totals
enr_2024 %>%
  filter(is_state, subgroup == "total_enrollment", grade_level == "TOTAL")

# Parish (district) breakdown
enr_2024 %>%
  filter(is_district, subgroup == "total_enrollment", grade_level == "TOTAL") %>%
  arrange(desc(n_students))

# Demographics statewide
enr_2024 %>%
  filter(is_state, grade_level == "TOTAL",
         subgroup %in% c("white", "black", "hispanic", "asian")) %>%
  select(subgroup, n_students)
Python
import pylaschooldata as la

# Fetch 2024 data (2023-24 school year)
enr = la.fetch_enr(2024)

# Statewide total
total = enr[(enr['is_state']) & (enr['grade_level'] == 'TOTAL') &
            (enr['subgroup'] == 'total_enrollment')]['n_students'].sum()
print(f"{total:,} students")
#> 676,751 students

# Get multiple years
enr_multi = la.fetch_enr_multi([2020, 2021, 2022, 2023, 2024])

# Check available years
years = la.get_available_years()
print(f"Data available: {years['min_year']}-{years['max_year']}")
#> Data available: 2019-2024
Explore More
- Full documentation — all 15 stories with interactive charts
- Enrollment trends — 15 stories
- Function reference
Data Notes
Data Source
Data is sourced directly from the Louisiana Department of Education (LDOE) Multi Stats files: - Primary URL: https://www.louisianabelieves.com/resources/library/student-attributes - Data Center: https://doe.louisiana.gov/data-and-reports/enrollment-data
Snapshot Date
Enrollment counts are based on October 1st (MFP - Minimum Foundation Program) counts each school year.
Suppression Rules
LDOE applies FERPA suppression to protect student privacy: - Counts under 10 may be suppressed at the school level - Small cells in demographic breakdowns may show as NA
Data Quality Notes
- Gender data is stored as percentages in the source files, then converted to counts using total enrollment
- No “Orleans Parish” district exists in the LDOE data – post-Katrina reorganization split New Orleans schools across multiple entities
- No charter school district – charter schools are included with their authorizing parish
- Extension Academy and T9 (transitional 9th grade) data may not be available for all years/parishes
What’s Included
- Levels: State, District (75 entities), Campus (school)
- Demographics: White, Black, Hispanic, Asian, Native American, Pacific Islander, Multiracial
- Special populations: Economically disadvantaged, LEP/English learners
- Grade levels: PK through 12 (plus special education infant/preschool)
Deeper Dive
4. Louisiana added 33,000 students since 2019
Statewide enrollment grew 5.1% from 2019 to 2024, rising from 644,000 to 677,000 students.
state_trend <- enr %>%
  filter(is_state, subgroup == "total_enrollment", grade_level == "TOTAL") %>%
  select(end_year, n_students)
stopifnot(nrow(state_trend) > 0)
state_trend
#>   end_year n_students
#> 1     2019     643986
#> 2     2020     624527
#> 3     2021     615839
#> 4     2022     685606
#> 5     2023     681176
#> 6     2024     676751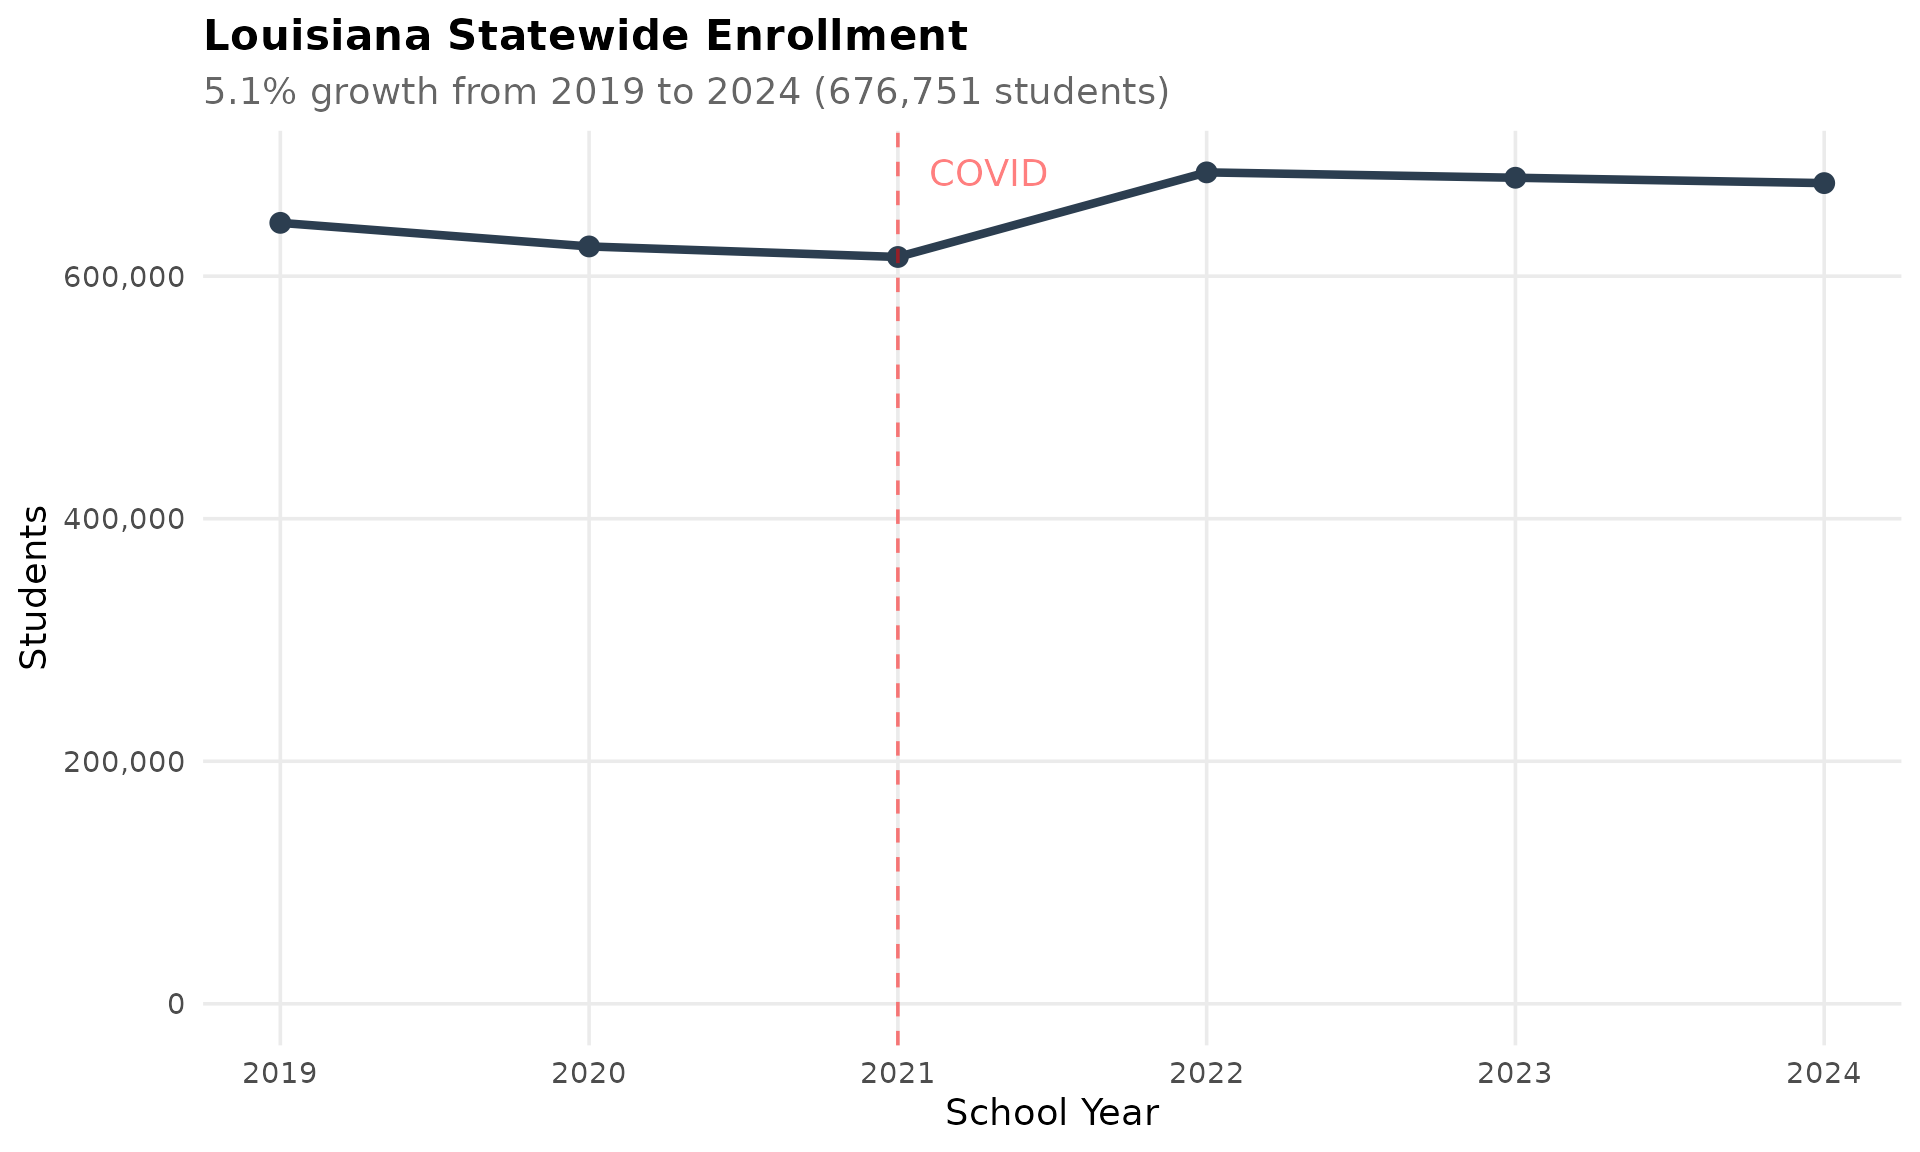
5. Jefferson Parish is Louisiana’s largest district
Jefferson Parish enrolls 47,702 students, leading all districts and outpacing East Baton Rouge (39,932) and St. Tammany (36,384).
top5 <- enr_current %>%
  filter(is_district, subgroup == "total_enrollment", grade_level == "TOTAL",
         district_name != "State of Louisiana") %>%
  arrange(desc(n_students)) %>%
  head(5)
stopifnot(nrow(top5) > 0)
top5 %>% select(district_name, n_students)
#>              district_name n_students
#> 1        Jefferson Parish      47702
#> 2 East Baton Rouge Parish      39932
#> 3      St. Tammany Parish      36384
#> 4            Caddo Parish      32614
#> 5        Lafayette Parish      29877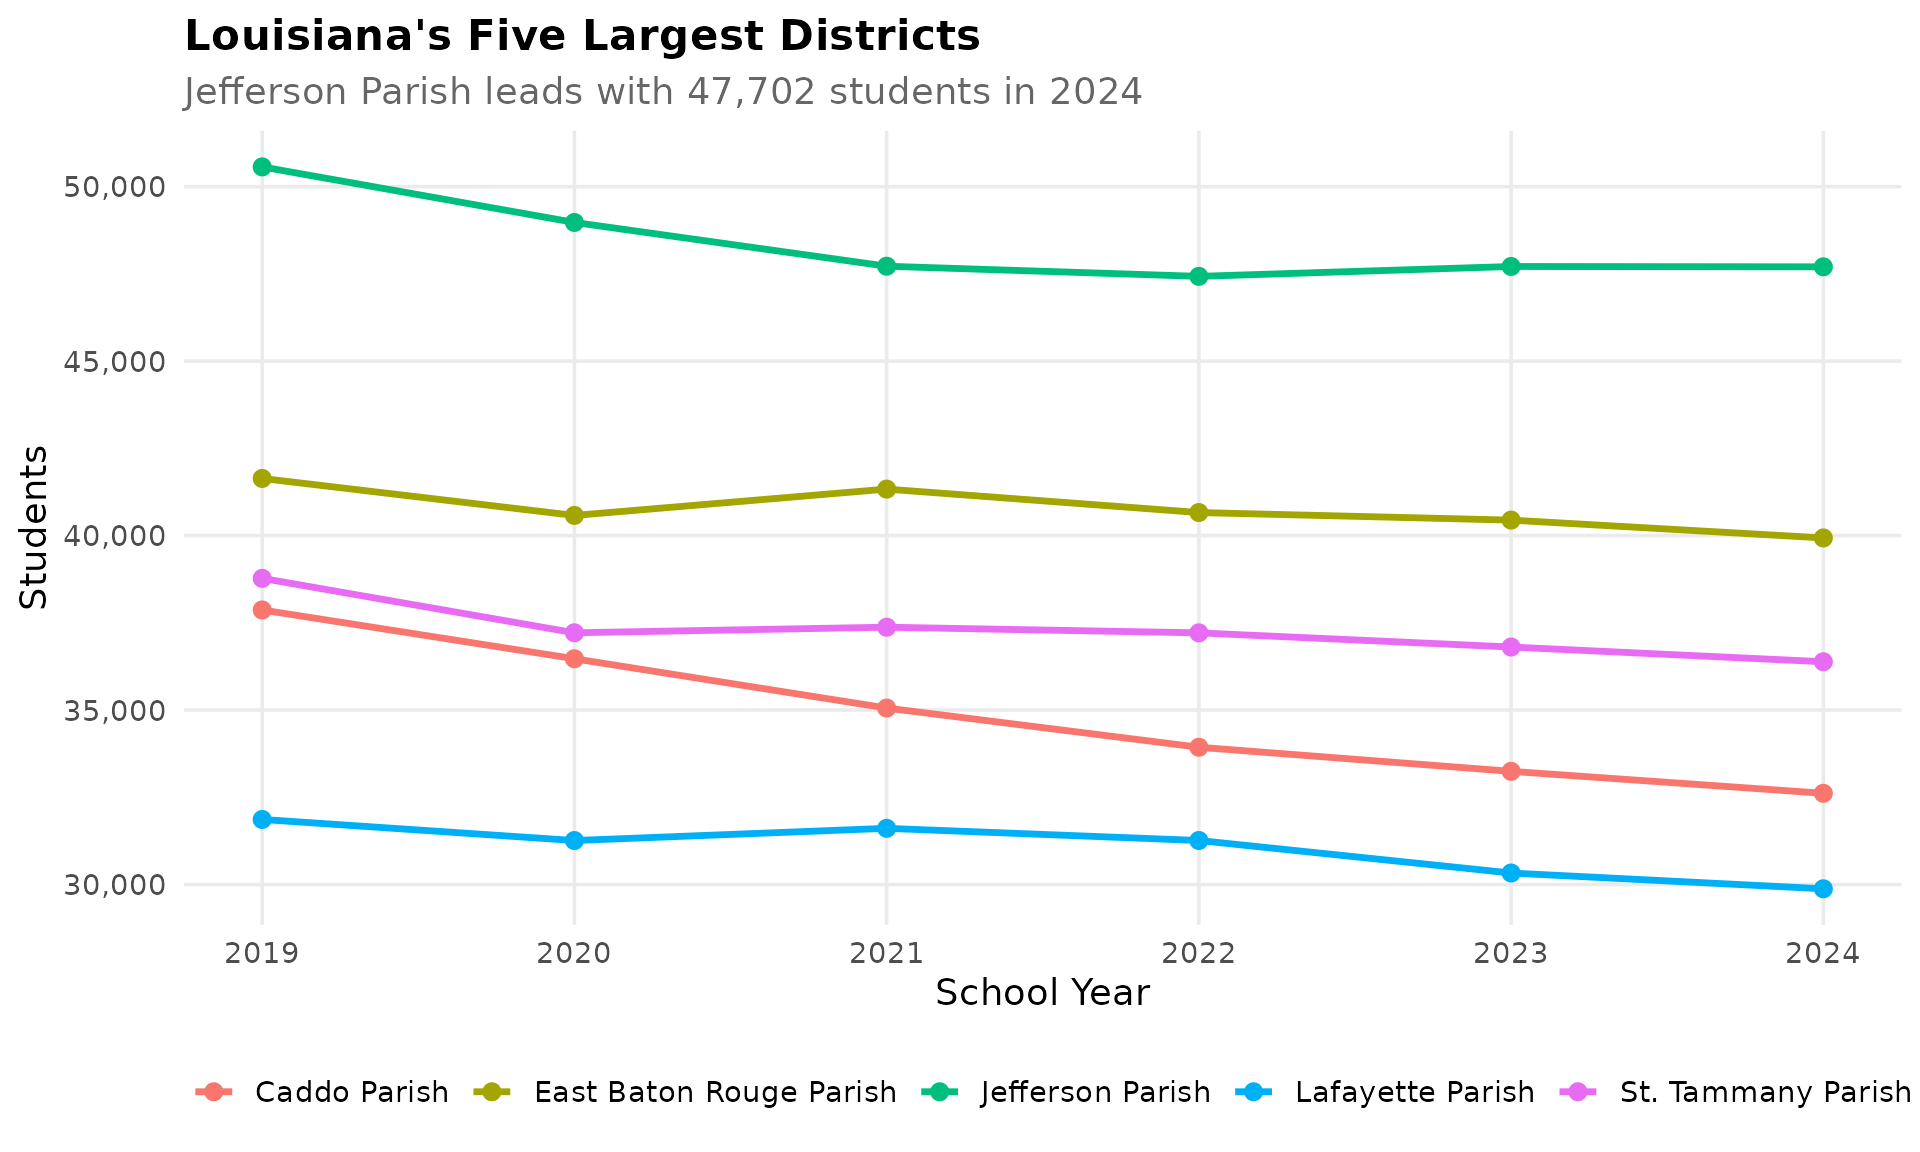
6. Caddo Parish lost 14% of its students in five years
Caddo Parish (Shreveport) dropped from 37,868 students in 2019 to 32,614 in 2024, a loss of over 5,200 students.
caddo <- enr %>%
  filter(is_district, district_name == "Caddo Parish",
         subgroup == "total_enrollment", grade_level == "TOTAL")
stopifnot(nrow(caddo) > 0)
caddo %>% select(end_year, district_name, n_students)
#>   end_year district_name n_students
#> 1     2019  Caddo Parish      37868
#> 2     2020  Caddo Parish      36470
#> 3     2021  Caddo Parish      35057
#> 4     2022  Caddo Parish      33934
#> 5     2023  Caddo Parish      33243
#> 6     2024  Caddo Parish      32614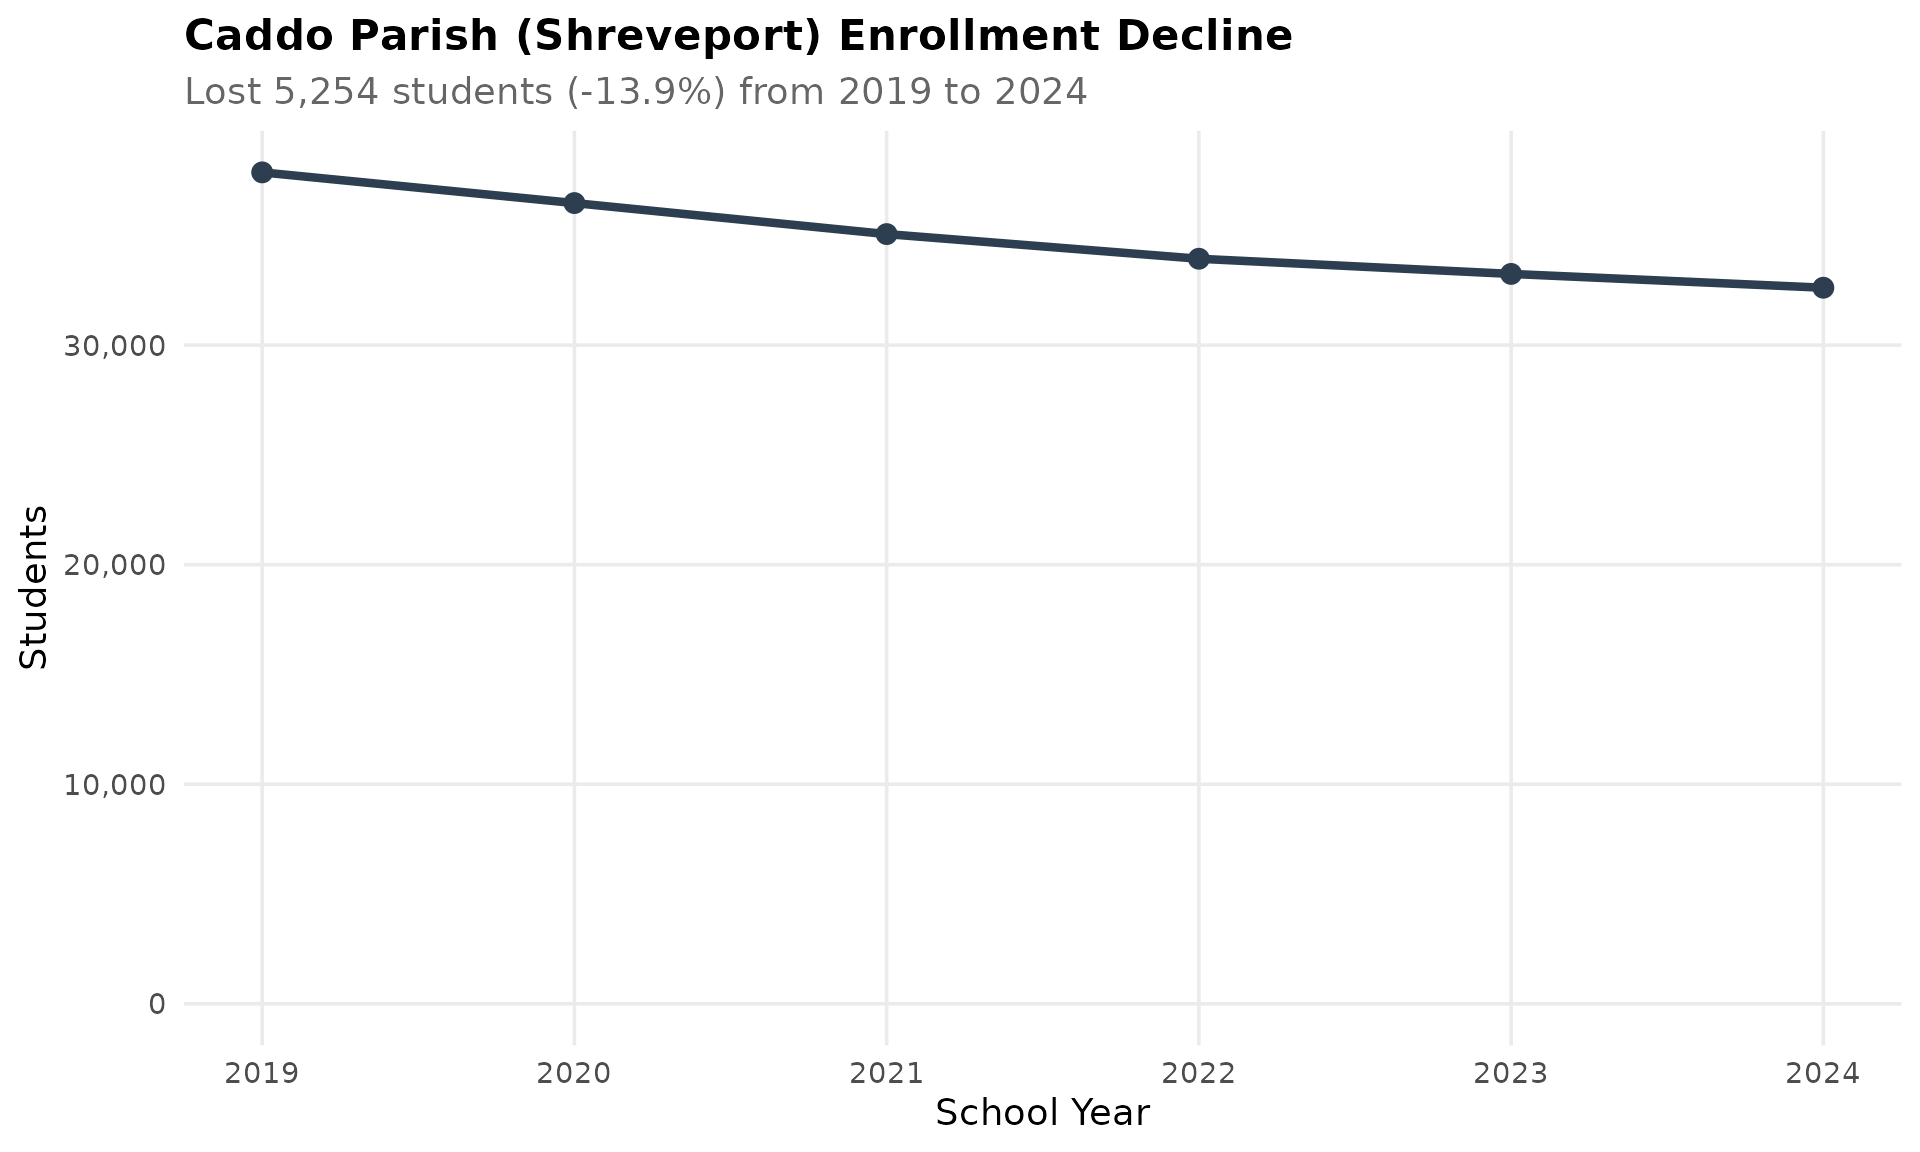
7. COVID wiped out 17% of Pre-K enrollment overnight
Pre-K dropped from 26,078 to 21,751 students between 2019 and 2020, then slowly recovered to 26,152 by 2024.
prek <- enr %>%
  filter(is_state, subgroup == "total_enrollment", grade_level == "PK")
stopifnot(nrow(prek) > 0)
prek %>% select(end_year, n_students)
#>   end_year n_students
#> 1     2019      26078
#> 2     2020      21751
#> 3     2021      24027
#> 4     2022      25969
#> 5     2023      26002
#> 6     2024      26152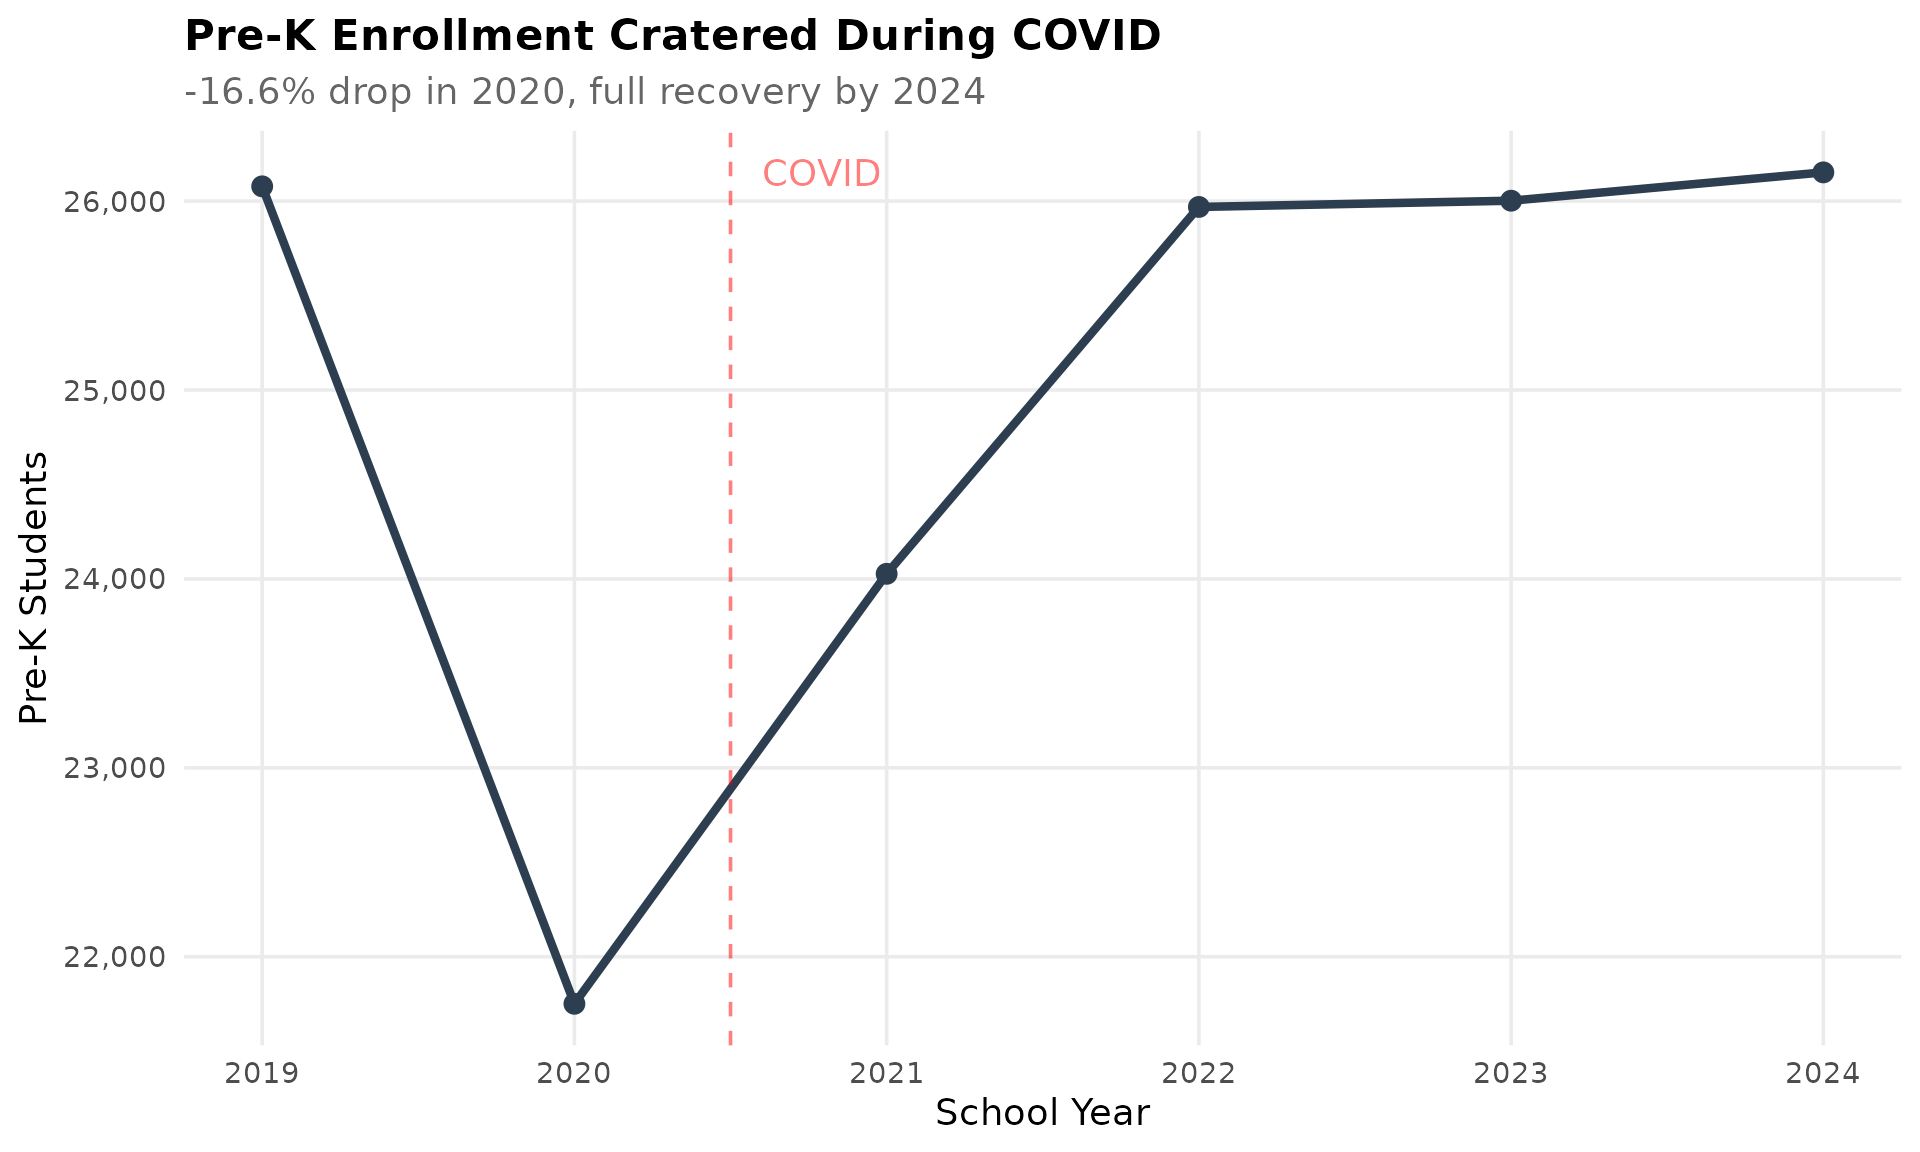
8. Kindergarten also took a COVID hit
Kindergarten enrollment fell 6.9% from 48,556 to 45,205 between 2019 and 2020, and still has not returned to pre-pandemic levels.
k_trend <- enr %>%
  filter(is_state, subgroup == "total_enrollment",
         grade_level %in% c("PK", "K", "01", "09")) %>%
  mutate(grade_label = case_when(
    grade_level == "PK" ~ "Pre-K",
    grade_level == "K" ~ "Kindergarten",
    grade_level == "01" ~ "Grade 1",
    grade_level == "09" ~ "Grade 9"
  ))
stopifnot(nrow(k_trend) > 0)
k_trend %>%
  filter(grade_level == "K") %>%
  select(end_year, grade_label, n_students)
#>   end_year  grade_label n_students
#> 1     2019 Kindergarten      48556
#> 2     2020 Kindergarten      45205
#> 3     2021 Kindergarten      46282
#> 4     2022 Kindergarten      50345
#> 5     2023 Kindergarten      48798
#> 6     2024 Kindergarten      48084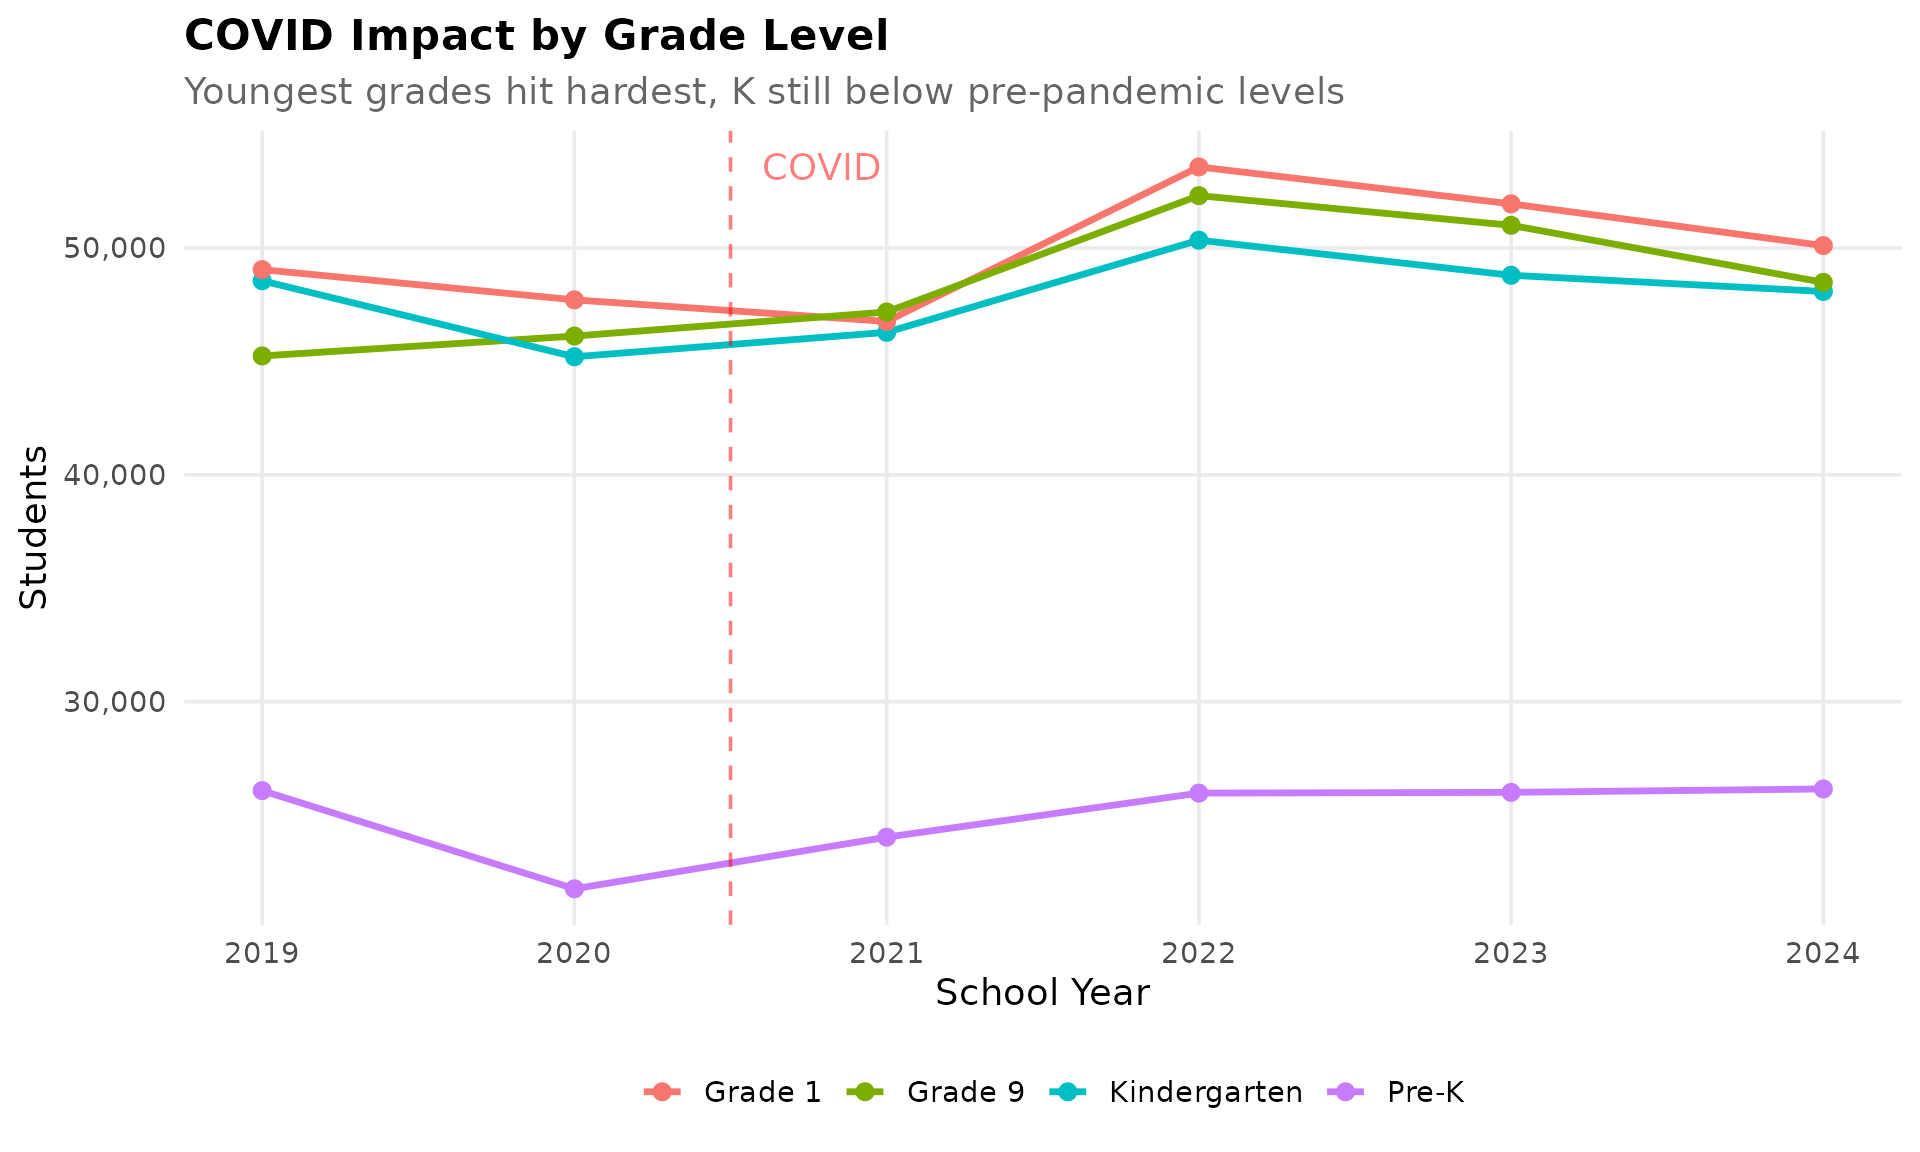
9. English learners grew from 3.9% to 5.3% of enrollment
LEP students increased from 24,908 to 35,868 between 2019 and 2024, a 44% jump tracking closely with Hispanic growth.
el <- enr %>%
  filter(is_state, subgroup == "lep", grade_level == "TOTAL") %>%
  left_join(state_totals, by = "end_year") %>%
  mutate(pct = n_students / total * 100)
stopifnot(nrow(el) > 0)
el %>% select(end_year, n_students, pct)
#>   end_year n_students      pct
#> 1     2019      24908  3.86780
#> 2     2020      23336  3.73660
#> 3     2021      25194  4.09127
#> 4     2022      31939  4.65867
#> 5     2023      33847  4.96870
#> 6     2024      35868  5.30062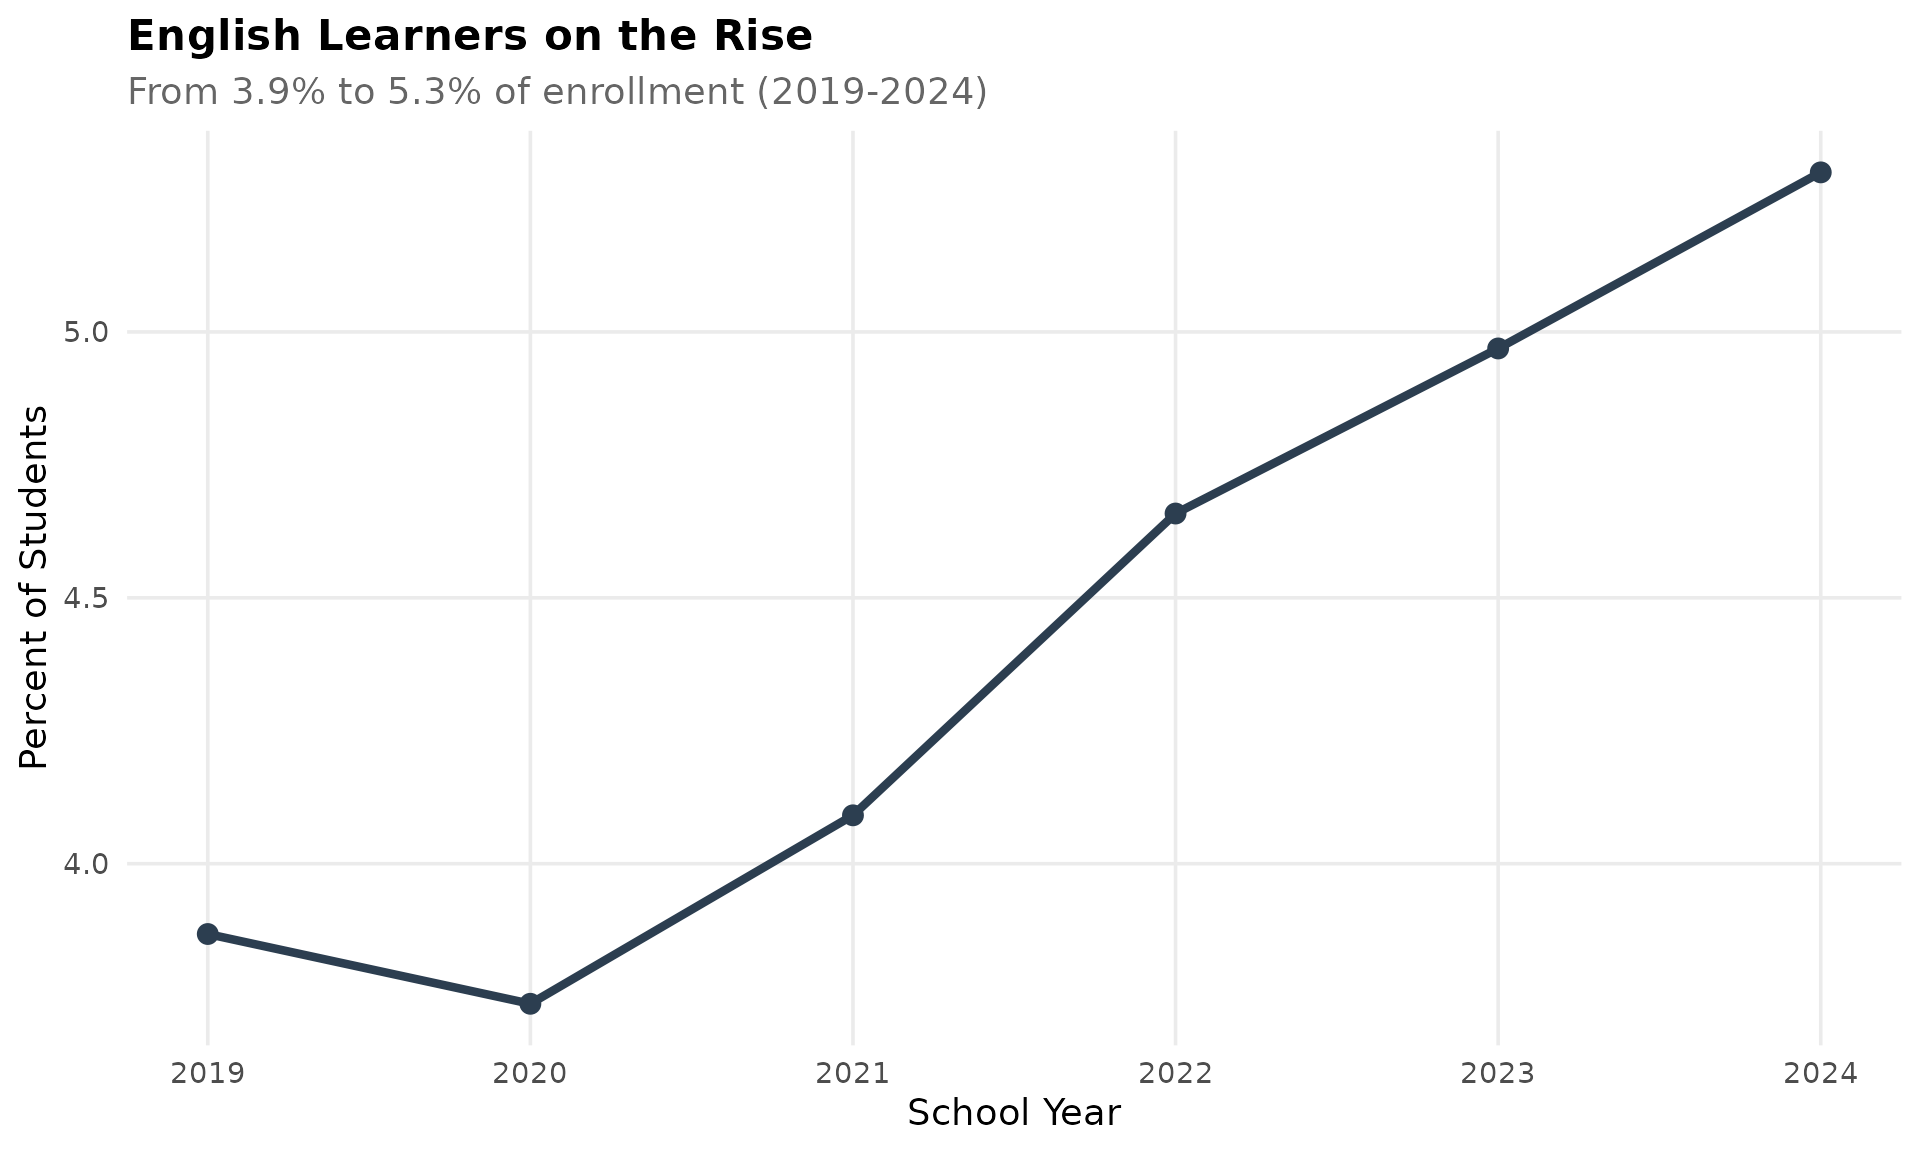
10. Seven in ten Louisiana students are economically disadvantaged
The statewide economic disadvantage rate has hovered around 70% since 2019, one of the highest rates in the nation.
econ_state <- enr %>%
  filter(is_state, subgroup == "econ_disadv", grade_level == "TOTAL") %>%
  left_join(state_totals, by = "end_year") %>%
  mutate(pct = n_students / total * 100)
stopifnot(nrow(econ_state) > 0)
econ_state %>% select(end_year, n_students, pct)
#>   end_year n_students      pct
#> 1     2019     436524  67.7976
#> 2     2020     453025  72.5388
#> 3     2021     429803  69.7954
#> 4     2022     494310  72.0907
#> 5     2023     494076  72.5338
#> 6     2024     474402  70.1035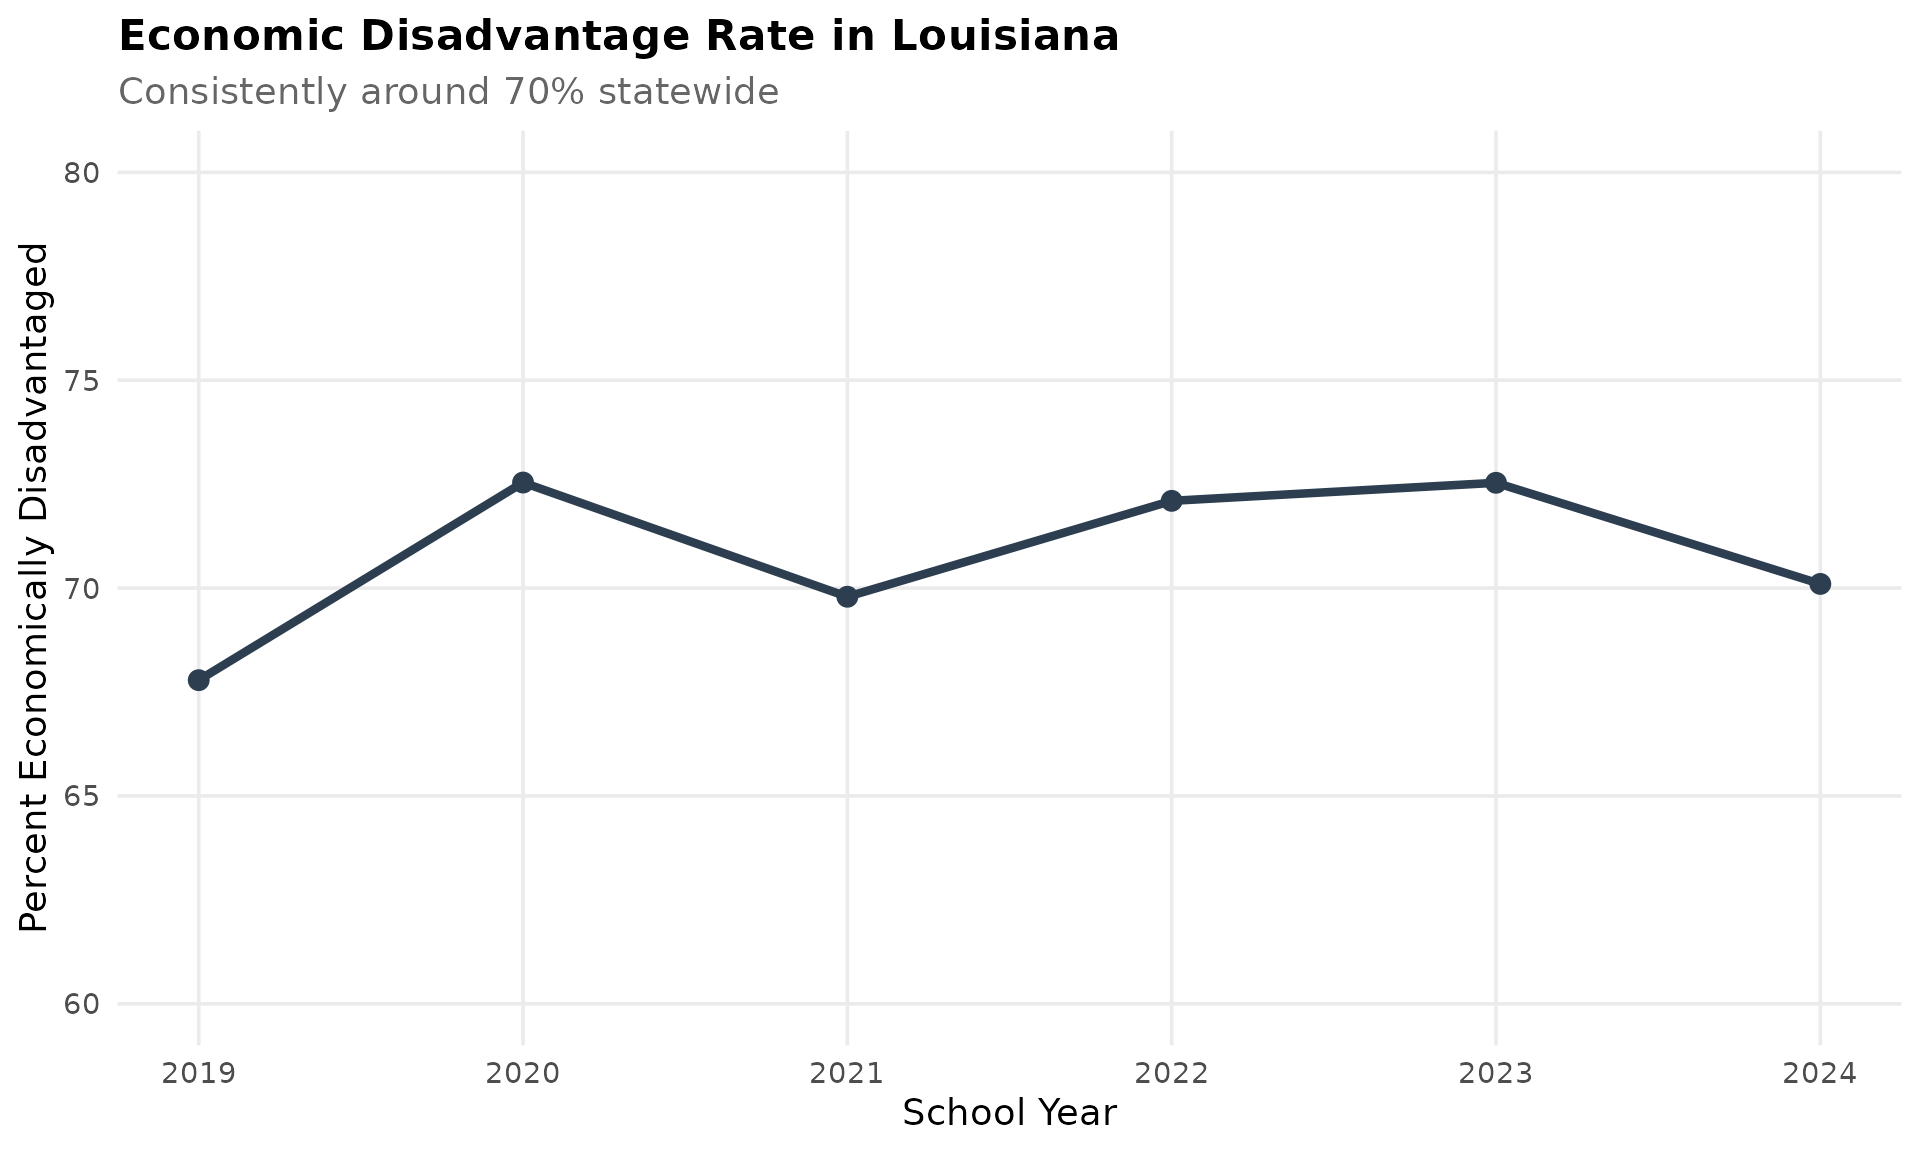
11. St. Helena Parish: 100% economically disadvantaged
St. Helena leads Louisiana with every single student classified as economically disadvantaged, followed by East Carroll (96.9%) and Tensas (95.8%).
district_totals <- enr_current %>%
  filter(is_district, subgroup == "total_enrollment", grade_level == "TOTAL") %>%
  select(district_name, total = n_students)

econ <- enr_current %>%
  filter(is_district, subgroup == "econ_disadv", grade_level == "TOTAL") %>%
  left_join(district_totals, by = "district_name") %>%
  mutate(pct = n_students / total * 100) %>%
  arrange(desc(pct)) %>%
  head(10) %>%
  mutate(district_label = reorder(district_name, pct))
stopifnot(nrow(econ) > 0)
econ %>% select(district_name, n_students, total, pct)
#>                       district_name n_students total       pct
#> 1                 St. Helena Parish       1002  1002 100.00000
#> 2           Special School District        291   299  97.32441
#> 3               East Carroll Parish        715   738  96.88076
#> 4                     Tensas Parish        298   311  95.81994
#> 5                    Madison Parish       1078  1134  95.06173
#> 6                    Thrive Academy        152   161  94.40994
#> 7  City of Bogalusa School District       1718  1822  94.29198
#> 8     City of Baker School District        927   999  92.79279
#> 9                  Red River Parish       1143  1251  91.36691
#> 10              Natchitoches Parish       4230  4829  87.59165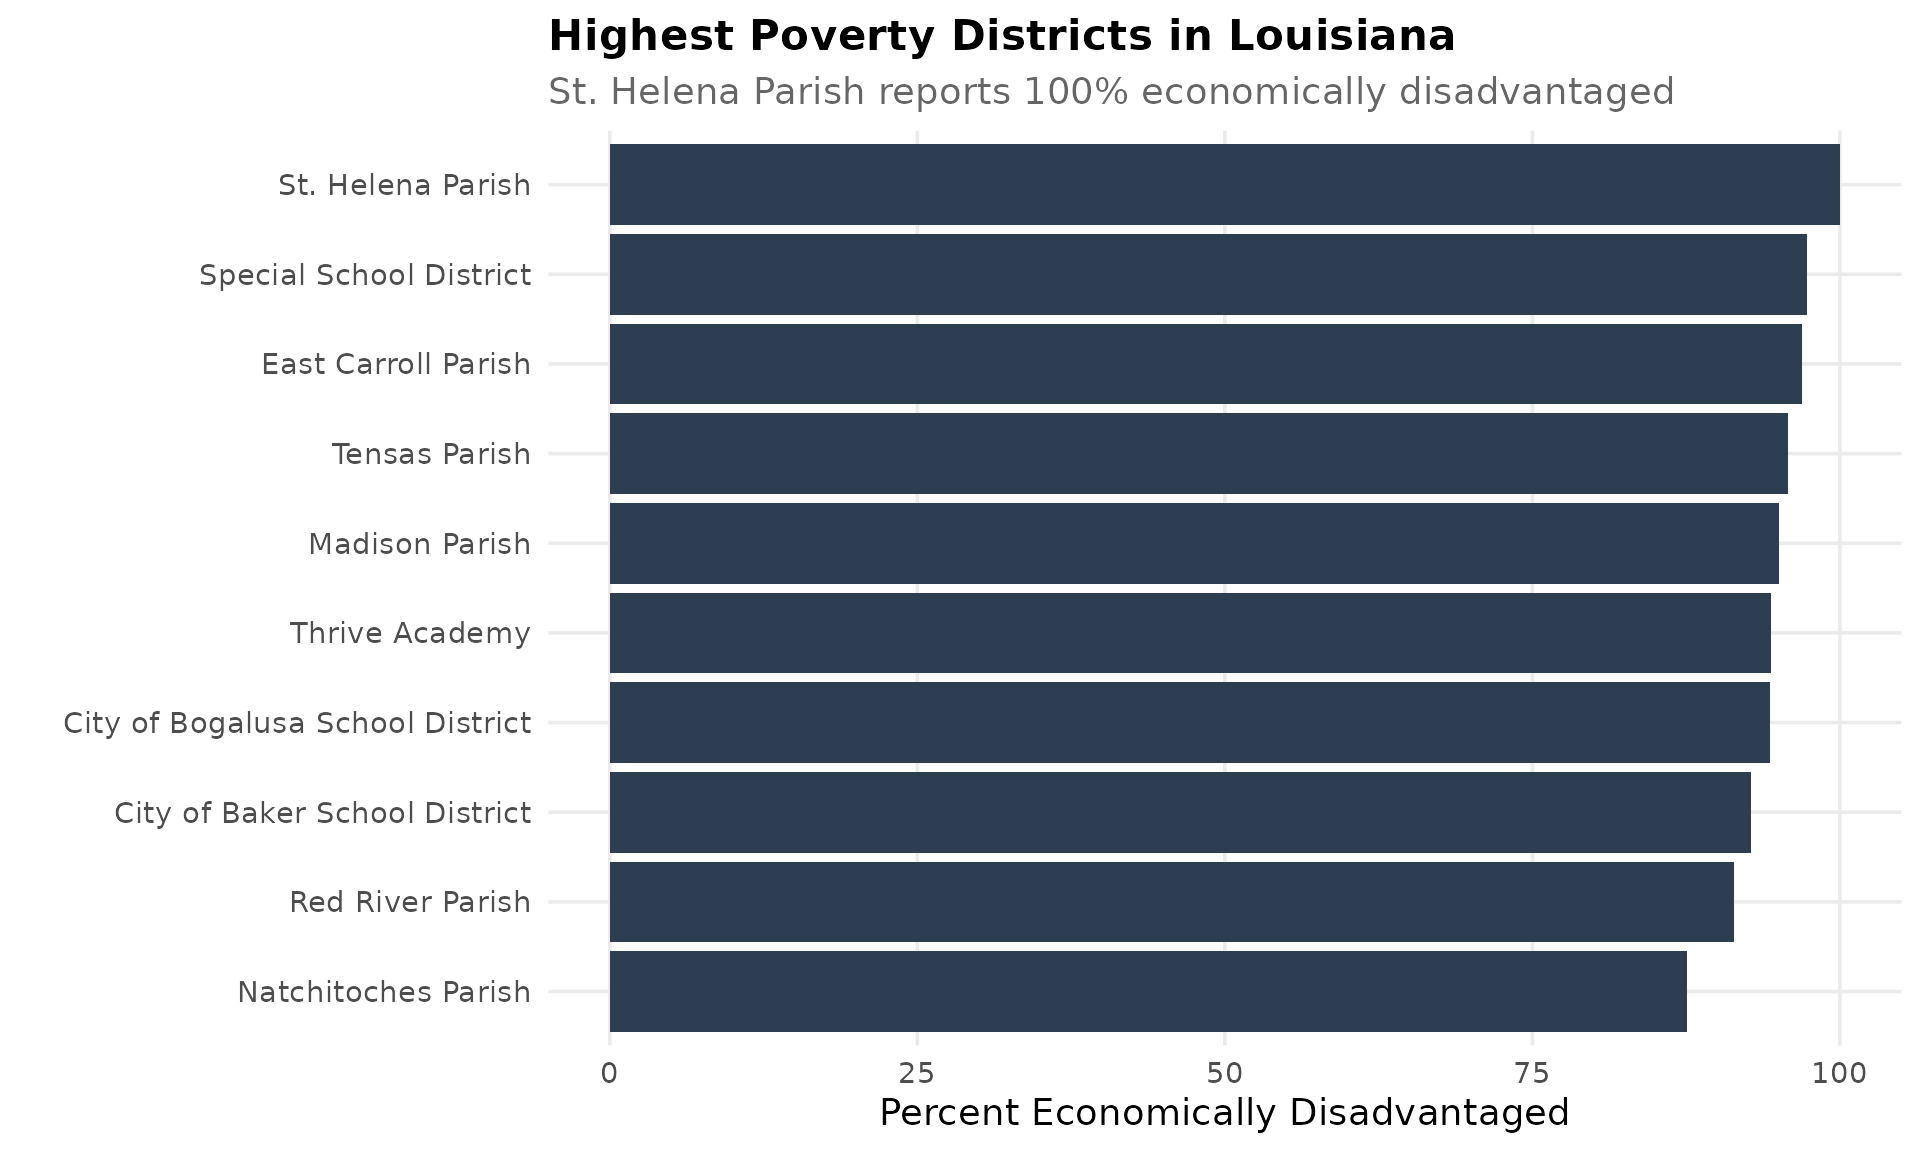
12. Delta parishes are emptying out
East Carroll (-20.8%), Tensas (-22.6%), and Madison (-4.4%) have shed students steadily since 2019.
delta_names <- c("Tensas Parish", "East Carroll Parish", "Madison Parish")
delta_trend <- enr %>%
  filter(is_district, district_name %in% delta_names,
         subgroup == "total_enrollment", grade_level == "TOTAL")
stopifnot(nrow(delta_trend) > 0)
delta_trend %>% select(end_year, district_name, n_students)
#>    end_year       district_name n_students
#> 1      2019 East Carroll Parish        932
#> 2      2020 East Carroll Parish        836
#> 3      2021 East Carroll Parish        778
#> 4      2022 East Carroll Parish        770
#> 5      2023 East Carroll Parish        751
#> 6      2024 East Carroll Parish        738
#> 7      2019      Madison Parish       1186
#> 8      2020      Madison Parish       1102
#> 9      2021      Madison Parish       1163
#> 10     2022      Madison Parish       1223
#> 11     2023      Madison Parish       1244
#> 12     2024      Madison Parish       1134
#> 13     2019       Tensas Parish        402
#> 14     2020       Tensas Parish        355
#> 15     2021       Tensas Parish        334
#> 16     2022       Tensas Parish        331
#> 17     2023       Tensas Parish        328
#> 18     2024       Tensas Parish        311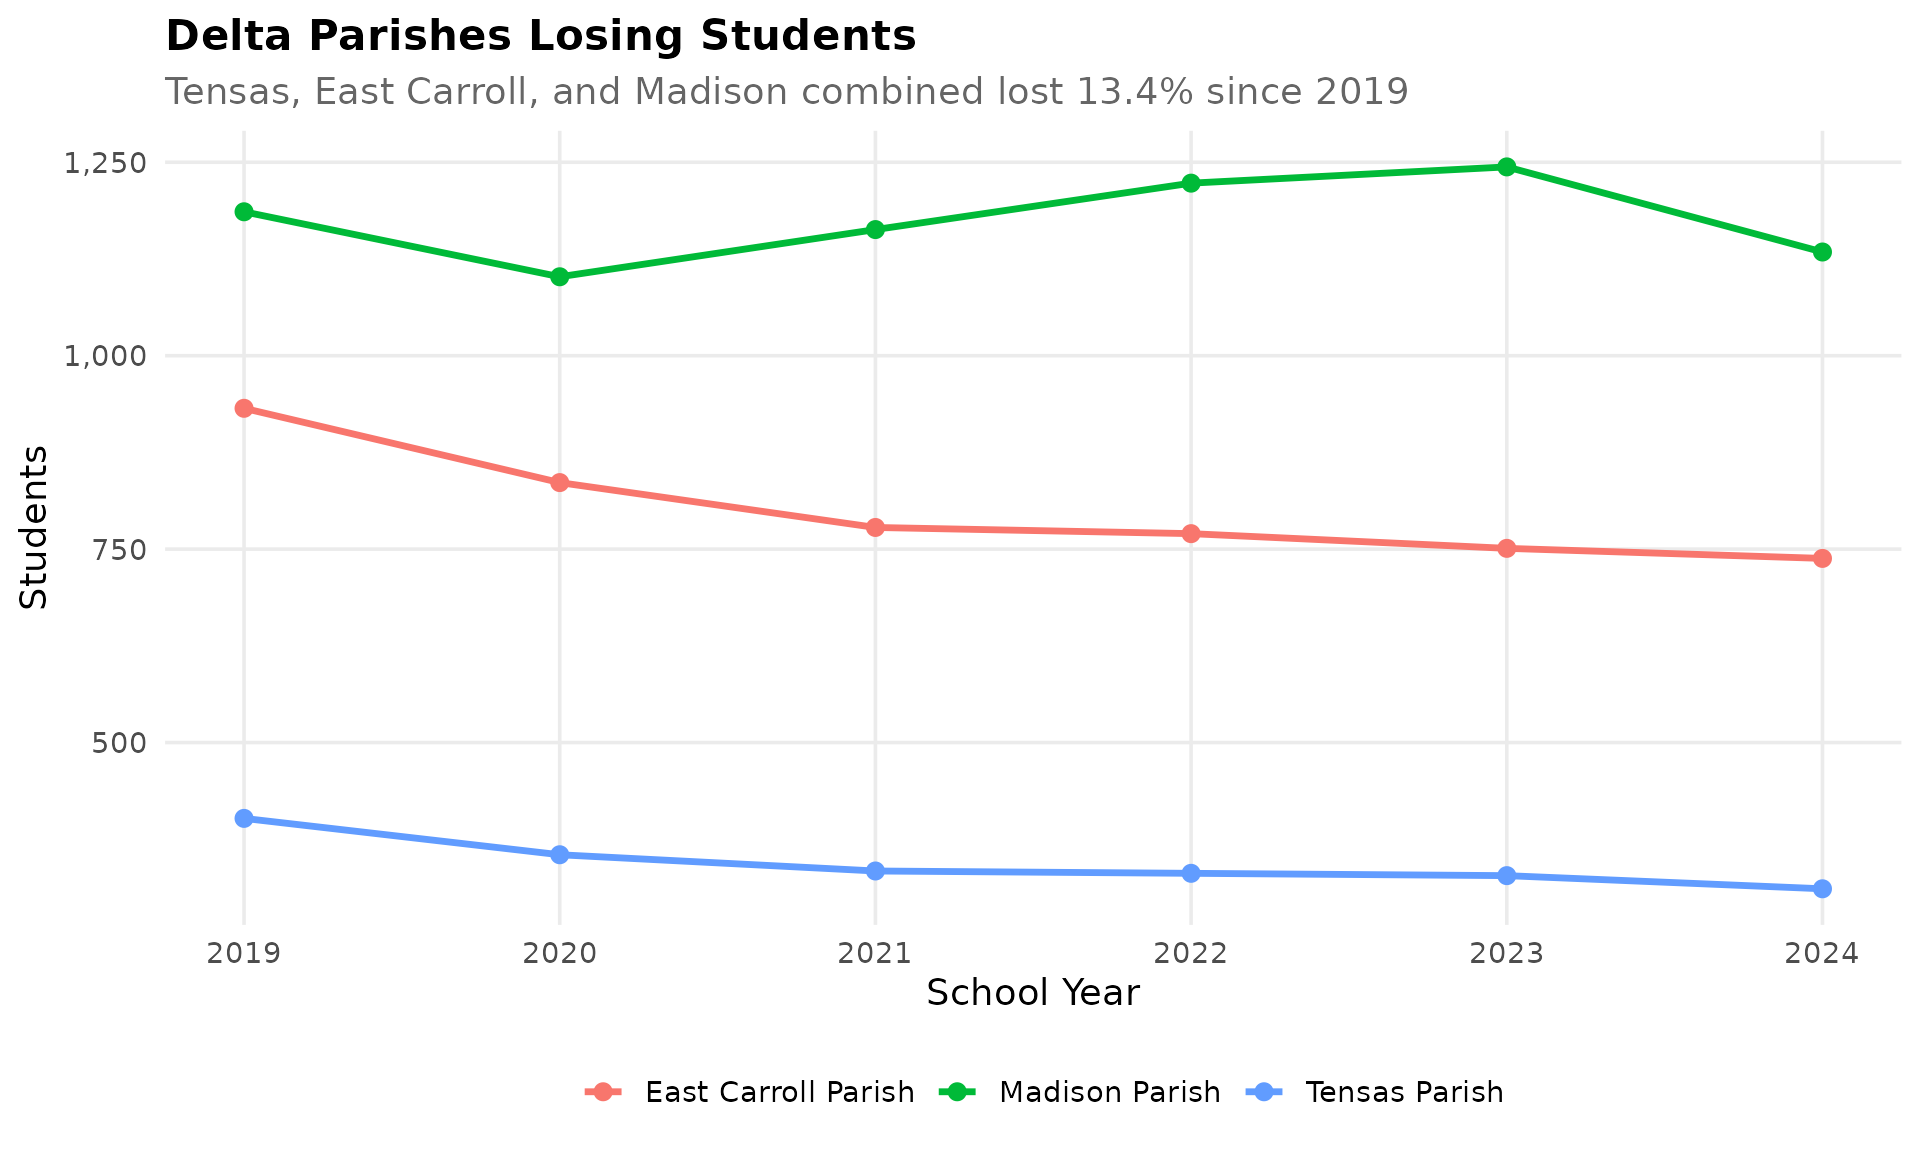
13. Jefferson Parish: the slow suburban slide
Louisiana’s largest district has been quietly losing students, dropping from 50,566 in 2019 to 47,702 in 2024.
jefferson <- enr %>%
  filter(is_district, district_name == "Jefferson Parish",
         subgroup == "total_enrollment", grade_level == "TOTAL")
stopifnot(nrow(jefferson) > 0)
jefferson %>% select(end_year, district_name, n_students)
#>   end_year    district_name n_students
#> 1     2019 Jefferson Parish      50566
#> 2     2020 Jefferson Parish      48974
#> 3     2021 Jefferson Parish      47720
#> 4     2022 Jefferson Parish      47429
#> 5     2023 Jefferson Parish      47712
#> 6     2024 Jefferson Parish      47702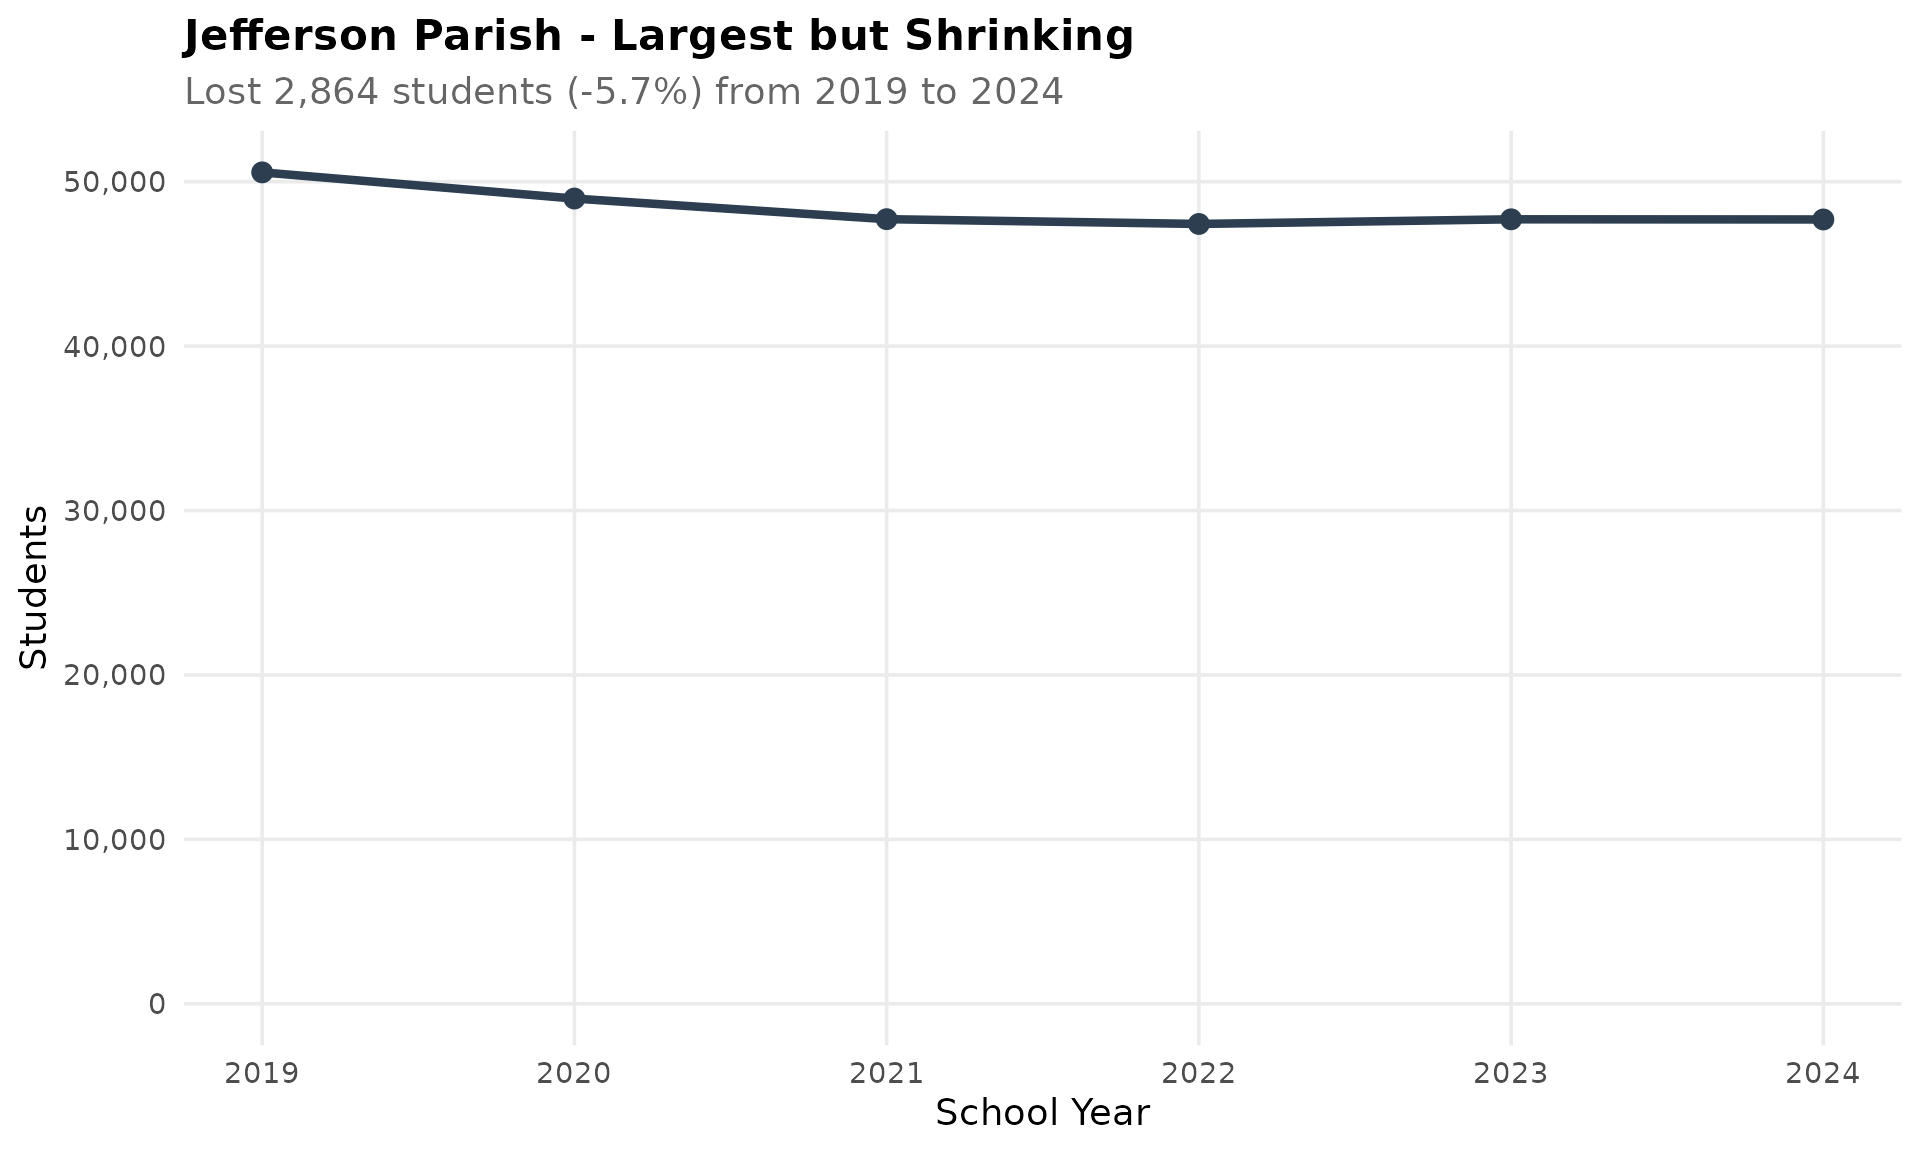
14. The suburban corridor holds steady
Ascension, Livingston, and St. Tammany parishes along the I-10/I-12 corridor are among the few growing districts.
i10 <- c("Livingston Parish", "Ascension Parish", "St. Tammany Parish")
i10_trend <- enr %>%
  filter(is_district, district_name %in% i10,
         subgroup == "total_enrollment", grade_level == "TOTAL")
stopifnot(nrow(i10_trend) > 0)
i10_trend %>%
  select(end_year, district_name, n_students) %>%
  tidyr::pivot_wider(names_from = district_name, values_from = n_students)
#>   end_year Ascension Parish Livingston Parish St. Tammany Parish
#> 1     2019            23409             26148              38774
#> 2     2020            23455             26044              37214
#> 3     2021            23843             26540              37374
#> 4     2022            24041             26954              37212
#> 5     2023            24138             27105              36806
#> 6     2024            24076             26852              36384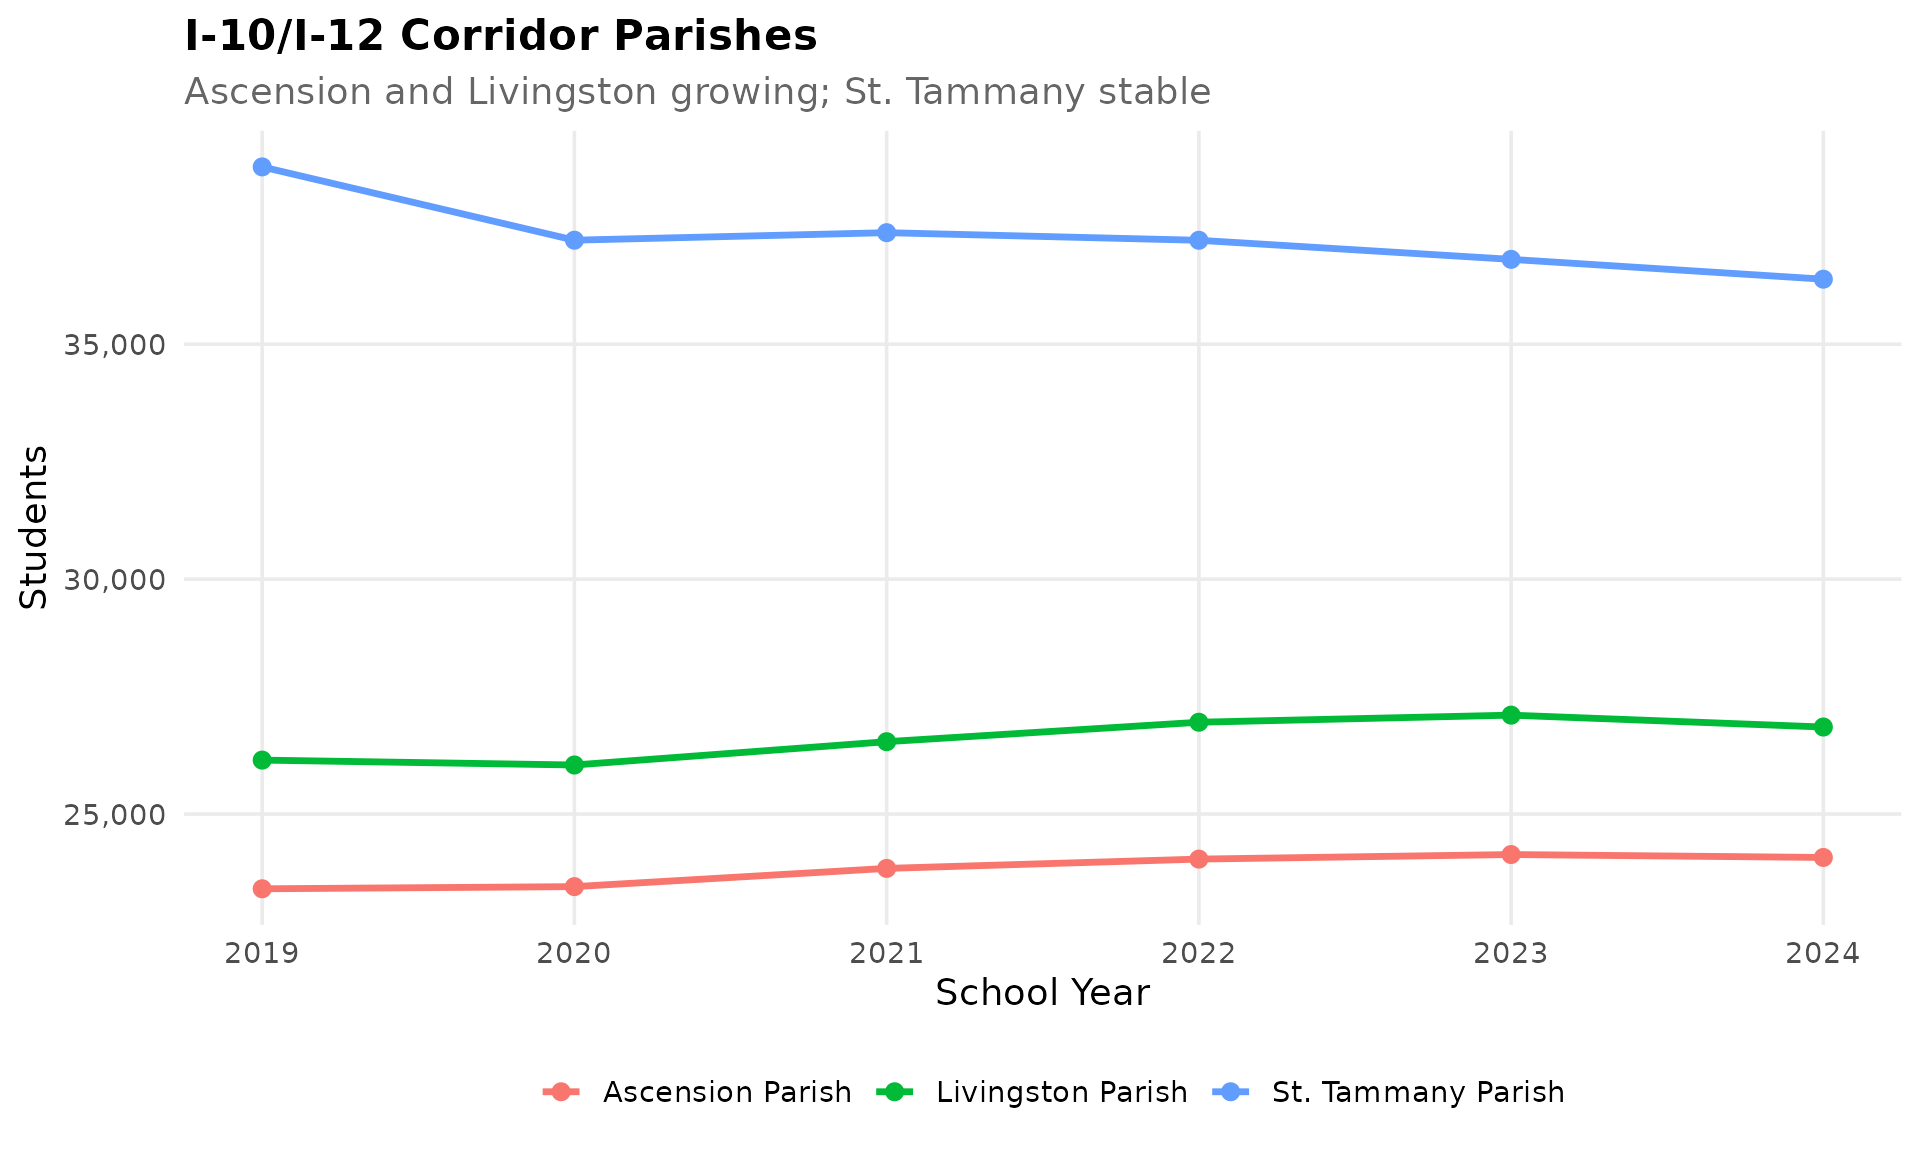
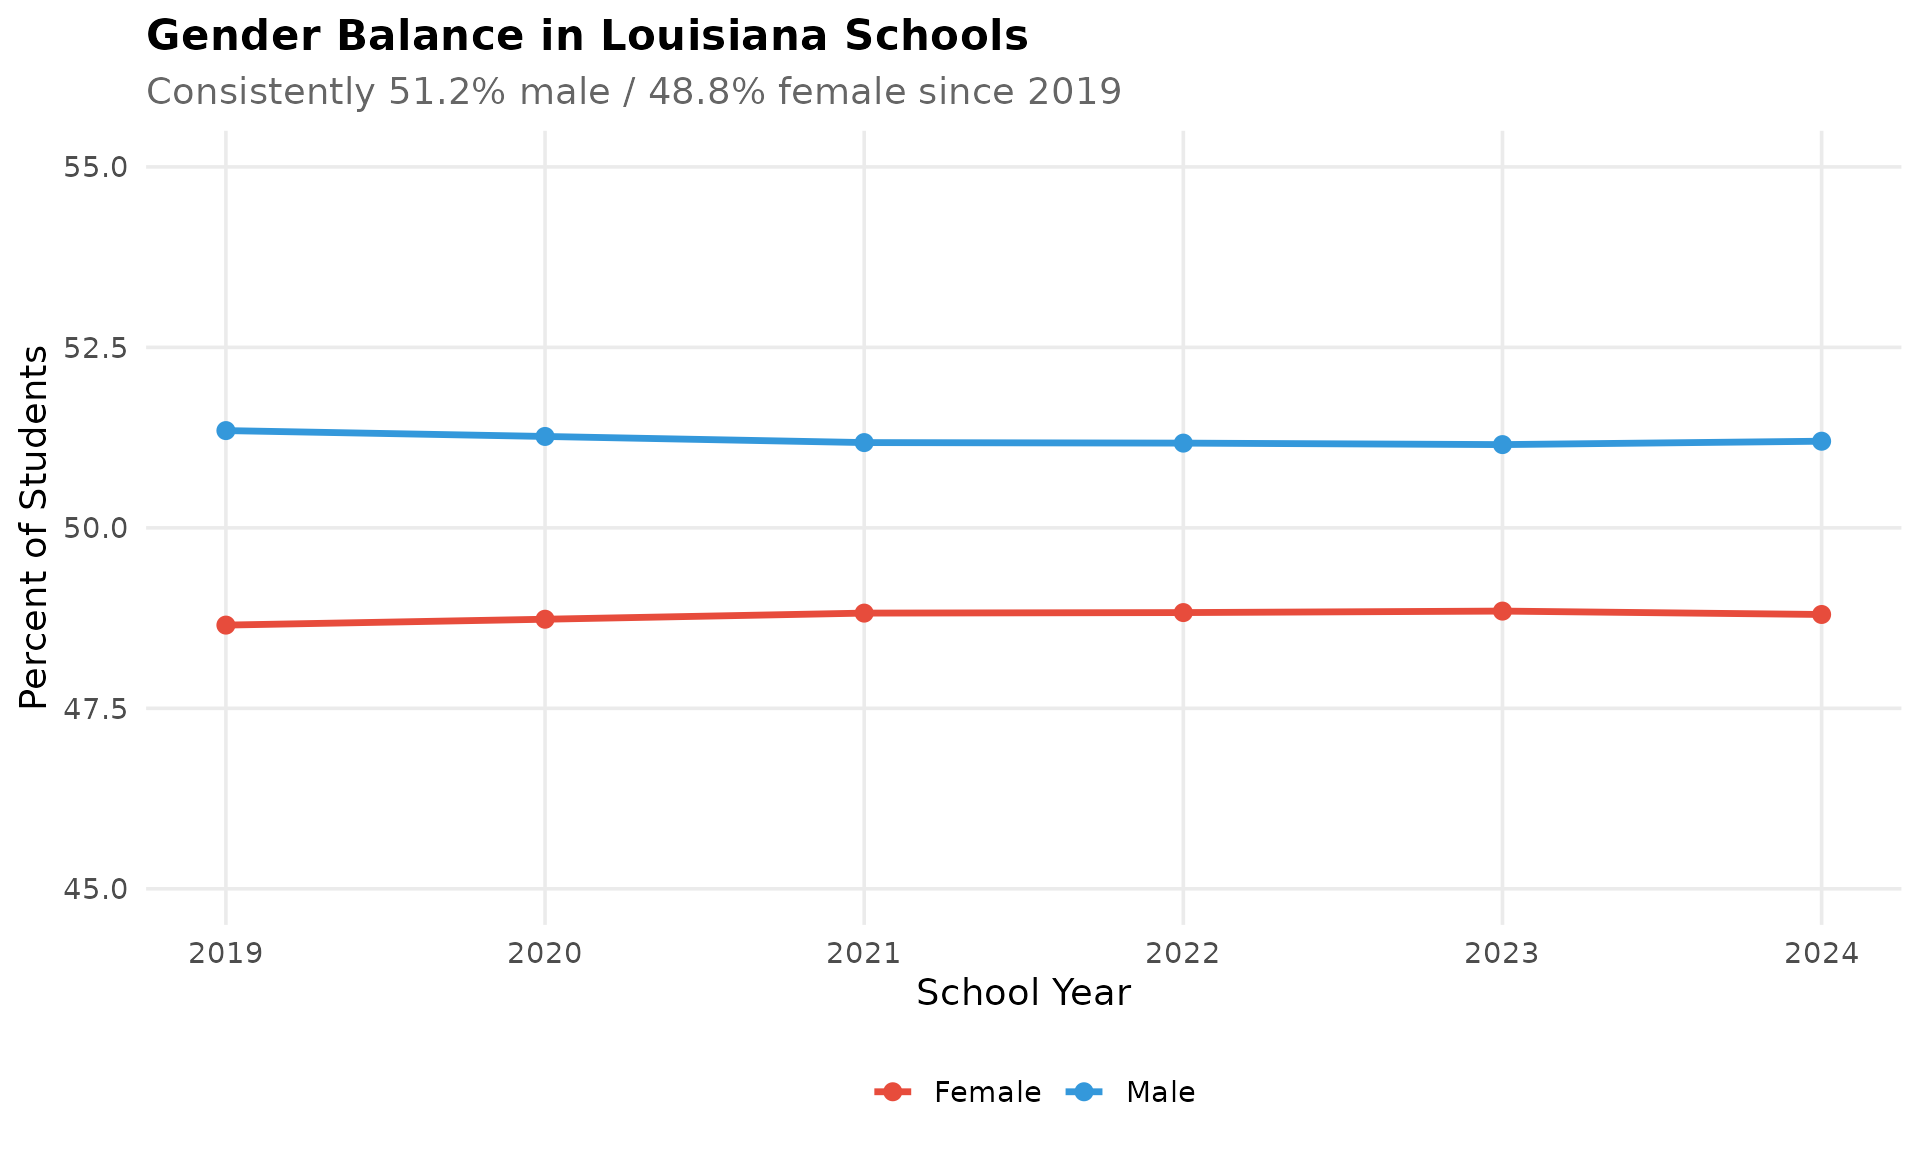
15. Gender balance is remarkably stable
Louisiana’s 51.2% male / 48.8% female split has barely budged across all six years of data.
gender <- enr %>%
  filter(is_state, grade_level == "TOTAL",
         subgroup %in% c("male", "female")) %>%
  left_join(state_totals, by = "end_year") %>%
  mutate(pct = n_students / total * 100)
stopifnot(nrow(gender) > 0)
gender %>%
  filter(end_year == 2024) %>%
  select(subgroup, n_students, pct)
#>   subgroup n_students      pct
#> 1   female     330254  48.8002
#> 2     male     346497  51.1998