Maryland’s 859,000 students span 24 Local School Systems – from tiny Kent County (1,591 students) to sprawling Montgomery County (155,000). Less than half are proficient in reading, and only 1 in 4 can do grade-level math. The data tells a story of stark geographic divides and post-pandemic challenges.
Part of the njschooldata family.
Full documentation – all 30 stories with interactive charts, getting-started guide, and complete function reference.
Highlights
1. Math proficiency plummets from 40% in grade 3 to 7% by grade 8
The math proficiency cliff is dramatic: 40% of 3rd graders are on grade level, but only 7% of 8th graders are. Students fall further behind each year.
prof <- get_statewide_proficiency(2024)

math_grades <- prof %>%
  filter(grepl("Math [0-9]", subject)) %>%
  mutate(grade = as.numeric(gsub("Math ", "", subject)))

stopifnot(nrow(math_grades) > 0)

math_grades %>%
  select(grade, subject, pct_proficient) %>%
  arrange(grade)
#> # A tibble: 6 x 3
#>   grade subject pct_proficient
#>   <dbl> <chr>            <dbl>
#> 1     3 Math 3            40.0
#> 2     4 Math 4            32.8
#> 3     5 Math 5            28.8
#> 4     6 Math 6            19.8
#> 5     7 Math 7            15.3
#> 6     8 Math 8             7.0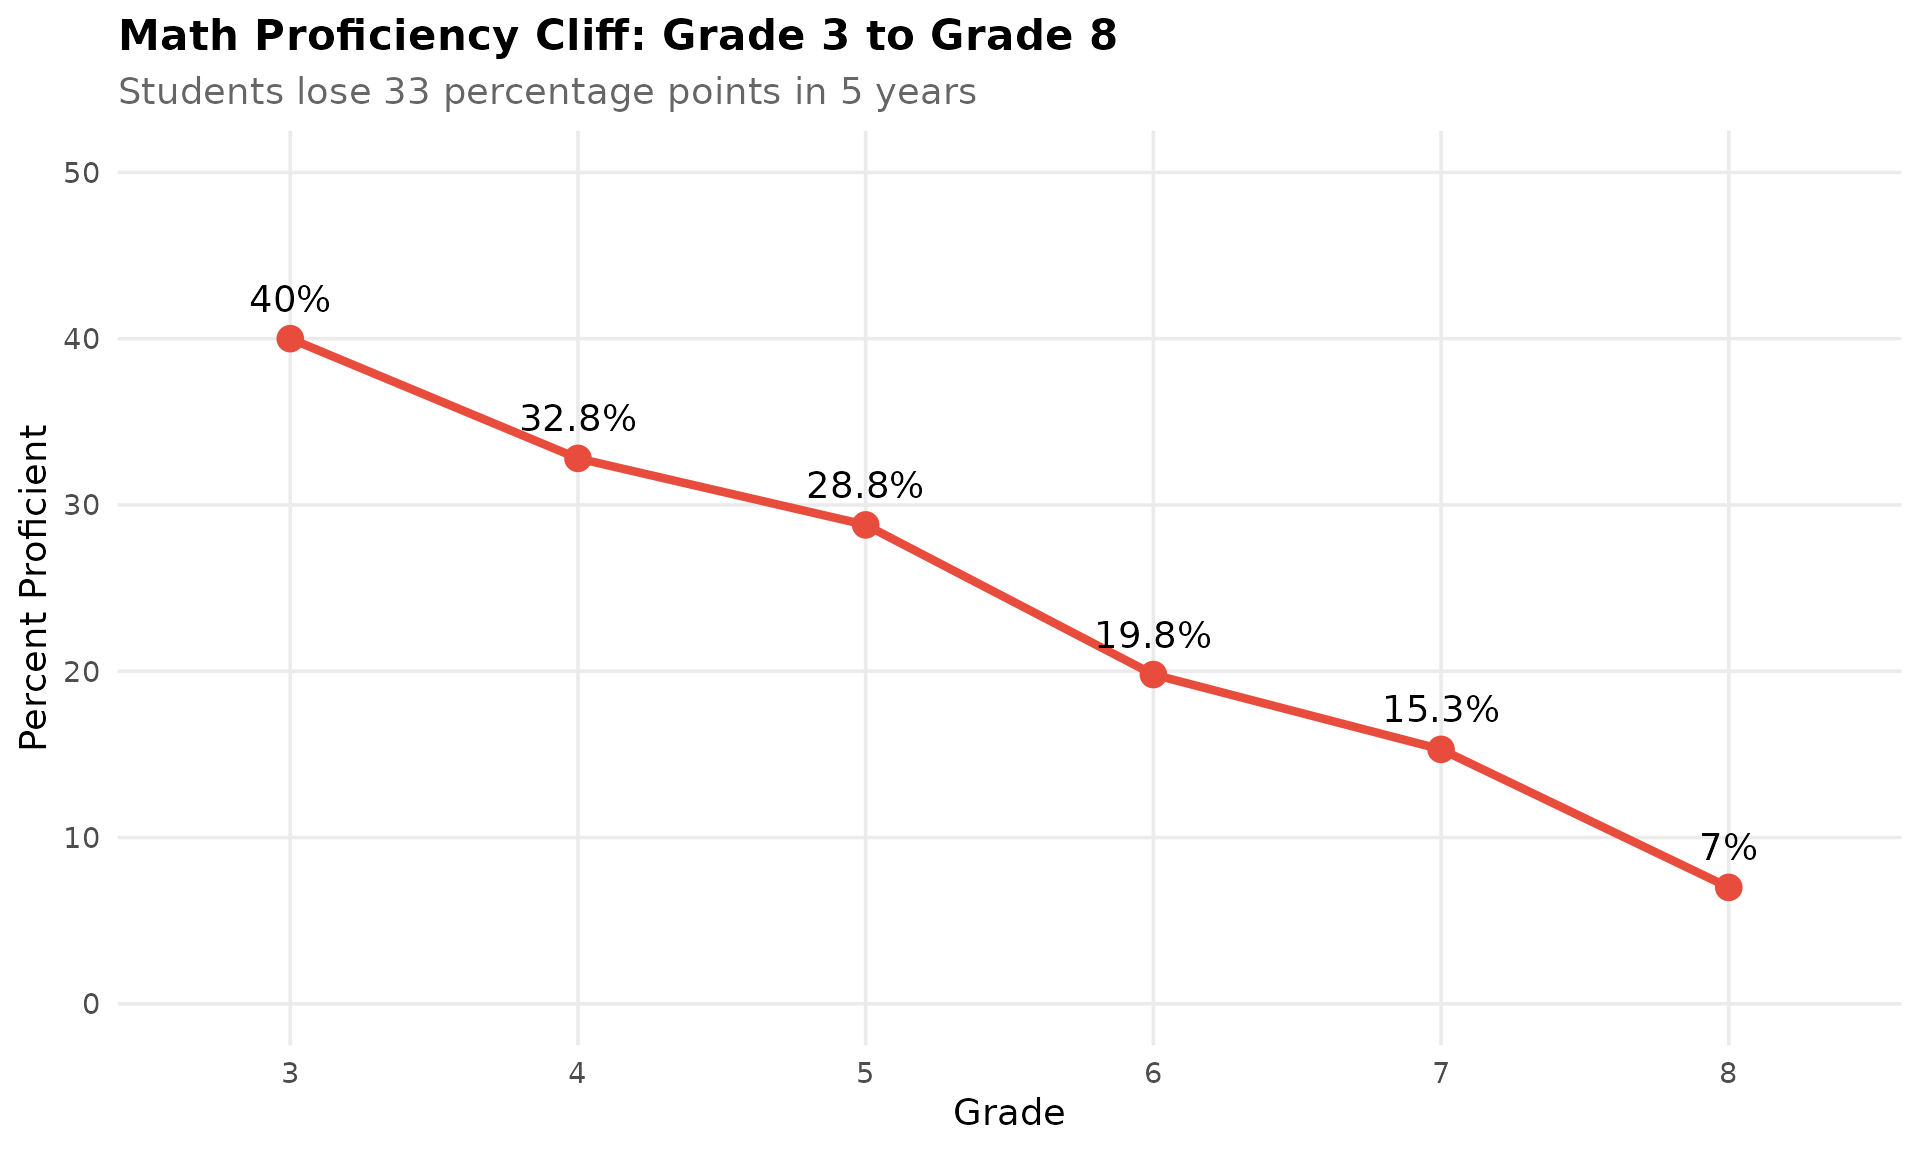
2. Kindergarten dropped 10% in 2020 and never fully recovered
COVID hit kindergarten hardest. Maryland lost 10.3% of kindergartners in the 2019-20 school year as families delayed enrollment. By 2024, kindergarten enrollment is still 8.5% below its 2019 peak.
enr <- fetch_enr_multi(2016:2024, use_cache = TRUE)
enr_current <- fetch_enr(2024, use_cache = TRUE)

# Helper function to get unique district totals
get_district_totals <- function(df) {
  df %>%
    filter(is_district, grade_level == "TOTAL", subgroup == "total_enrollment") %>%
    select(end_year, district_name, n_students) %>%
    distinct()
}

# Helper function to get unique state totals
get_state_totals <- function(df) {
  df %>%
    filter(is_state, grade_level == "TOTAL", subgroup == "total_enrollment") %>%
    select(end_year, n_students) %>%
    distinct()
}

k_trend <- enr %>%
  filter(is_state, subgroup == "total_enrollment",
         grade_level %in% c("K", "01", "06", "12")) %>%
  select(end_year, grade_level, n_students) %>%
  distinct()

stopifnot(nrow(k_trend) > 0)

k_trend %>%
  filter(grade_level == "K") %>%
  select(end_year, n_students) %>%
  mutate(change = n_students - lag(n_students),
         pct_change = round((n_students / lag(n_students) - 1) * 100, 1))
#> # A tibble: 9 x 4
#>   end_year n_students change pct_change
#>      <int>      <dbl>  <dbl>      <dbl>
#> 1     2016      64472     NA       NA
#> 2     2017      64045   -427       -0.7
#> 3     2018      63779   -266       -0.4
#> 4     2019      65087   1308        2.1
#> 5     2020      58391  -6696      -10.3
#> 6     2021      61671   3280        5.6
#> 7     2022      60986   -685       -1.1
#> 8     2023      60514   -472       -0.8
#> 9     2024      59562   -952       -1.6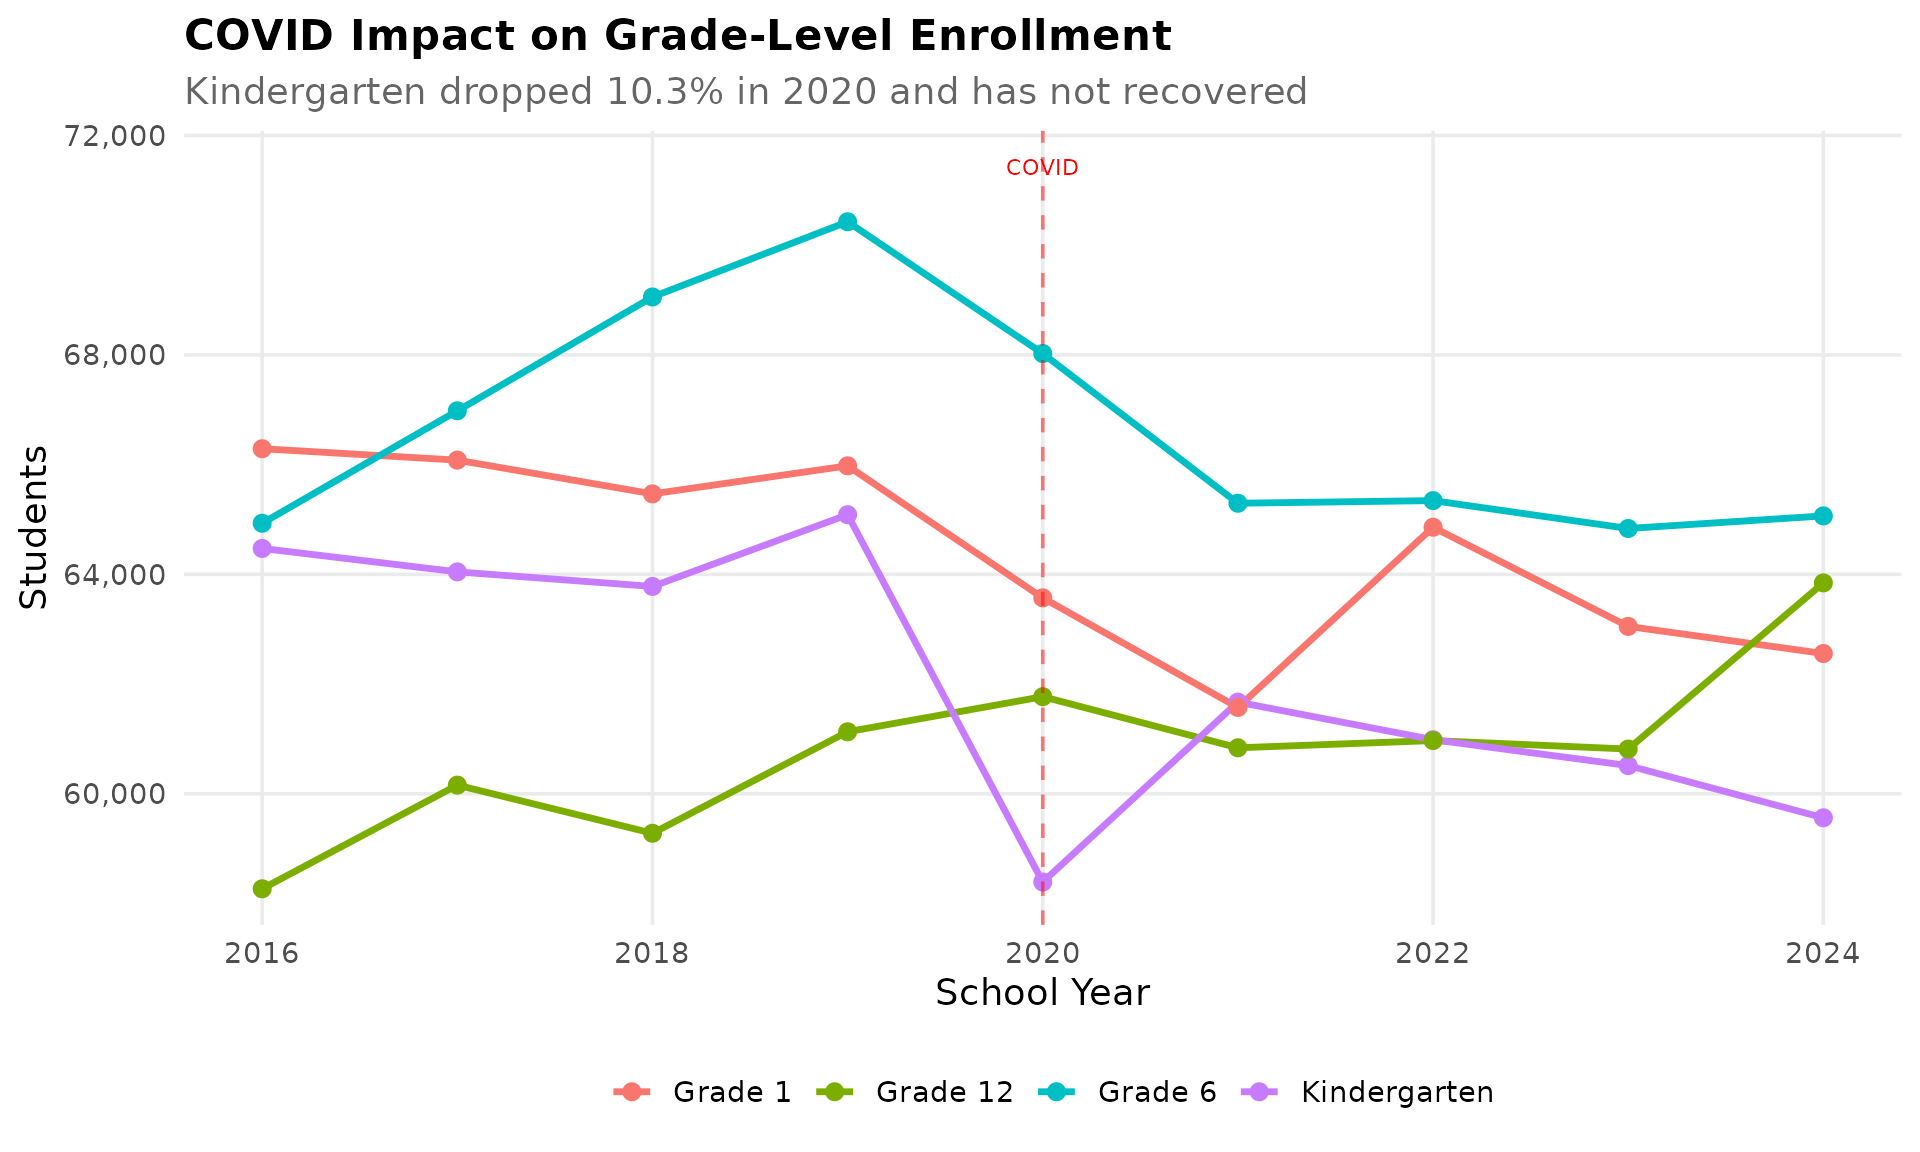
3. Frederick County grew 16% – fastest in the state
Frederick County has added over 6,300 students since 2016, a 15.8% increase. Located between the DC suburbs and western Maryland, Frederick attracts families seeking more affordable housing while maintaining access to the DC job market.
frederick <- get_district_totals(enr) %>%
  filter(district_name == "Frederick") %>%
  arrange(end_year)

stopifnot(nrow(frederick) > 0)

frederick %>%
  filter(end_year %in% c(min(end_year), max(end_year))) %>%
  mutate(change = n_students - lag(n_students),
         pct_change = round((n_students / lag(n_students) - 1) * 100, 1))
#> # A tibble: 2 x 5
#>   end_year district_name n_students change pct_change
#>      <int> <chr>              <dbl>  <dbl>      <dbl>
#> 1     2016 Frederick          40111     NA       NA
#> 2     2024 Frederick          46468   6357       15.8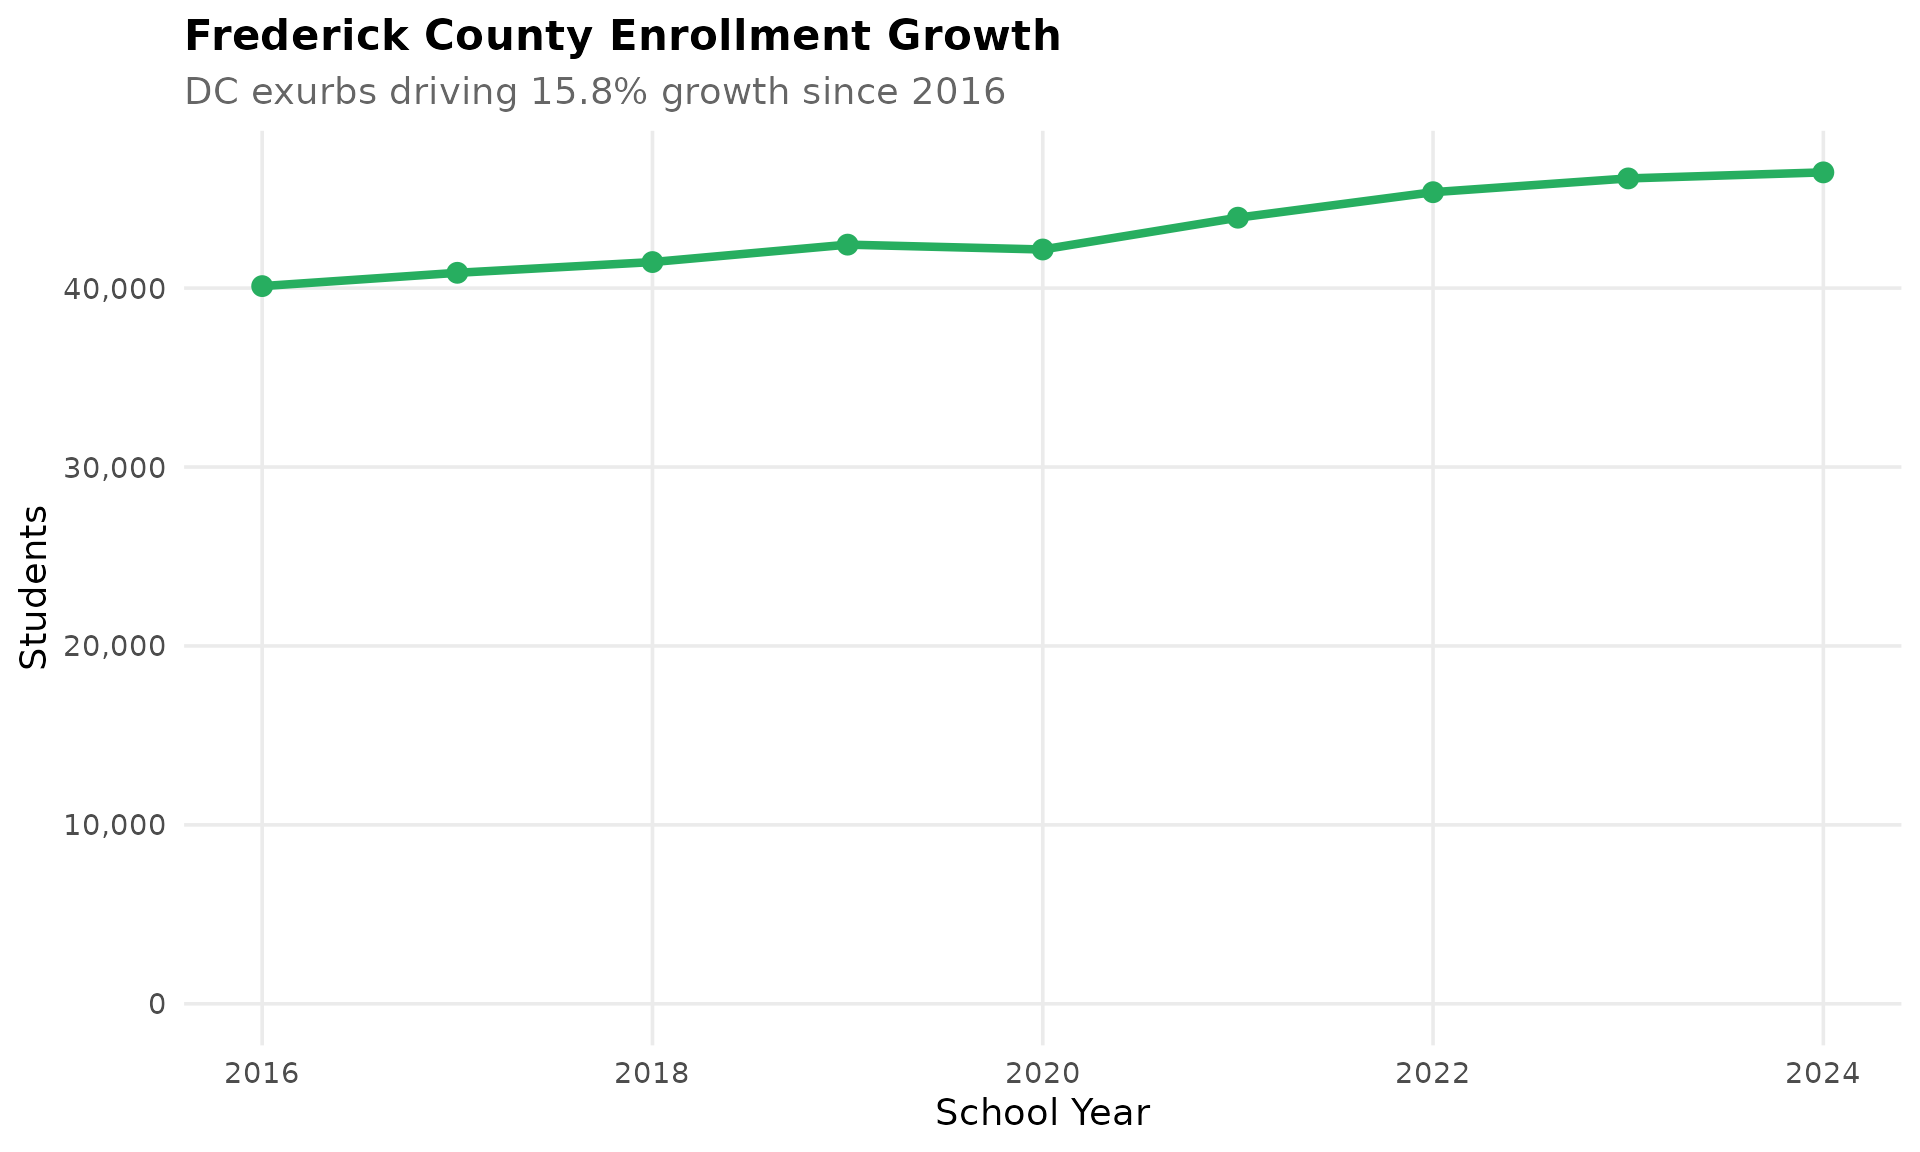
Data Taxonomy
| Category | Years | Function | Details |
|---|---|---|---|
| Enrollment | 2014-2024 |
fetch_enr() / fetch_enr_multi()
|
State, district. Grade-level (K-12) |
| Assessments | 2022-2024 |
fetch_assessment() / get_statewide_proficiency()
|
State, district, school. ELA, Math, Science. Participation + proficiency |
| Directory | current | fetch_directory() |
Charter schools |
| Graduation | – | – | Not yet available |
| Per-Pupil Spending | – | – | Not yet available |
| Accountability | – | – | Not yet available |
| Chronic Absence | – | – | Not yet available |
| EL Progress | – | – | Not yet available |
| Special Ed | – | – | Not yet available |
See the full data category taxonomy
Quick Start
R
# install.packages("remotes")
remotes::install_github("almartin82/mdschooldata")

library(mdschooldata)
library(dplyr)

# Fetch one year
enr_2024 <- fetch_enr(2024)

# Fetch multiple years
enr_multi <- fetch_enr_multi(2020:2024)

# State totals
enr_2024 %>%
  filter(is_state, subgroup == "total_enrollment", grade_level == "TOTAL")

# Compare largest districts
enr_2024 %>%
  filter(is_district, subgroup == "total_enrollment", grade_level == "TOTAL") %>%
  arrange(desc(n_students)) %>%
  head(10)

# Assessment data - statewide proficiency
prof_2024 <- get_statewide_proficiency(2024)

# School-level assessment data
assess_2024 <- fetch_assessment(2024)
Python
import pymdschooldata as md

# Fetch one year
enr_2024 = md.fetch_enr(2024)

# Fetch multiple years
enr_multi = md.fetch_enr_multi([2020, 2021, 2022, 2023, 2024])

# State totals
state_total = enr_2024[
    (enr_2024['is_state'] == True) &
    (enr_2024['subgroup'] == 'total_enrollment') &
    (enr_2024['grade_level'] == 'TOTAL')
]

# Compare largest districts
districts = enr_2024[
    (enr_2024['is_district'] == True) &
    (enr_2024['subgroup'] == 'total_enrollment') &
    (enr_2024['grade_level'] == 'TOTAL')
].sort_values('n_students', ascending=False).head(10)

# Assessment data - statewide proficiency
prof_2024 = md.get_statewide_proficiency(2024)

# School-level assessment data
assess_2024 = md.fetch_assessment(2024)
Explore More
Full analysis with 30 stories across two vignettes: - Enrollment trends – 15 stories - Assessment analysis – 15 stories - Function reference
Data Notes
Data Source
Data is sourced from the Maryland State Department of Education (MSDE): - Maryland Report Card: https://reportcard.msde.maryland.gov - Maryland Department of Planning: https://planning.maryland.gov/MSDC/Pages/s3_projection.aspx - MSDE Publications: https://marylandpublicschools.org/about/Pages/DCAA/SSP/
Available Years
Enrollment: 2014-2024 – Grade-level enrollment from MD Department of Planning for state and 24 jurisdictions.
Assessment (MCAP): 2022-2024 – Statewide proficiency summaries and school-level participation data.
Suppression Rules
MSDE may suppress data for privacy protection when counts are small. Specific suppression thresholds vary by report.
What’s Included
Enrollment: - Levels: State, District (24 Local School Systems) - Grade levels: K through 12 - Years: 2014-2024
Note: Demographic breakdowns (race/ethnicity, gender) are not available via automated download due to MSDE PDF parsing limitations. For demographics, use the Maryland Report Card interactive site.
Assessment: - Subjects: ELA (grades 3-8, 10), Math (grades 3-8, Algebra I/II, Geometry), Science (grades 5, 8) - Levels: State, District, School - Student Groups: All Students, by demographics, special populations
Deeper Dive
4. Montgomery County is Maryland’s largest district with 155,000 students
Montgomery County Public Schools enrolls more students than entire states like Wyoming or Vermont. It is one of the top 20 largest school districts in the nation.
top_districts <- get_district_totals(enr_current) %>%
  arrange(desc(n_students)) %>%
  head(5) %>%
  mutate(district_label = reorder(district_name, n_students))

stopifnot(nrow(top_districts) > 0)

top_districts %>%
  select(district_name, n_students)
#> # A tibble: 5 x 2
#>   district_name   n_students
#>   <chr>                <dbl>
#> 1 Montgomery          154791
#> 2 Prince George's     127330
#> 3 Baltimore County    105944
#> 4 Anne Arundel         82353
#> 5 Baltimore City       72995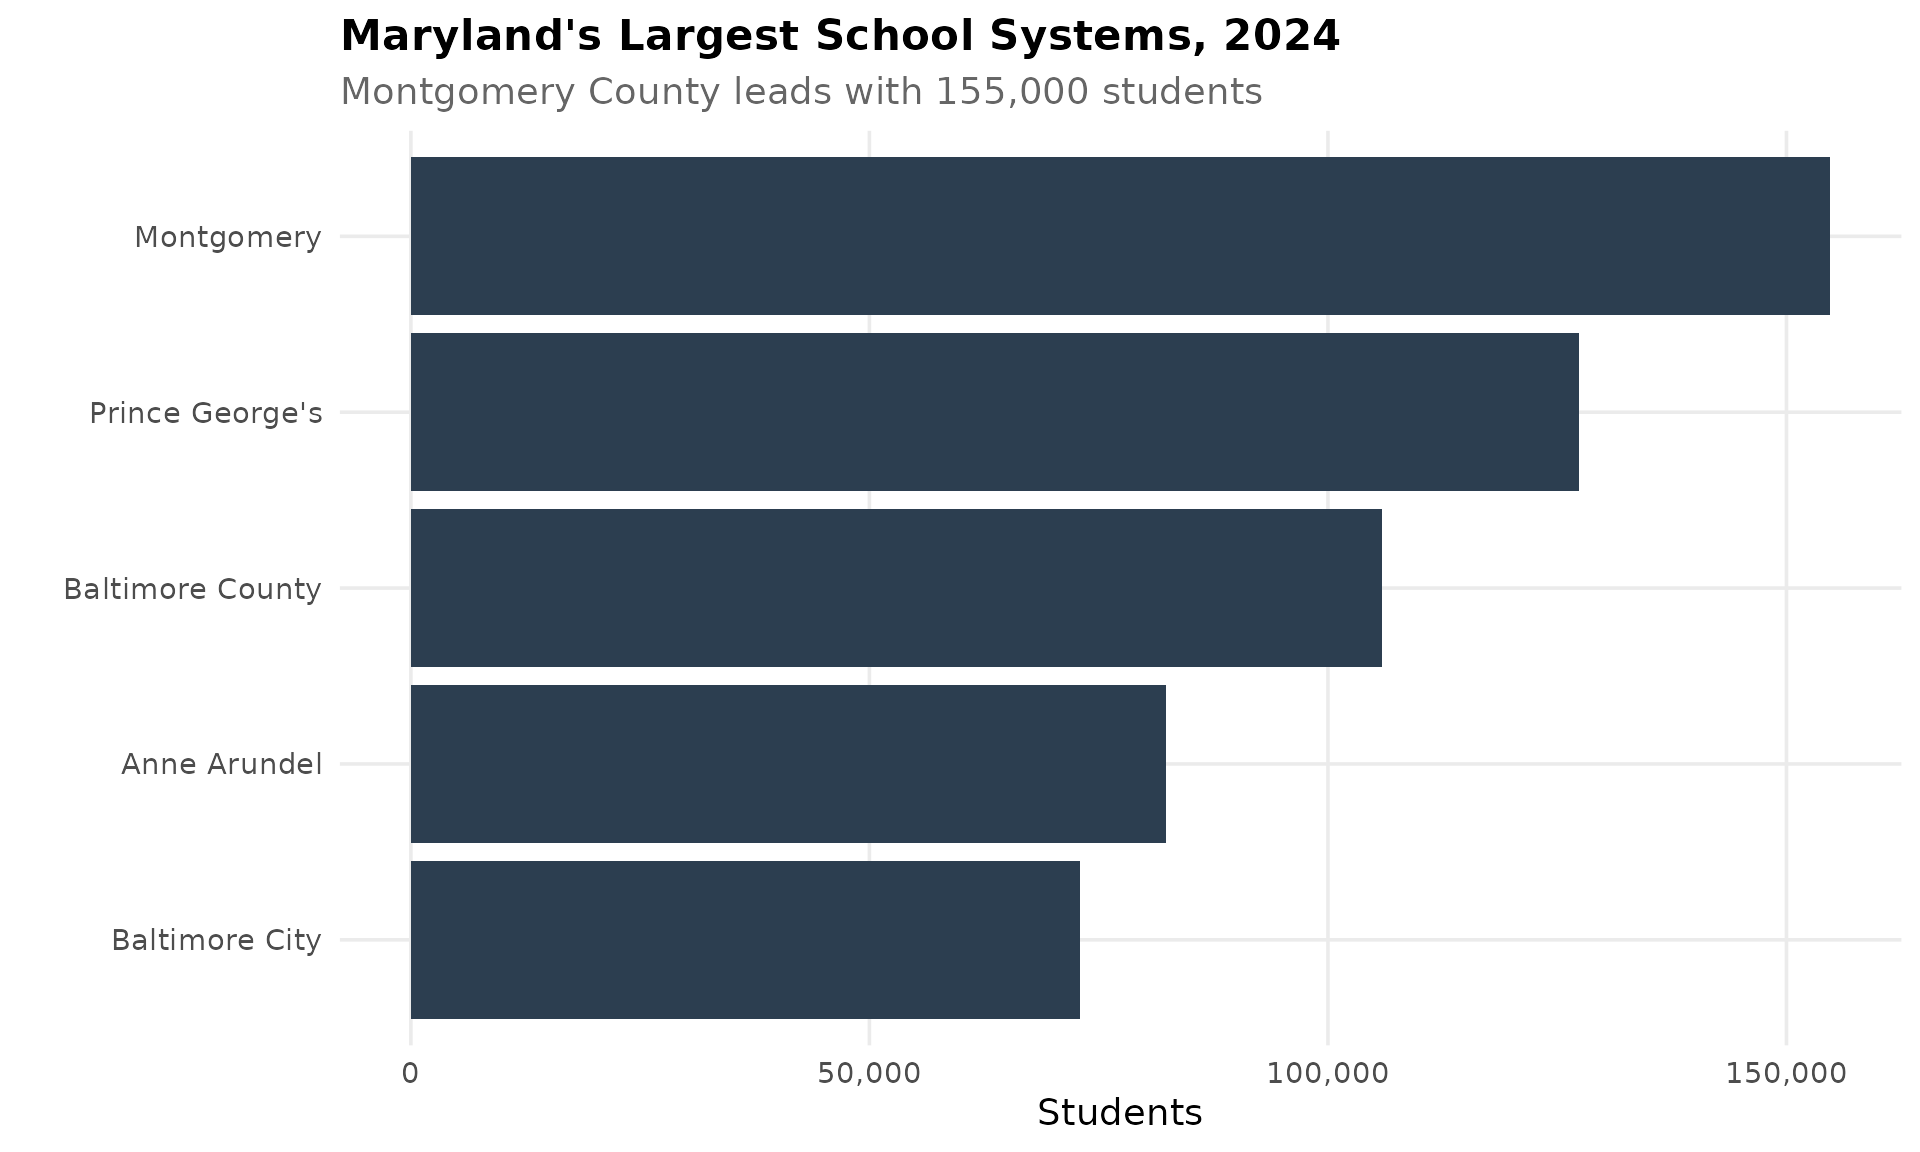
5. Baltimore City lost nearly 5,000 students since 2016
Baltimore City enrollment has declined 6.3% from 77,866 in 2016 to 72,995 in 2024. The decline has been steady, with a slight uptick in 2024. Population loss and suburban migration are driving forces.
baltimore <- get_district_totals(enr) %>%
  filter(district_name == "Baltimore City") %>%
  arrange(end_year)

stopifnot(nrow(baltimore) > 0)

baltimore %>%
  filter(end_year %in% c(min(end_year), max(end_year))) %>%
  mutate(change = n_students - lag(n_students),
         pct_change = round((n_students / lag(n_students) - 1) * 100, 1))
#> # A tibble: 2 x 5
#>   end_year district_name  n_students change pct_change
#>      <int> <chr>               <dbl>  <dbl>      <dbl>
#> 1     2016 Baltimore City      77866     NA       NA
#> 2     2024 Baltimore City      72995  -4871       -6.3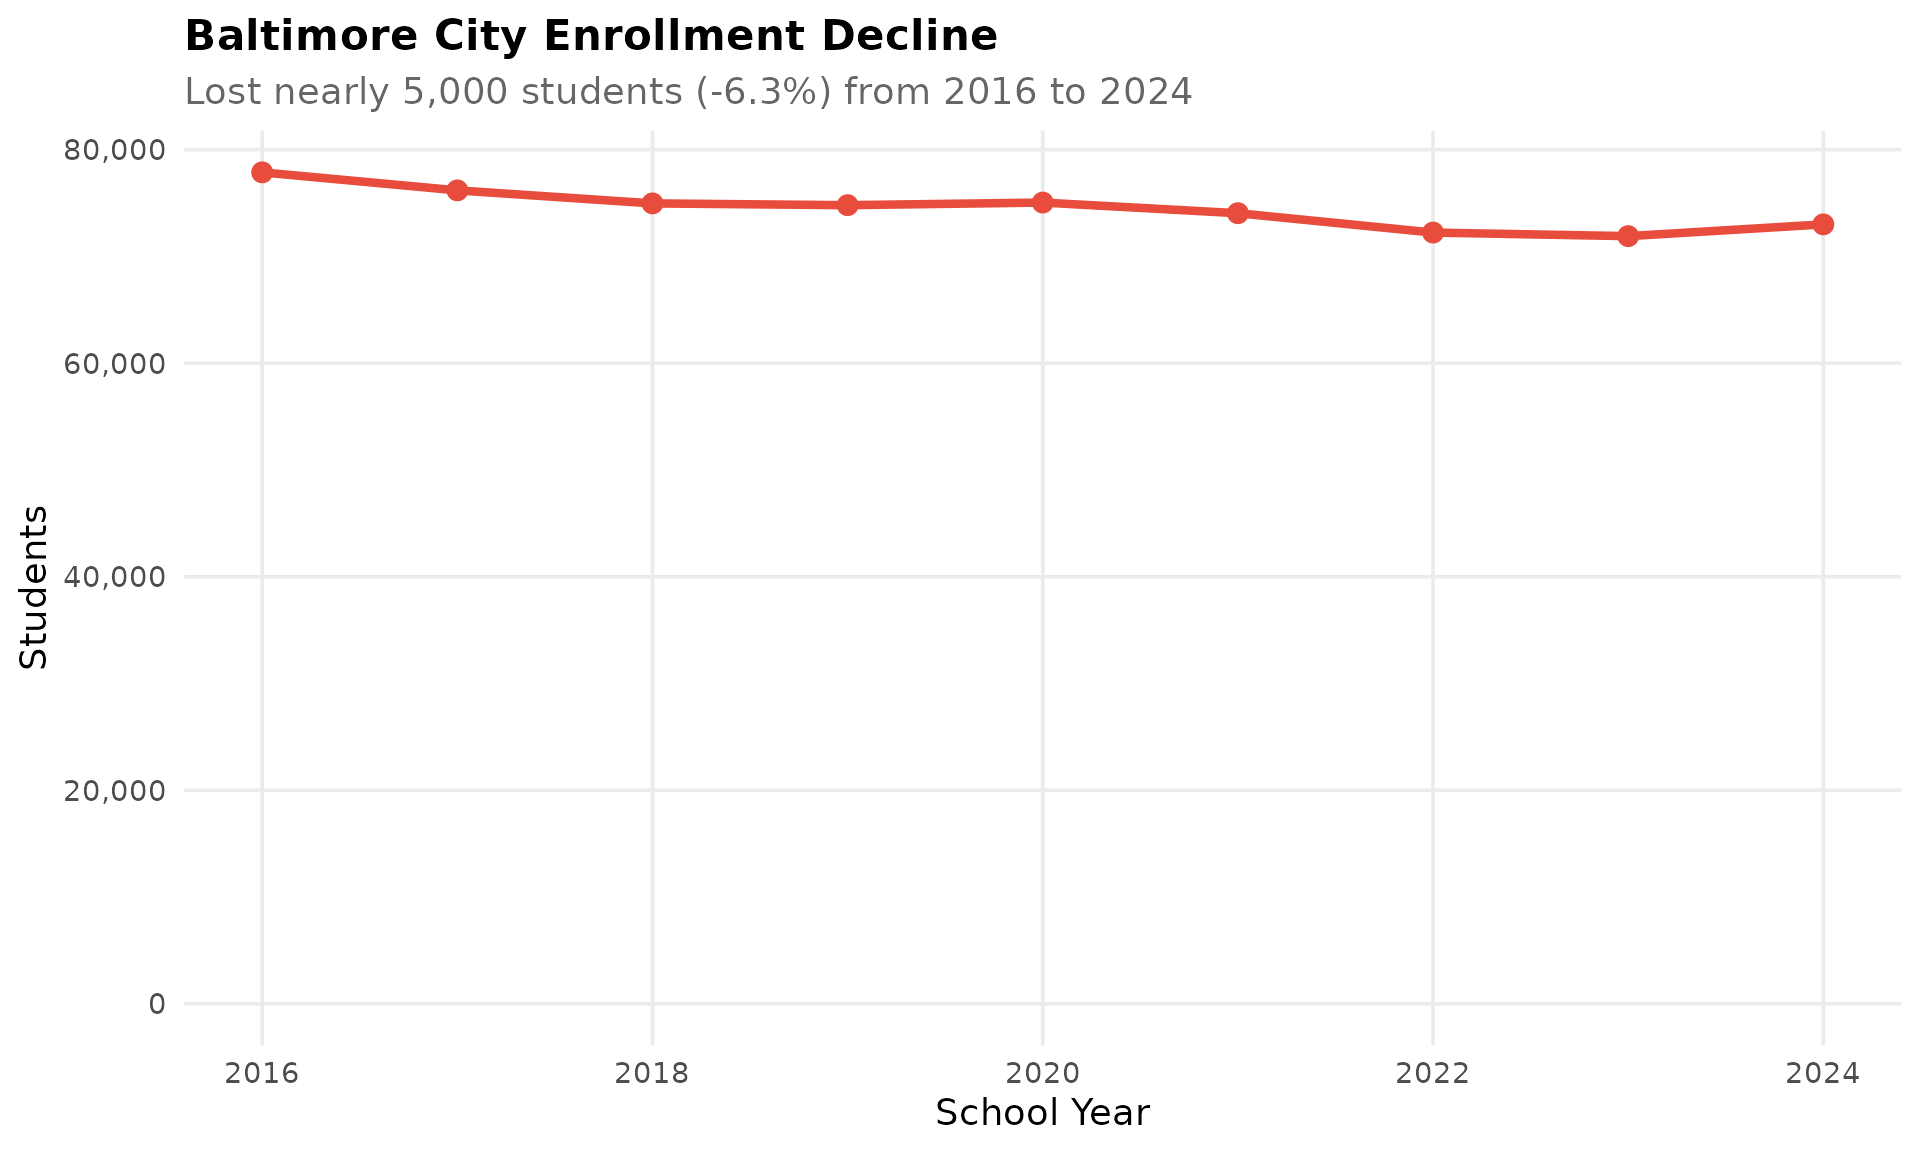
6. Less than half of Maryland students are proficient in ELA
In 2024, only 48.4% of Maryland students scored proficient or above on ELA assessments – meaning more than half struggle to meet grade-level standards in reading and writing.
ela_prof <- prof %>%
  filter(subject == "ELA All")

ela_prof %>%
  select(subject, pct_proficient)
#> # A tibble: 1 x 2
#>   subject  pct_proficient
#>   <chr>             <dbl>
#> 1 ELA All            48.4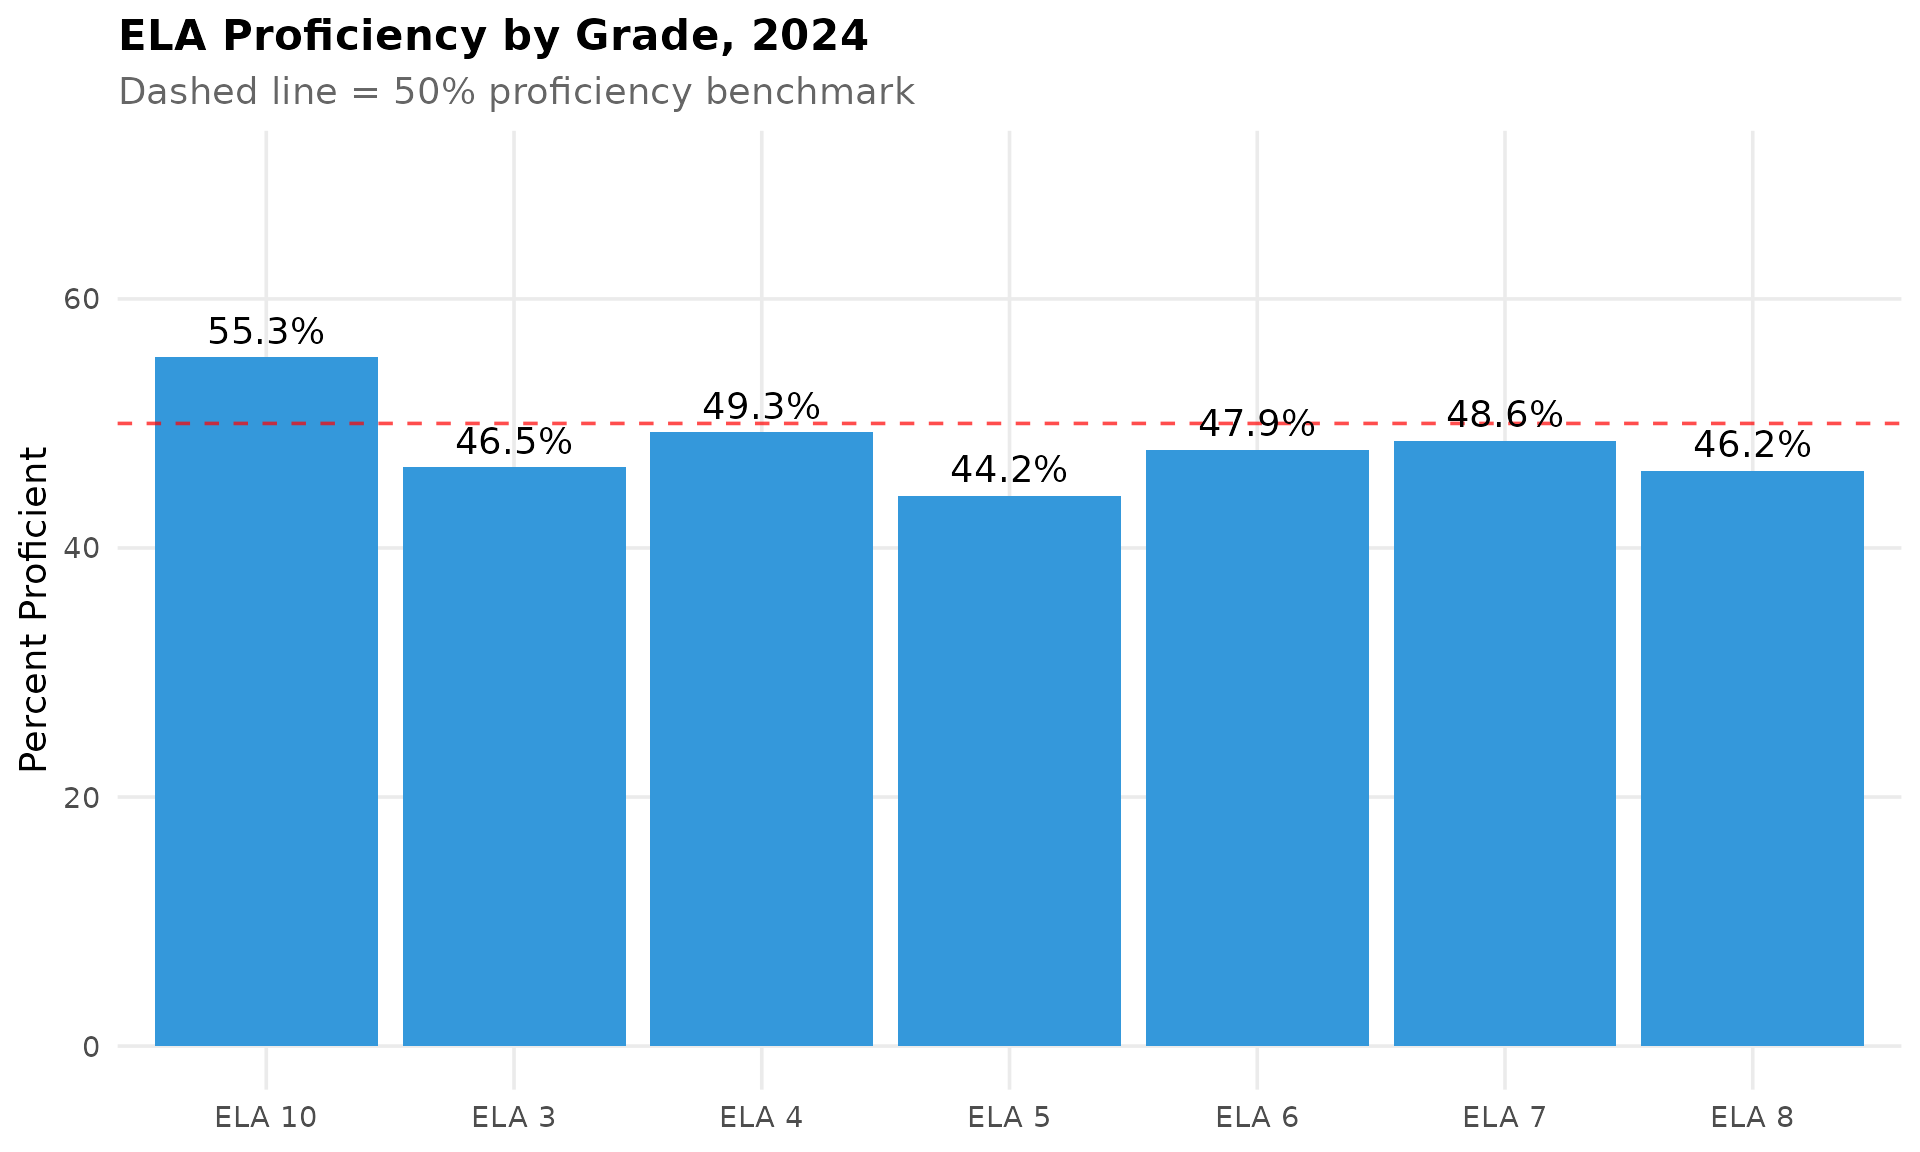
7. Math proficiency is half of ELA at just 24%
Maryland’s mathematics proficiency is alarmingly low at 24.1% statewide, less than half the ELA rate. Math 8 is the lowest at just 7% proficient.
math_prof <- prof %>%
  filter(subject == "Math All")

math_prof %>%
  select(subject, pct_proficient)
#> # A tibble: 1 x 2
#>   subject   pct_proficient
#>   <chr>              <dbl>
#> 1 Math All            24.1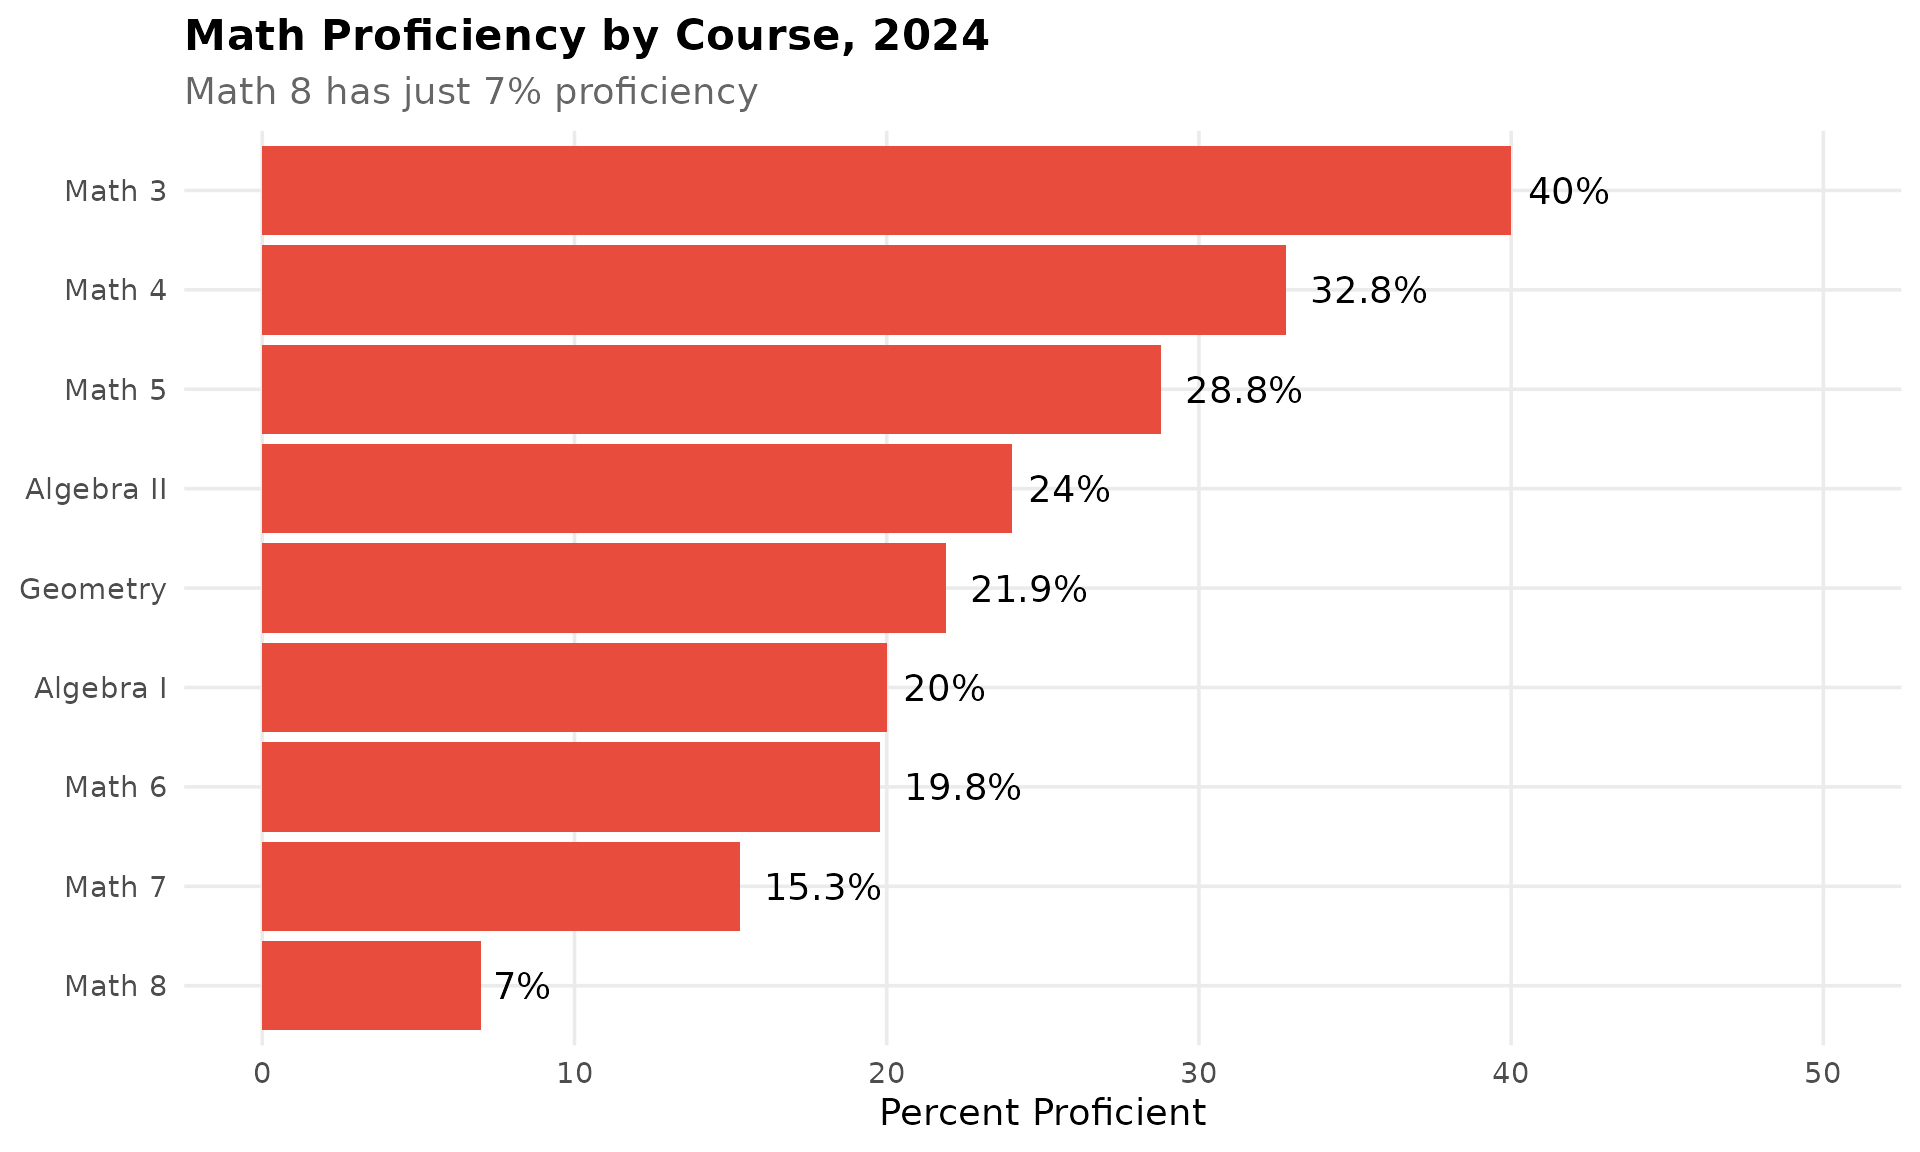
8. The I-95 corridor enrolls 61% of all Maryland students
Five counties along I-95 (Baltimore County, Montgomery, Prince George’s, Howard, and Anne Arundel) enroll 526,000 of Maryland’s 859,000 students.
i95 <- c("Baltimore County", "Montgomery", "Prince George's", "Howard", "Anne Arundel")

corridor <- get_district_totals(enr_current) %>%
  mutate(corridor = ifelse(district_name %in% i95, "I-95 Corridor", "Rest of Maryland")) %>%
  group_by(corridor) %>%
  summarize(n_students = sum(n_students, na.rm = TRUE), .groups = "drop")

stopifnot(nrow(corridor) == 2)

corridor %>%
  mutate(pct = round(n_students / sum(n_students) * 100, 1))
#> # A tibble: 2 x 3
#>   corridor         n_students   pct
#>   <chr>                 <dbl> <dbl>
#> 1 I-95 Corridor        526451  61.3
#> 2 Rest of Maryland     332632  38.7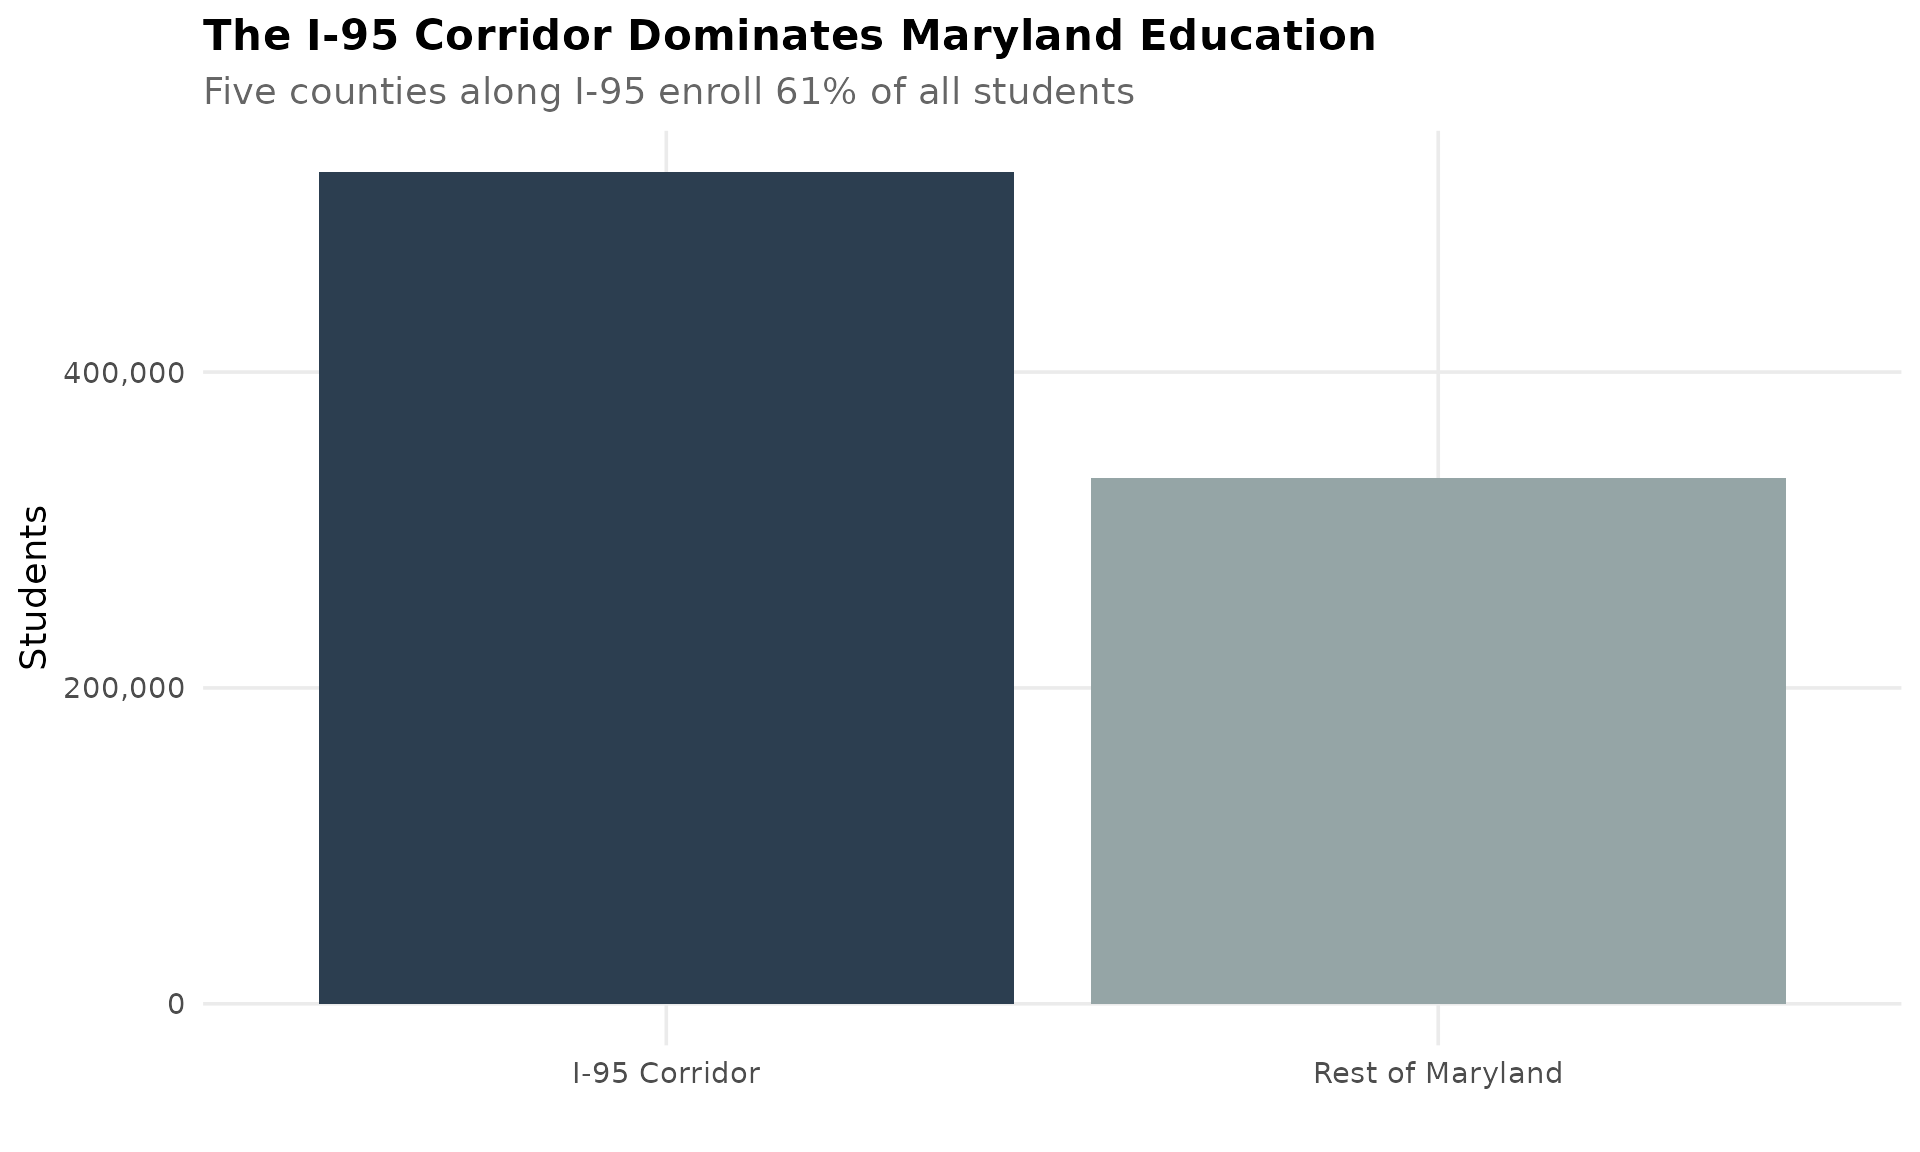
9. ELA proficiency improved 3 points since 2022
Maryland’s ELA proficiency has recovered from pandemic lows: 45.3% in 2022 to 48.4% in 2024, a gain of 3.1 percentage points.
prof_2022 <- get_statewide_proficiency(2022)
prof_2023 <- get_statewide_proficiency(2023)
prof_2024 <- get_statewide_proficiency(2024)

ela_trends <- bind_rows(
  prof_2022 %>% filter(subject == "ELA All") %>% mutate(year = 2022),
  prof_2023 %>% filter(subject == "ELA All") %>% mutate(year = 2023),
  prof_2024 %>% filter(subject == "ELA All") %>% mutate(year = 2024)
)

stopifnot(nrow(ela_trends) == 3)

ela_trends %>%
  select(year, pct_proficient) %>%
  mutate(change_from_2022 = pct_proficient - first(pct_proficient))
#> # A tibble: 3 x 3
#>    year pct_proficient change_from_2022
#>   <dbl>          <dbl>            <dbl>
#> 1  2022           45.3              0
#> 2  2023           47.9              2.6
#> 3  2024           48.4              3.1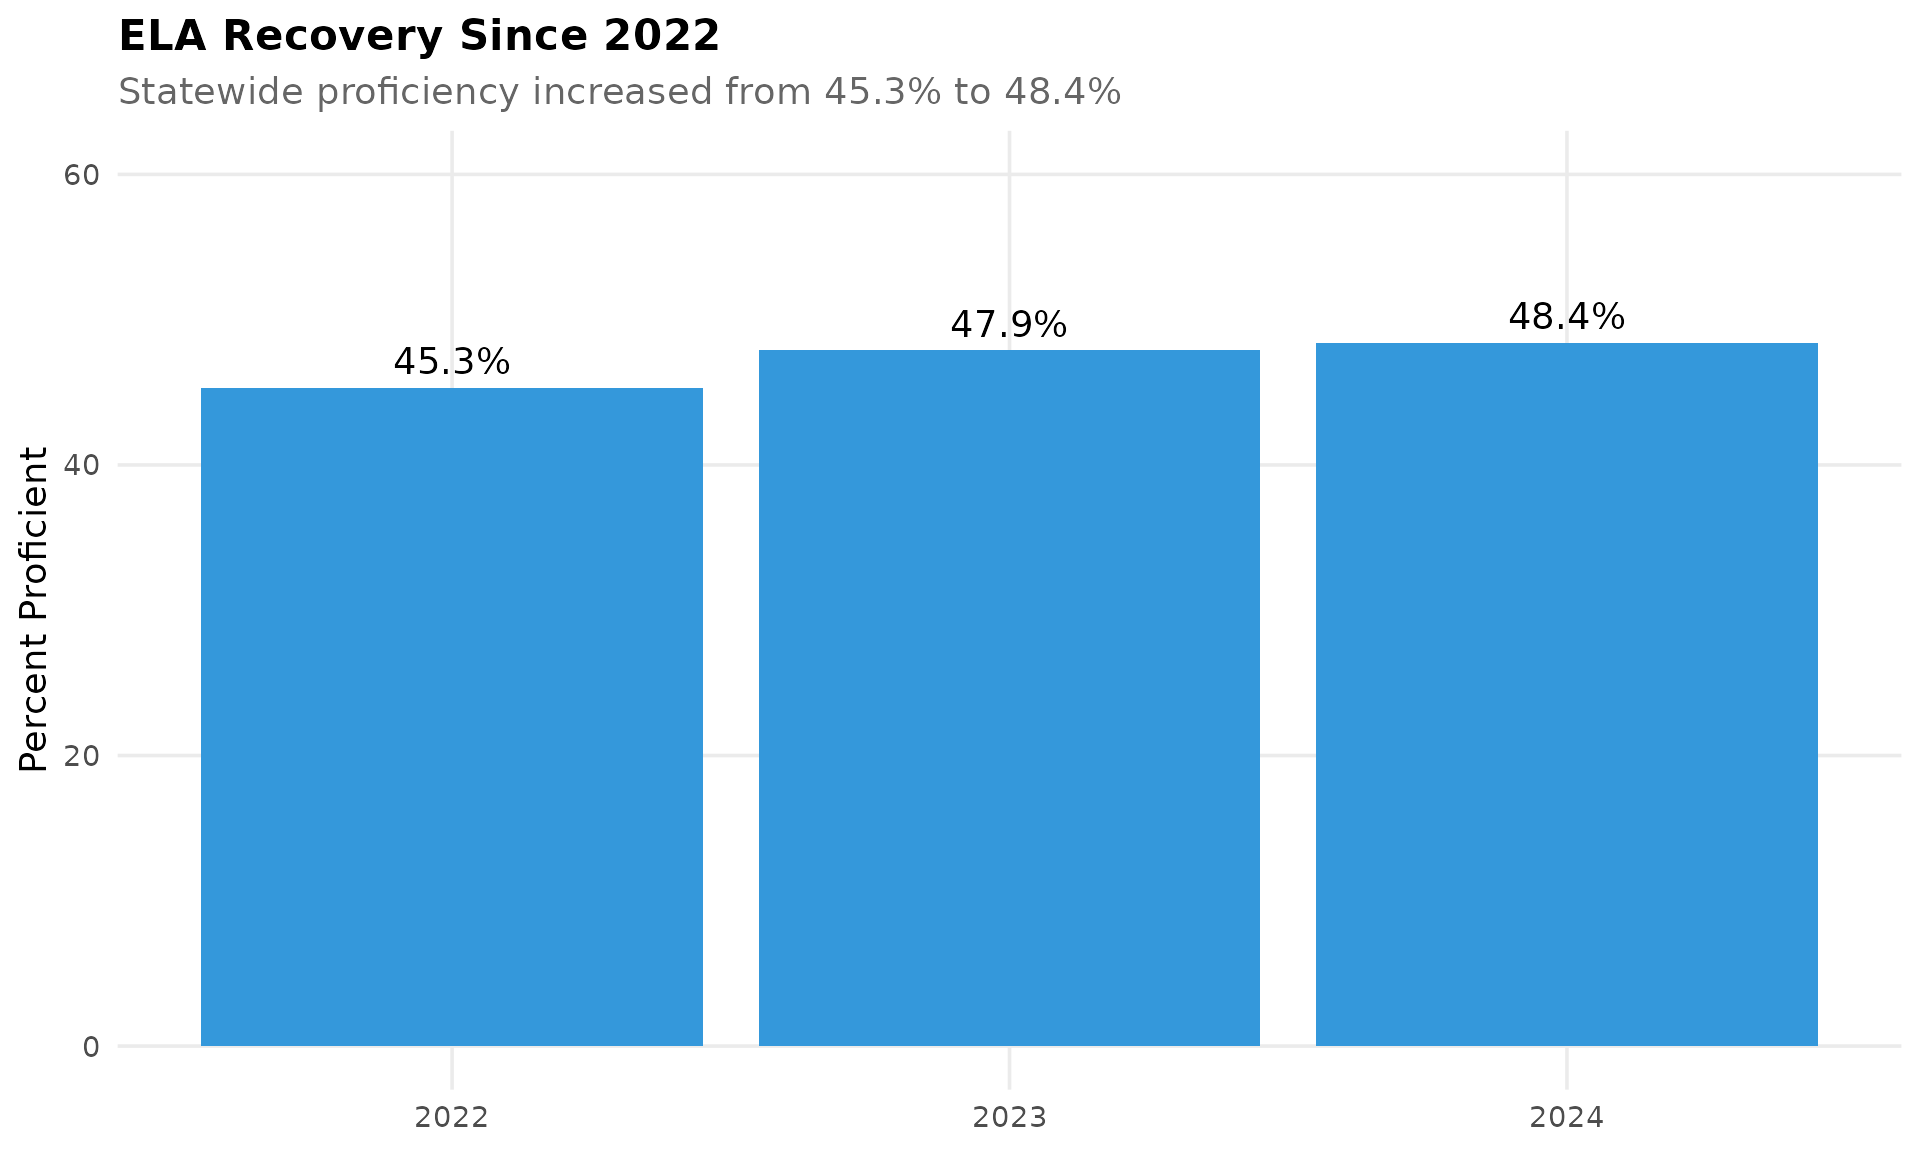
10. Western Maryland is shrinking: Garrett lost 12% since 2016
Allegany and Garrett counties in Appalachian Maryland have lost 7% and 12% of students respectively since 2016.
western <- c("Allegany", "Garrett")

western_trend <- get_district_totals(enr) %>%
  filter(district_name %in% western) %>%
  arrange(district_name, end_year)

stopifnot(nrow(western_trend) > 0)

western_trend %>%
  group_by(district_name) %>%
  filter(end_year %in% c(min(end_year), max(end_year))) %>%
  mutate(change = n_students - lag(n_students),
         pct_change = round((n_students / lag(n_students) - 1) * 100, 1)) %>%
  filter(!is.na(change)) %>%
  select(district_name, end_year, n_students, change, pct_change)
#> # A tibble: 2 x 5
#> # Groups:   district_name [2]
#>   district_name end_year n_students change pct_change
#>   <chr>            <int>      <dbl>  <dbl>      <dbl>
#> 1 Allegany          2024       7640   -572       -7.0
#> 2 Garrett           2024       3193   -445      -12.2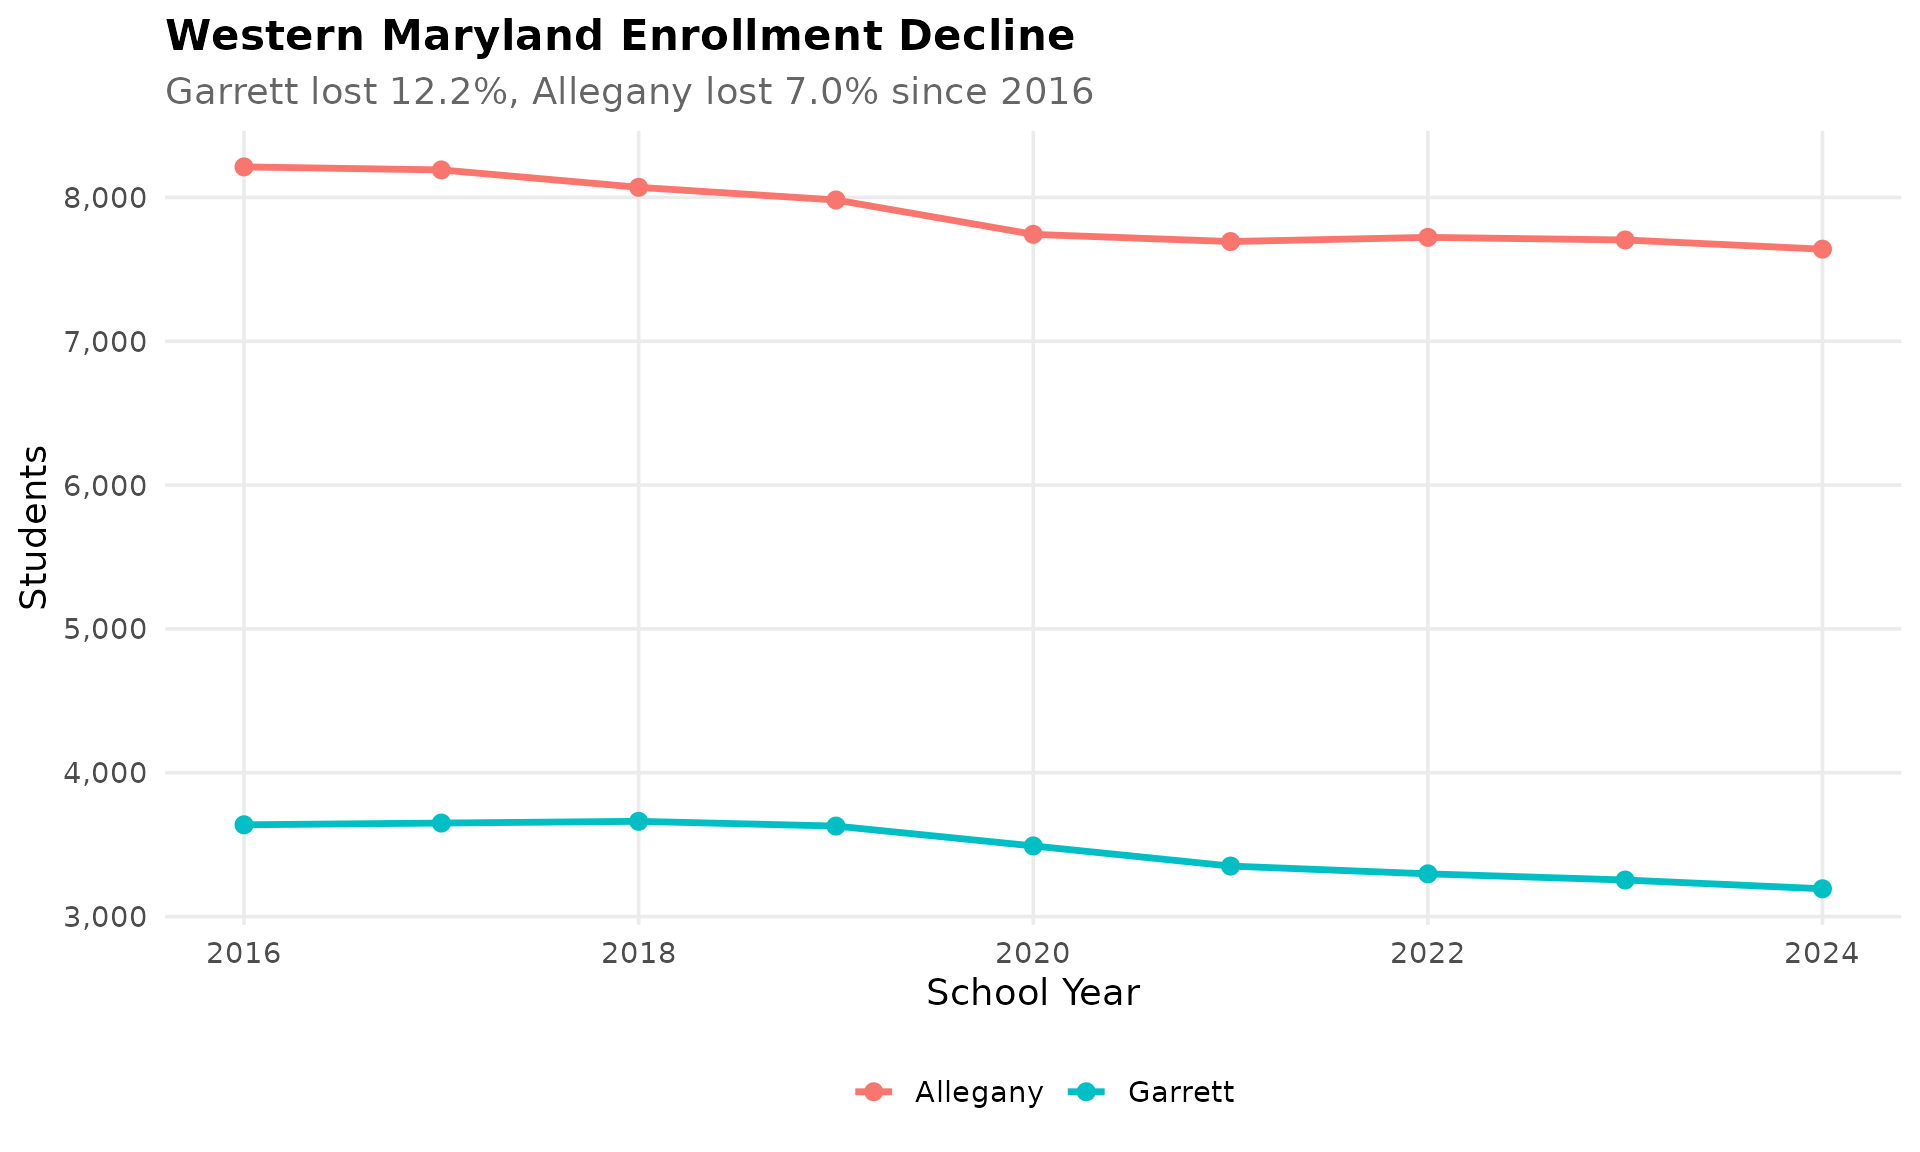
11. Grade 9 is 21% larger than grade 12
Maryland has 77,465 ninth-graders but only 63,844 twelfth-graders – a 21% drop. This pattern reflects students leaving the system before graduation.
grade_data <- enr_current %>%
  filter(is_state, subgroup == "total_enrollment", grade_level != "TOTAL") %>%
  select(grade_level, n_students) %>%
  mutate(grade_num = case_when(
    grade_level == "K" ~ 0,
    TRUE ~ as.numeric(grade_level)
  )) %>%
  arrange(grade_num)

stopifnot(nrow(grade_data) > 0)

grade_data %>%
  select(grade_level, n_students) %>%
  arrange(desc(n_students))
#> # A tibble: 13 x 2
#>   grade_level n_students
#>   <chr>            <dbl>
#> 1 09               77465
#> 2 10               71084
#> 3 03               66787
#> 4 08               66456
#> 5 05               66109
#> 6 06               65065
#> 7 11               65596
#> 8 07               65407
#> 9 04               65025
#> 10 02              64126
#> 11 12              63844
#> 12 01              62557
#> 13 K               59562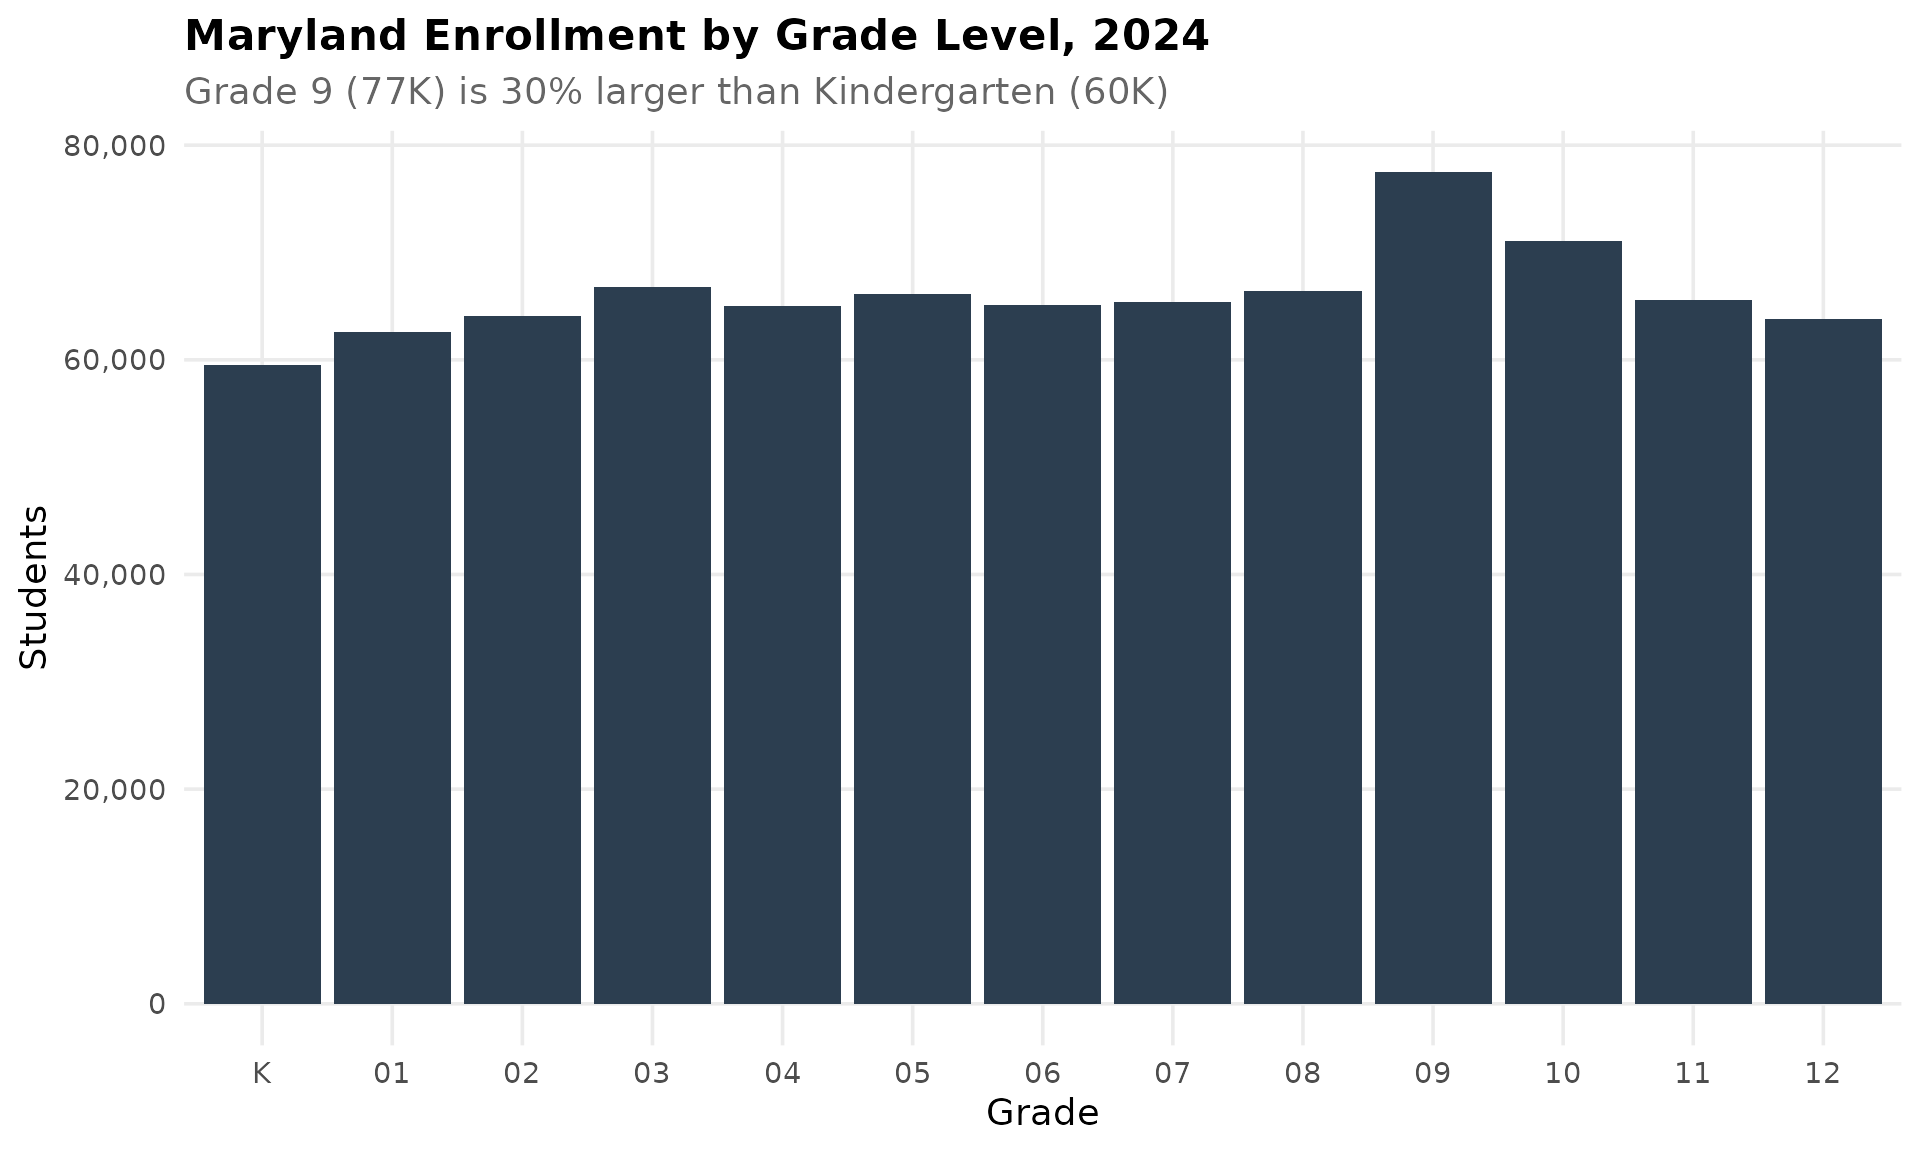
12. Montgomery County peaked in 2019 and has been declining
Maryland’s largest district reached 160,587 students in 2019, then lost nearly 6,000 students by 2024. This 3.6% decline signals broader suburban enrollment pressure.
montgomery <- get_district_totals(enr) %>%
  filter(district_name == "Montgomery") %>%
  arrange(end_year)

stopifnot(nrow(montgomery) > 0)

montgomery %>%
  select(end_year, n_students) %>%
  mutate(change = n_students - lag(n_students),
         pct_change = round((n_students / lag(n_students) - 1) * 100, 1))
#> # A tibble: 9 x 4
#>   end_year n_students change pct_change
#>      <int>      <dbl>  <dbl>      <dbl>
#> 1     2016     154690     NA       NA
#> 2     2017     157123   2433        1.6
#> 3     2018     158101    978        0.6
#> 4     2019     160587   2486        1.6
#> 5     2020     156967  -3620       -2.3
#> 6     2021     154592  -2375       -1.5
#> 7     2022     156246   1654        1.1
#> 8     2023     155788   -458       -0.3
#> 9     2024     154791   -997       -0.6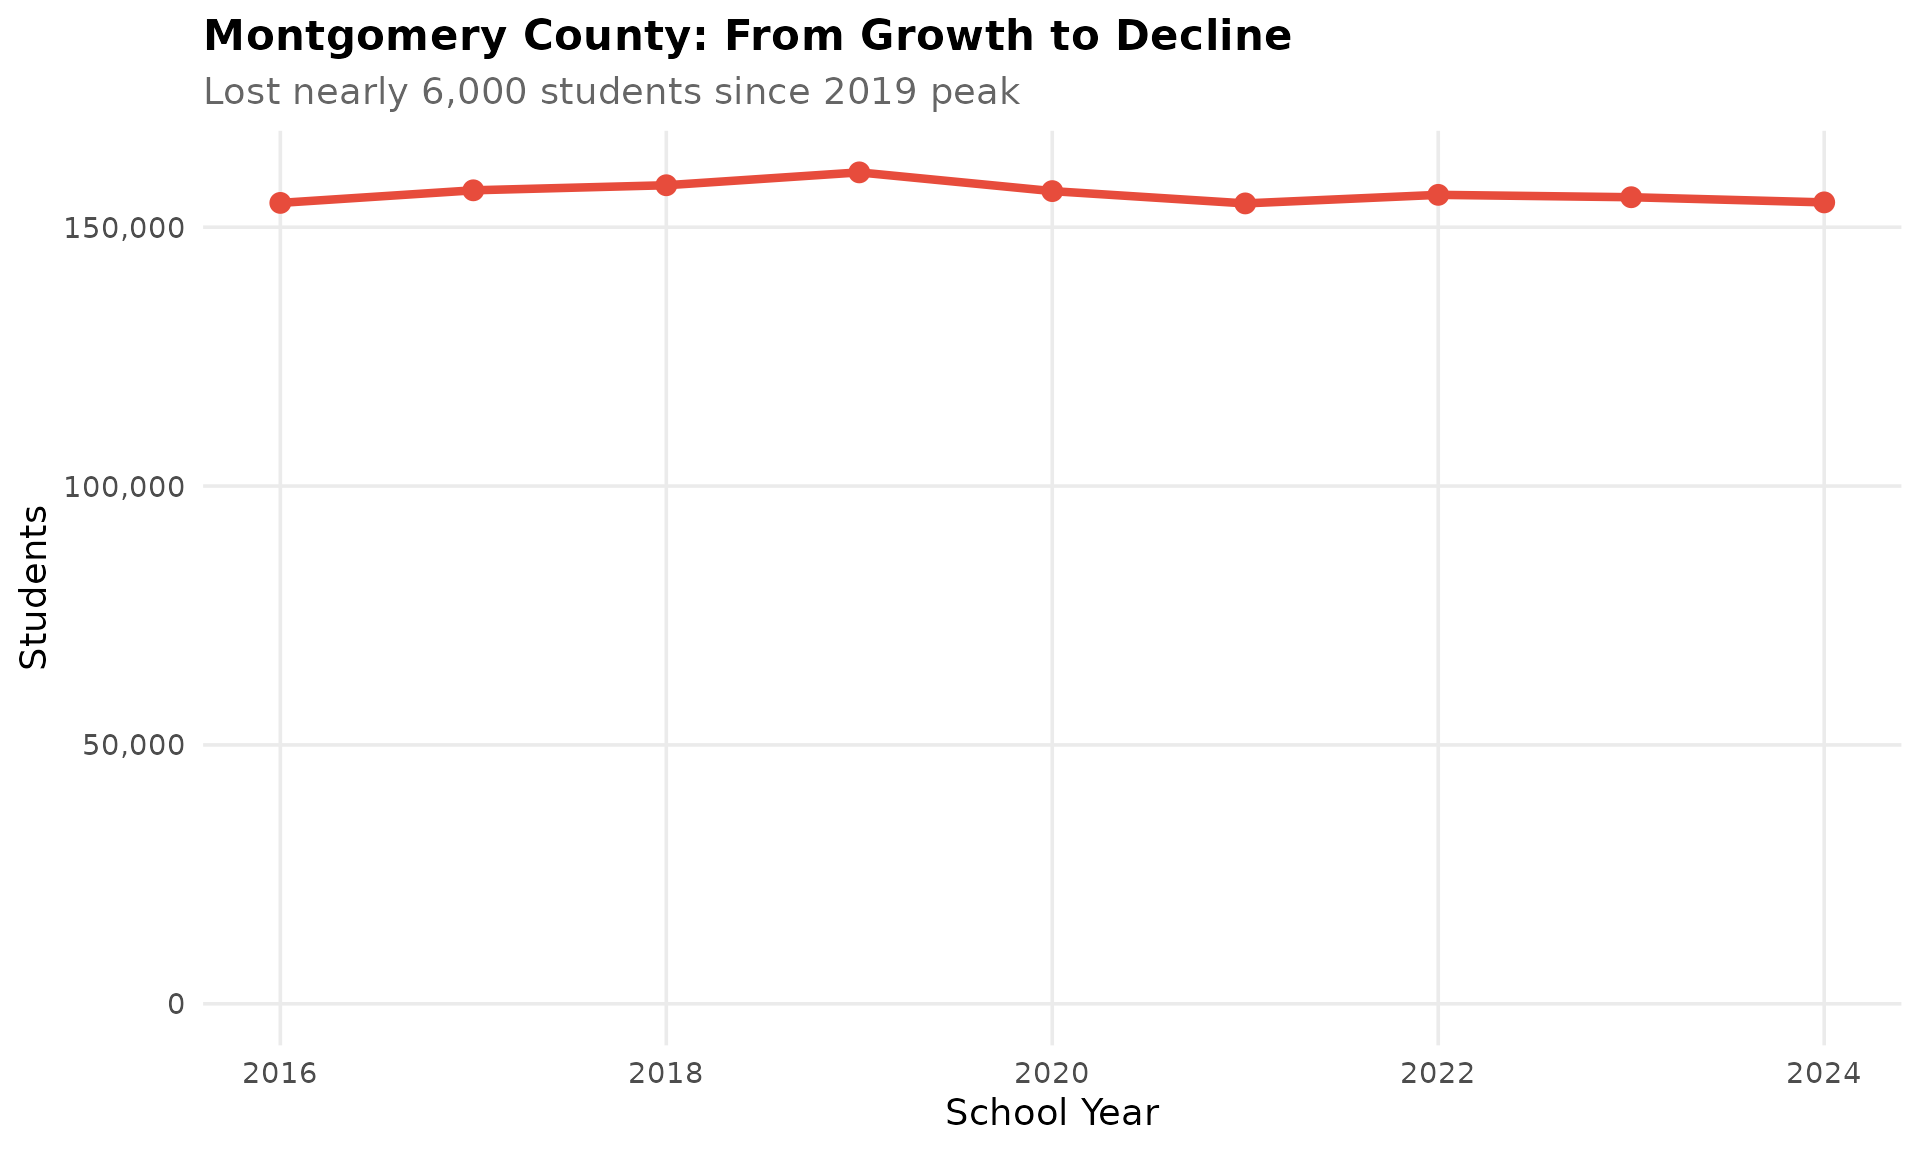
13. ELA vs Math: The proficiency gap by grade
At every grade level, ELA proficiency is roughly double math proficiency. The gap is widest in grades 7-8.
comparison <- prof %>%
  filter(grepl("^(ELA|Math) [0-9]$", subject)) %>%
  mutate(
    grade = gsub("(ELA|Math) ", "", subject),
    subject_type = ifelse(grepl("ELA", subject), "ELA", "Math")
  ) %>%
  select(grade, subject_type, pct_proficient) %>%
  pivot_wider(names_from = subject_type, values_from = pct_proficient) %>%
  mutate(gap = ELA - Math)

stopifnot(nrow(comparison) > 0)

comparison
#> # A tibble: 7 x 4
#>   grade   ELA  Math   gap
#>   <chr> <dbl> <dbl> <dbl>
#> 1 3      46.5  40.0   6.5
#> 2 4      49.3  32.8  16.5
#> 3 5      44.2  28.8  15.4
#> 4 6      47.9  19.8  28.1
#> 5 7      48.6  15.3  33.3
#> 6 8      46.2   7.0  39.2
#> 7 10     55.3    NA    NA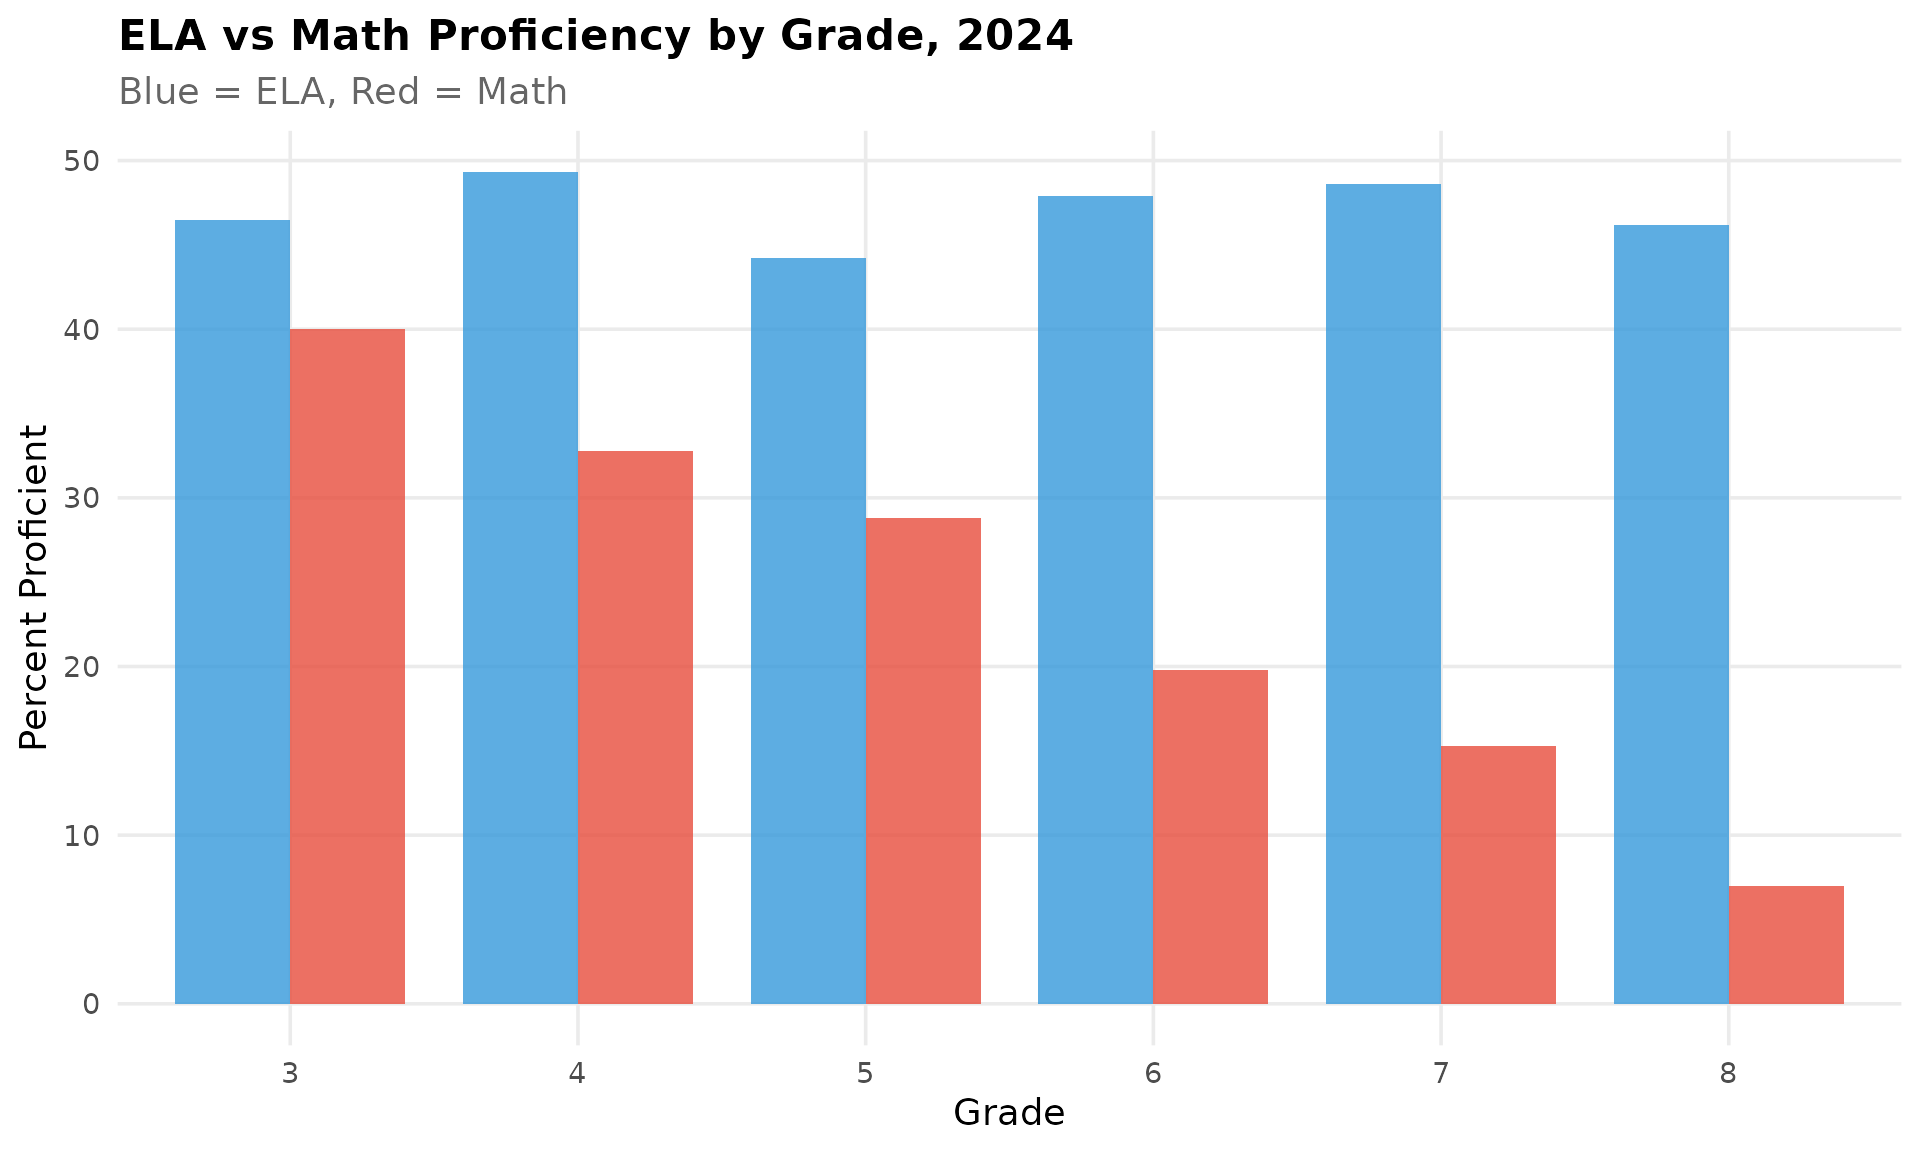
14. Anne Arundel grew 4% while nearby Baltimore County shrank
Anne Arundel County has quietly added 3,200 students since 2016, growing 4.1%. The Annapolis-area county benefits from military families at Fort Meade and its proximity to both DC and Baltimore.
aa <- get_district_totals(enr) %>%
  filter(district_name == "Anne Arundel") %>%
  arrange(end_year)

stopifnot(nrow(aa) > 0)

aa %>%
  filter(end_year %in% c(min(end_year), max(end_year))) %>%
  mutate(change = n_students - lag(n_students),
         pct_change = round((n_students / lag(n_students) - 1) * 100, 1))
#> # A tibble: 2 x 5
#>   end_year district_name n_students change pct_change
#>      <int> <chr>              <dbl>  <dbl>      <dbl>
#> 1     2016 Anne Arundel       79126     NA       NA
#> 2     2024 Anne Arundel       82353   3227        4.1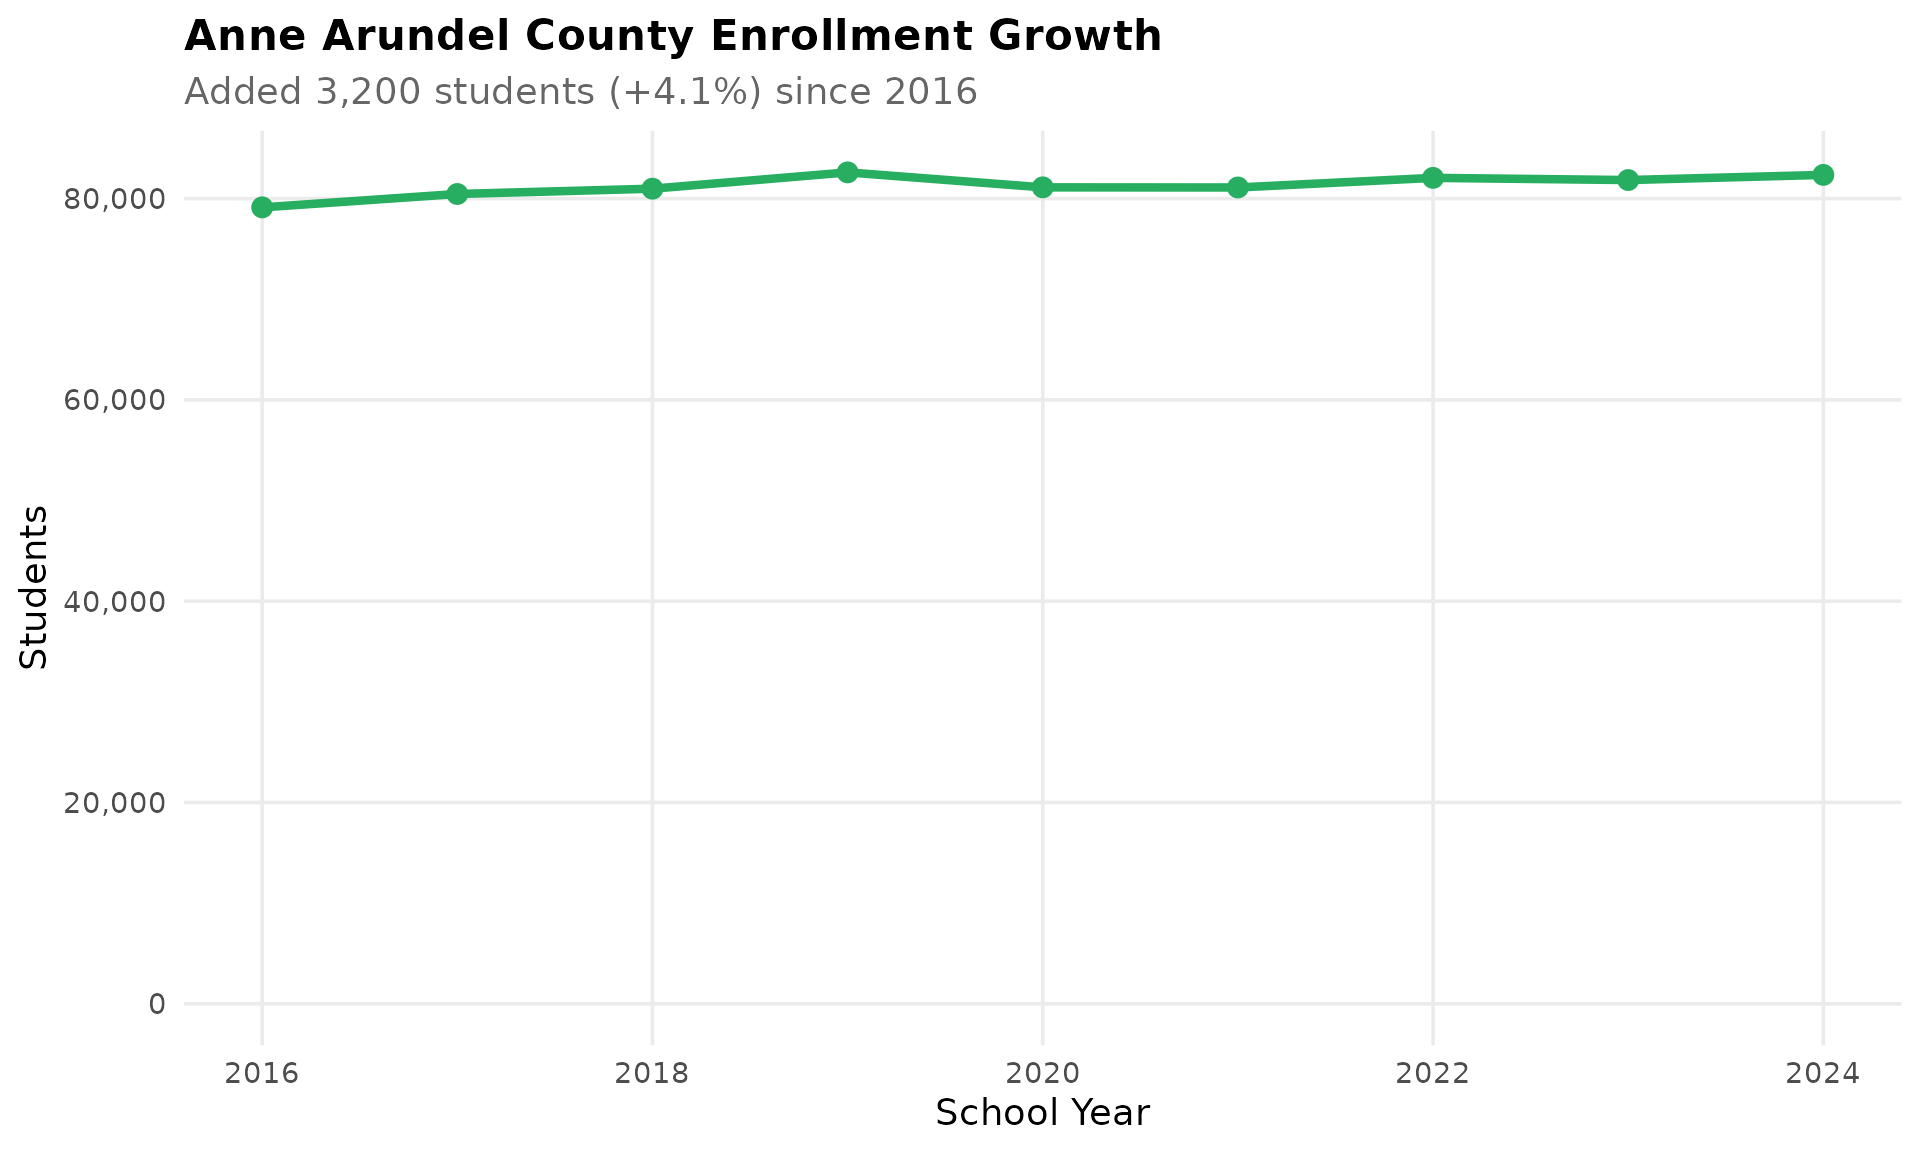
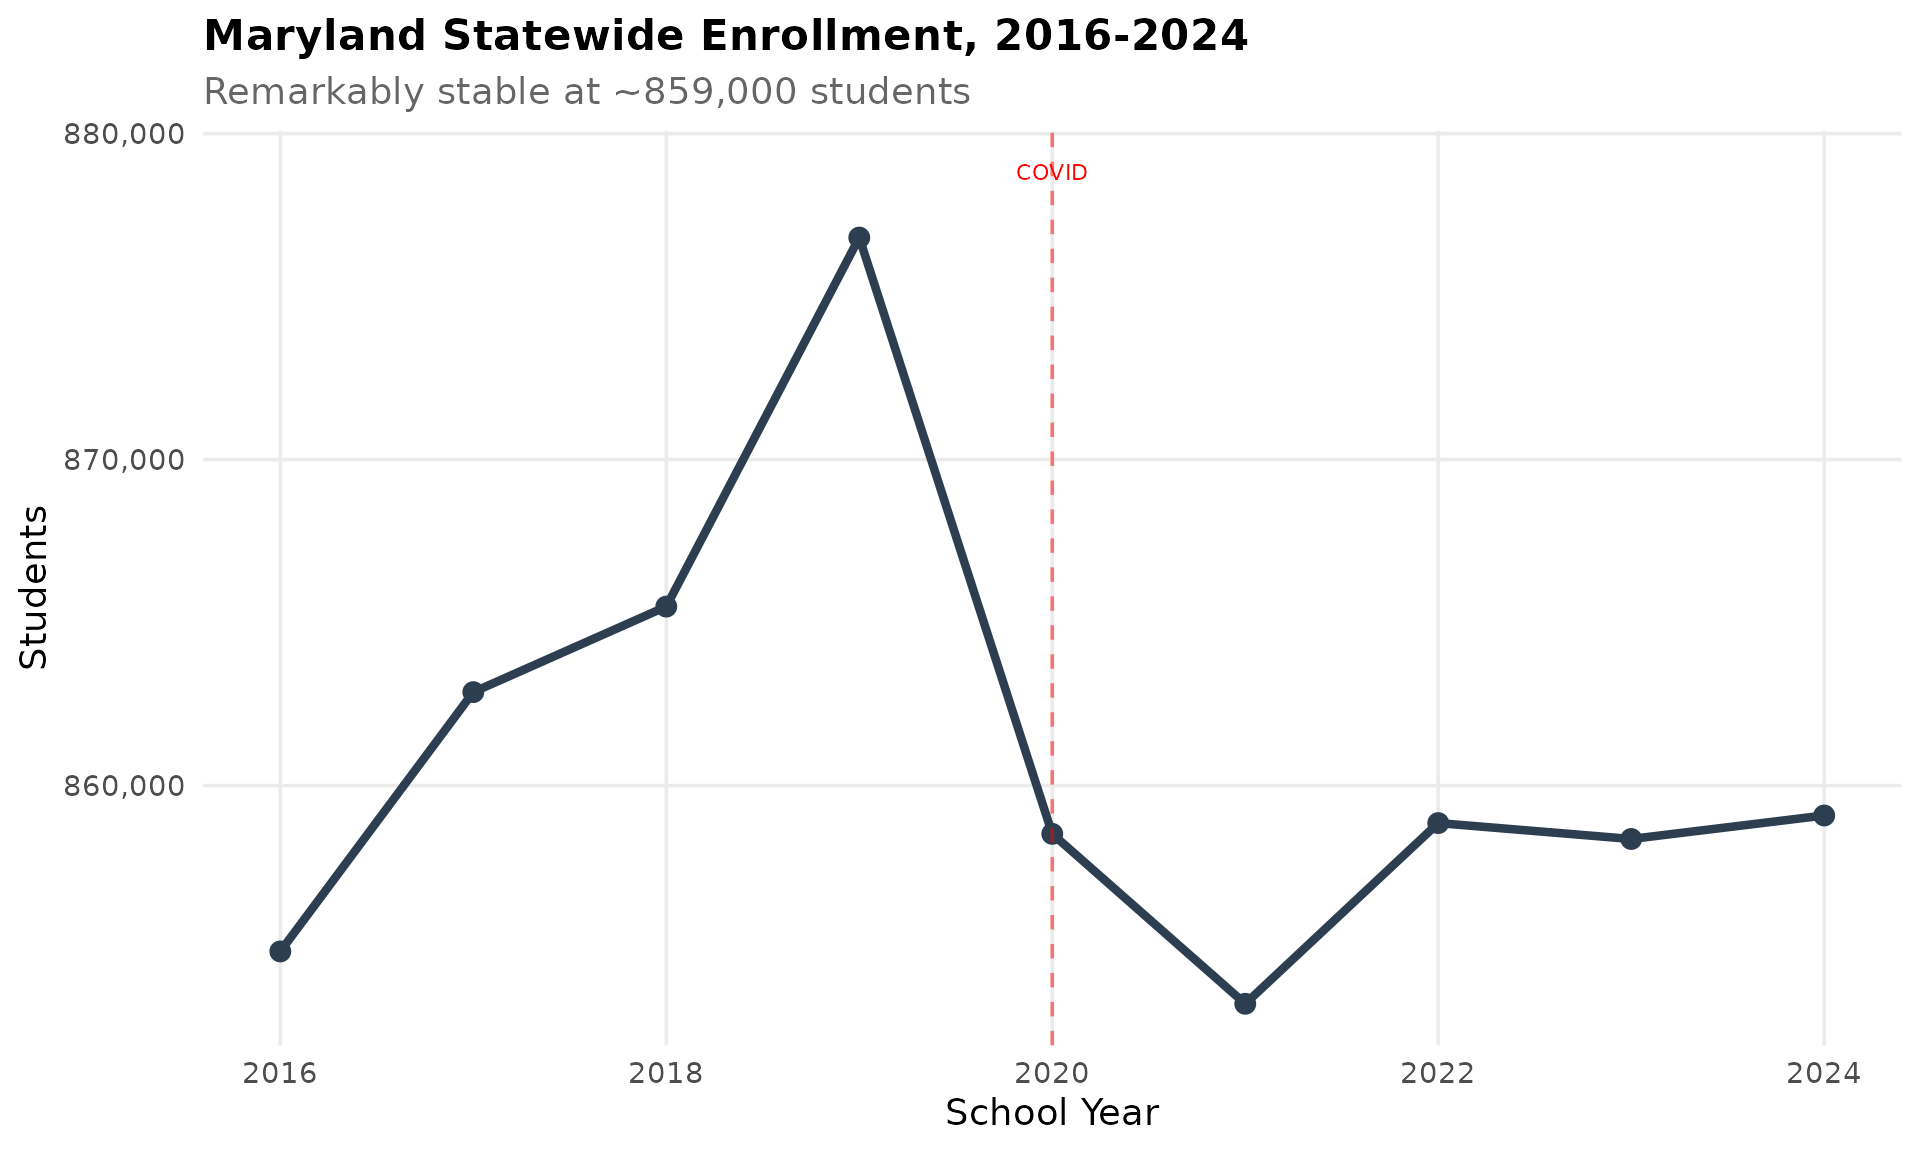
15. Maryland enrollment has been remarkably stable since 2016
Maryland has maintained roughly 855,000-877,000 students over the past 9 years. A brief dip during COVID in 2020-2021 recovered by 2022, and enrollment has held steady near 859,000.
state_trend <- get_state_totals(enr) %>%
  arrange(end_year)

stopifnot(nrow(state_trend) > 0)

state_trend %>%
  select(end_year, n_students)
#> # A tibble: 9 x 2
#>   end_year n_students
#>      <int>      <dbl>
#> 1     2016     854913
#> 2     2017     862867
#> 3     2018     865491
#> 4     2019     876810
#> 5     2020     858519
#> 6     2021     853307
#> 7     2022     858850
#> 8     2023     858362
#> 9     2024     859083