Fetch and analyze Michigan school enrollment data from the Center for Educational Performance and Information (CEPI) in R or Python.
Part of the njschooldata family.
Full documentation — all 15 stories with interactive charts, getting-started guide, and complete function reference.
Highlights
library(mischooldata)
library(ggplot2)
library(dplyr)
library(scales)

theme_readme <- function() {
  theme_minimal(base_size = 14) +
    theme(
      plot.title = element_text(face = "bold", size = 16),
      plot.subtitle = element_text(color = "gray40"),
      panel.grid.minor = element_blank(),
      legend.position = "bottom"
    )
}

colors <- c("total" = "#2C3E50", "white" = "#3498DB", "black" = "#E74C3C",
            "hispanic" = "#F39C12", "asian" = "#9B59B6", "native_american" = "#1ABC9C",
            "pacific_islander" = "#E67E22", "multiracial" = "#95A5A6")
1. Detroit’s collapse is staggering
Detroit Public Schools has lost over 100,000 students since 2000. The district went from 154,648 students in 2000 (as Detroit City School District) to 48,117 in 2025 (as Detroit Public Schools Community District after a 2016 restructuring). This represents one of the most dramatic urban enrollment declines in American education history.
library(mischooldata)
library(dplyr)

# Note: Detroit district ID changed from 82010 to 82015 in 2016 restructuring
enr_long <- fetch_enr_multi(c(2000, 2005, 2010, 2020, 2025), use_cache = TRUE)

detroit <- enr_long %>%
  filter(is_district,
         grepl("Detroit City|Detroit Public Schools Community", district_name),
         subgroup == "total_enrollment", grade_level == "TOTAL") %>%
  select(end_year, district_name, n_students)
stopifnot(nrow(detroit) > 0)
detroit
#> # A tibble: 5 x 3
#>   end_year district_name                            n_students
#>      <dbl> <chr>                                         <dbl>
#> 1     2000 Detroit City School District                 154648
#> 2     2005 Detroit City School District                 141406
#> 3     2010 Detroit City School District                  87877
#> 4     2020 Detroit Public Schools Community District     50016
#> 5     2025 Detroit Public Schools Community District     48117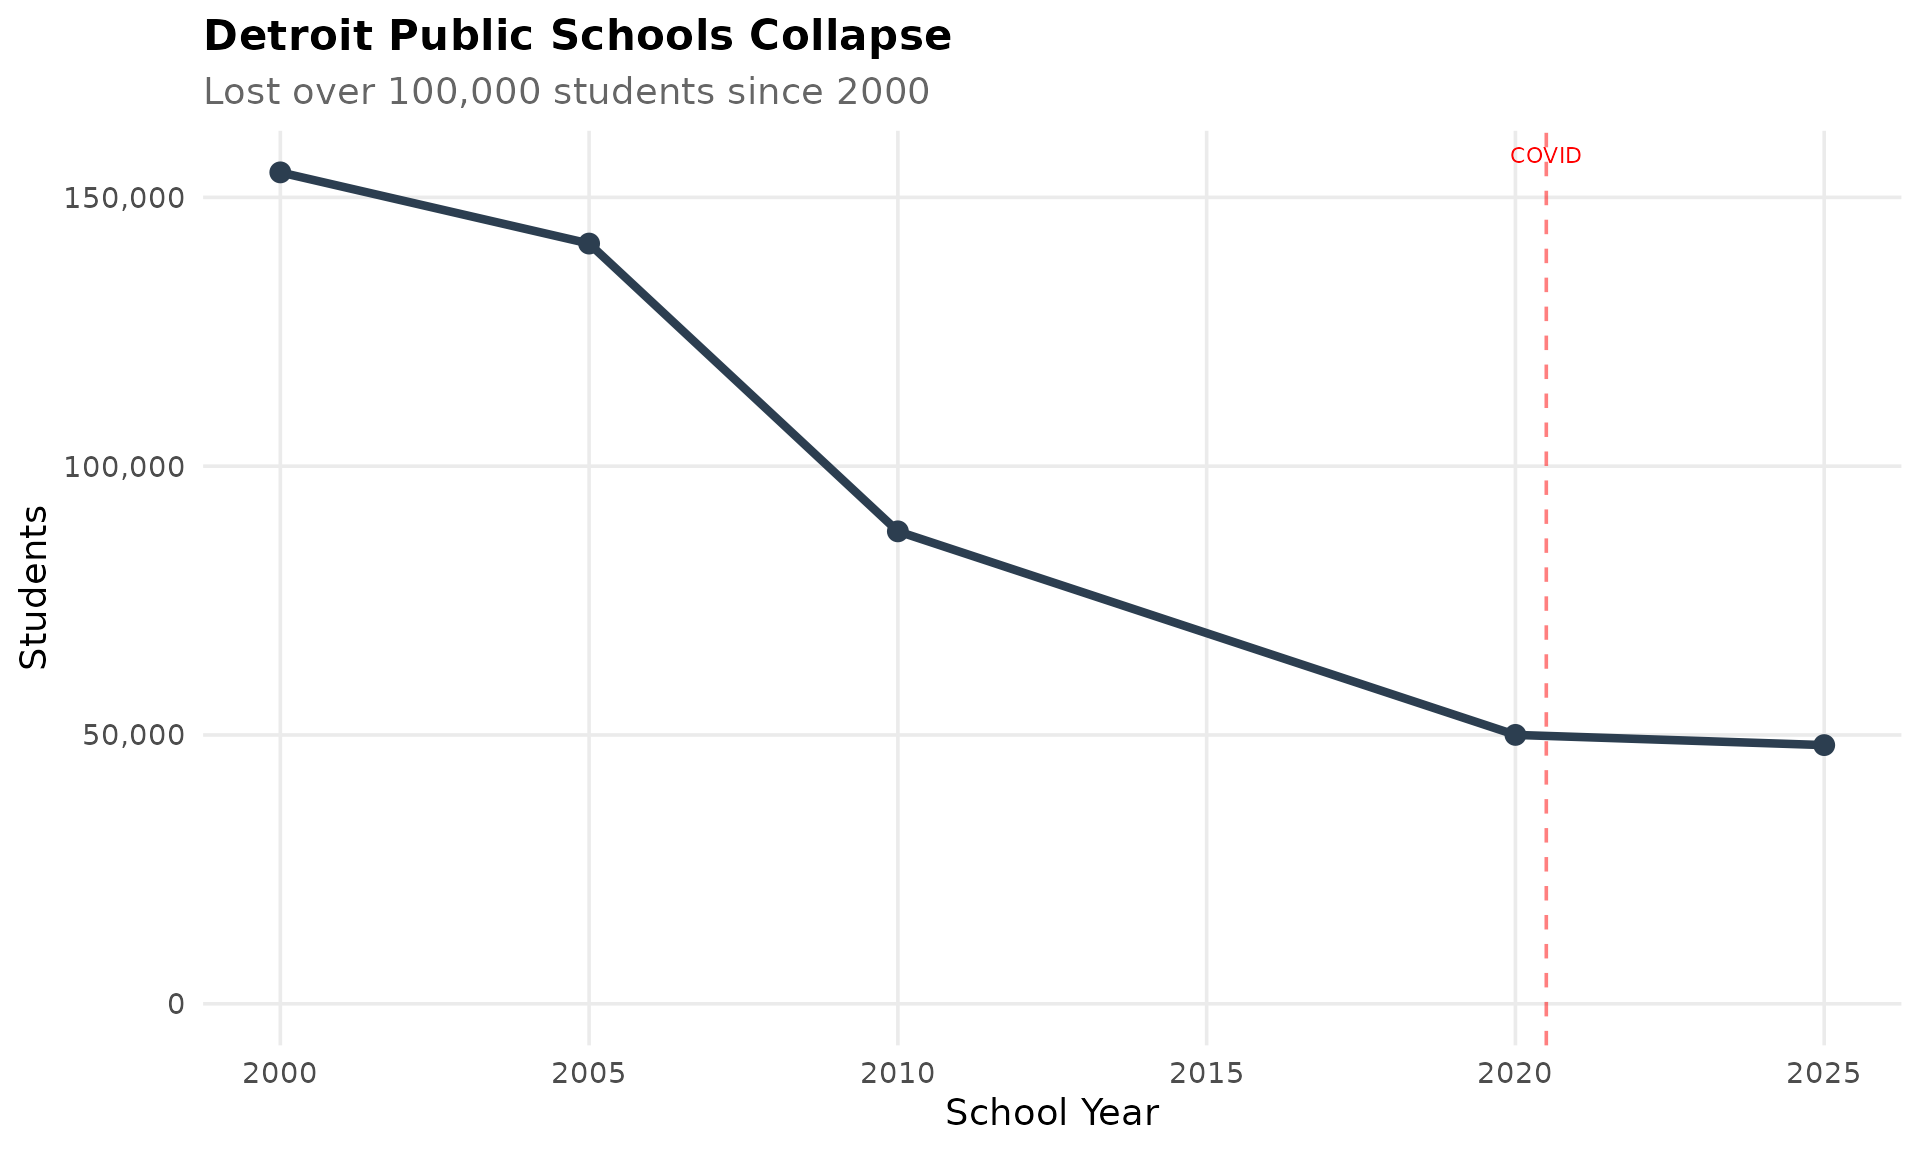
2. Flint’s water crisis visible in enrollment
Flint, School District of the City of, has lost 44% of students since 2018, dropping from 4,503 to 2,541. The water crisis accelerated an already declining enrollment as families fled the city.
library(mischooldata)
library(dplyr)

enr <- fetch_enr_multi(2018:2025, use_cache = TRUE)

flint <- enr %>%
  filter(is_district, grepl("Flint, School District", district_name, ignore.case = TRUE),
         subgroup == "total_enrollment", grade_level == "TOTAL") %>%
  select(end_year, n_students)
stopifnot(nrow(flint) > 0)
flint
#> # A tibble: 8 x 2
#>   end_year n_students
#>      <dbl>      <dbl>
#> 1     2018       4503
#> 2     2019       4183
#> 3     2020       3700
#> 4     2021       3122
#> 5     2022       2989
#> 6     2023       2790
#> 7     2024       2835
#> 8     2025       2541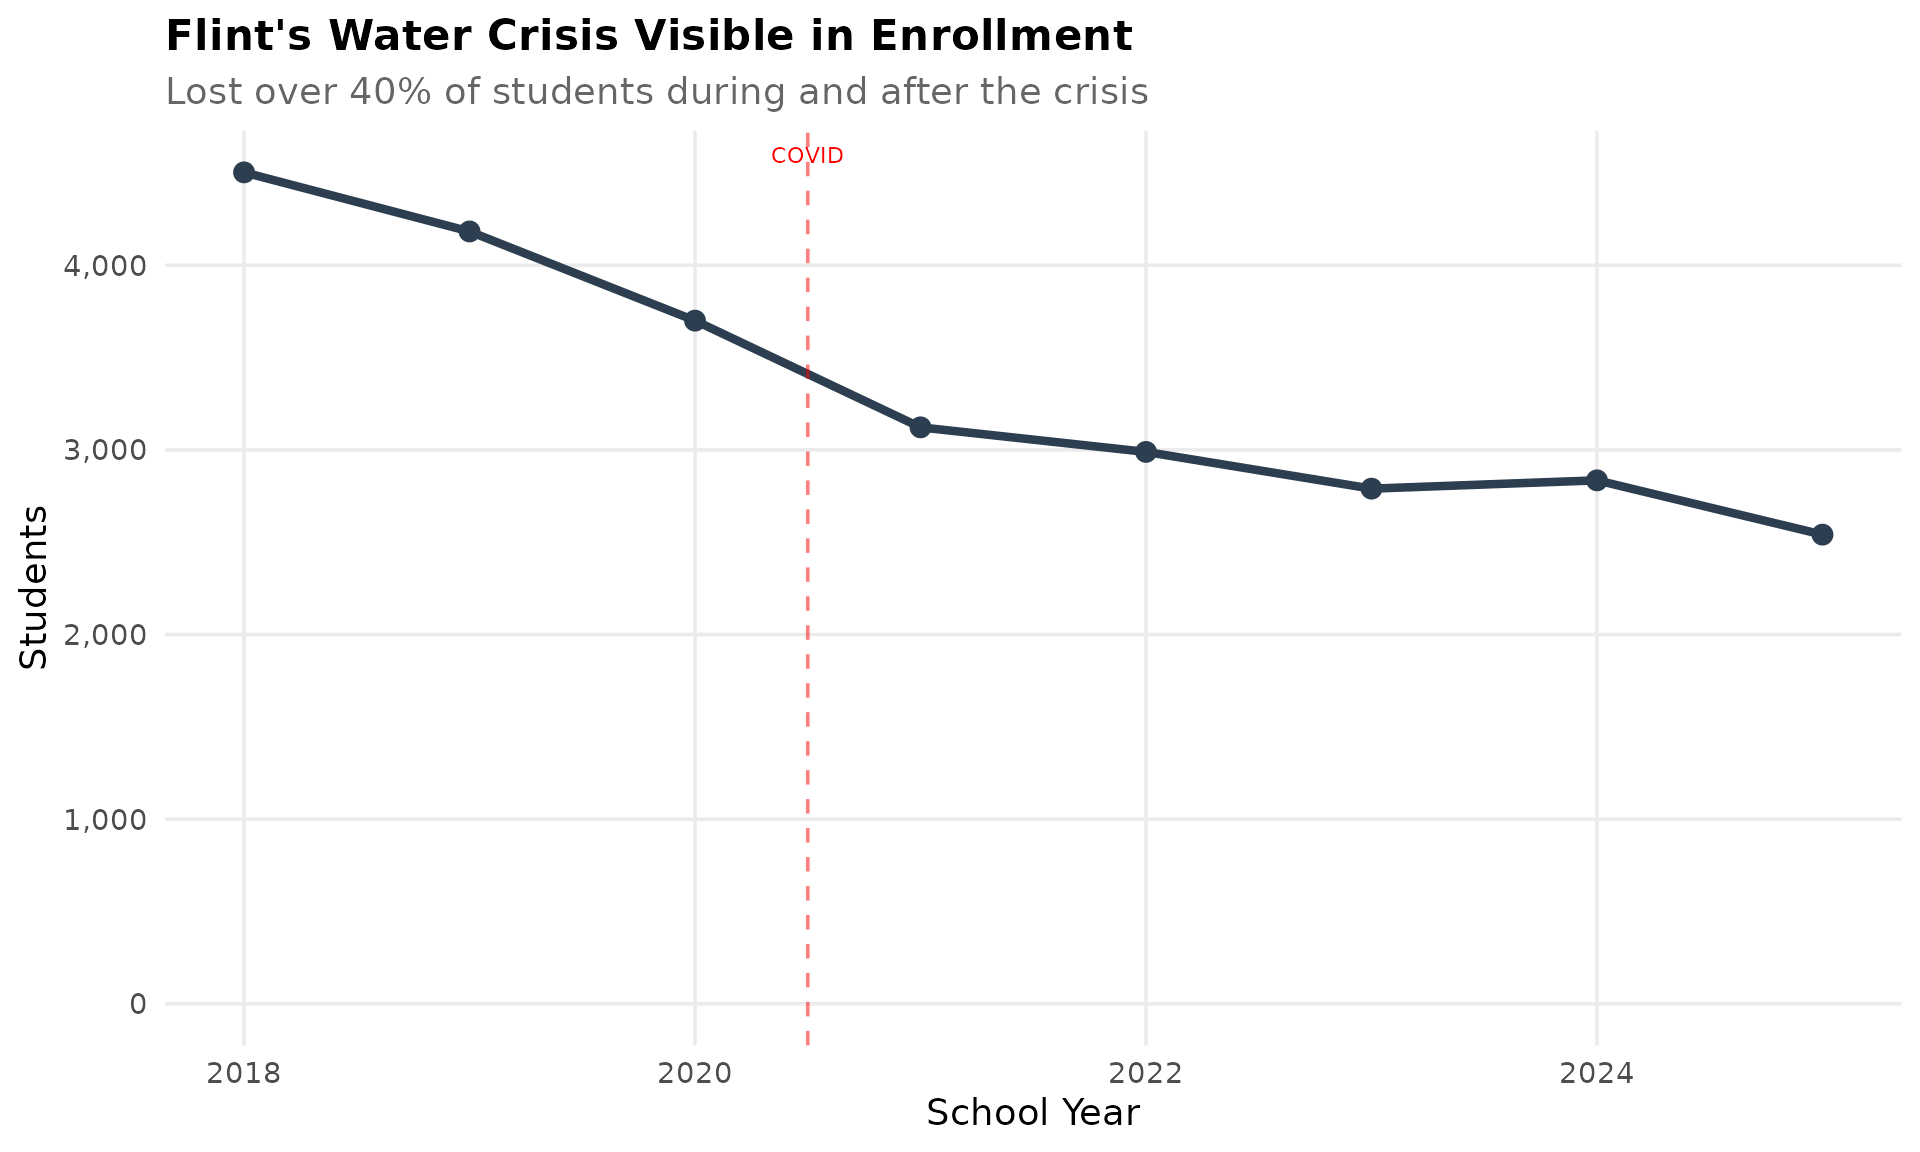
3. Multiracial enrollment growing fastest
Multiracial students are Michigan’s fastest-growing demographic, increasing 31% from 57,291 to 75,055 students since 2018. While overall enrollment declines, multiracial and Hispanic populations continue to grow.
library(mischooldata)
library(dplyr)

enr <- fetch_enr_multi(2018:2025, use_cache = TRUE)

multiracial_state <- enr %>%
  filter(is_state, subgroup == "multiracial", grade_level == "TOTAL") %>%
  select(end_year, n_students)
stopifnot(nrow(multiracial_state) > 0)
multiracial_state
#> # A tibble: 8 x 2
#>   end_year n_students
#>      <dbl>      <dbl>
#> 1     2018      57291
#> 2     2019      60457
#> 3     2020      63515
#> 4     2021      65101
#> 5     2022      68328
#> 6     2023      70956
#> 7     2024      73294
#> 8     2025      75055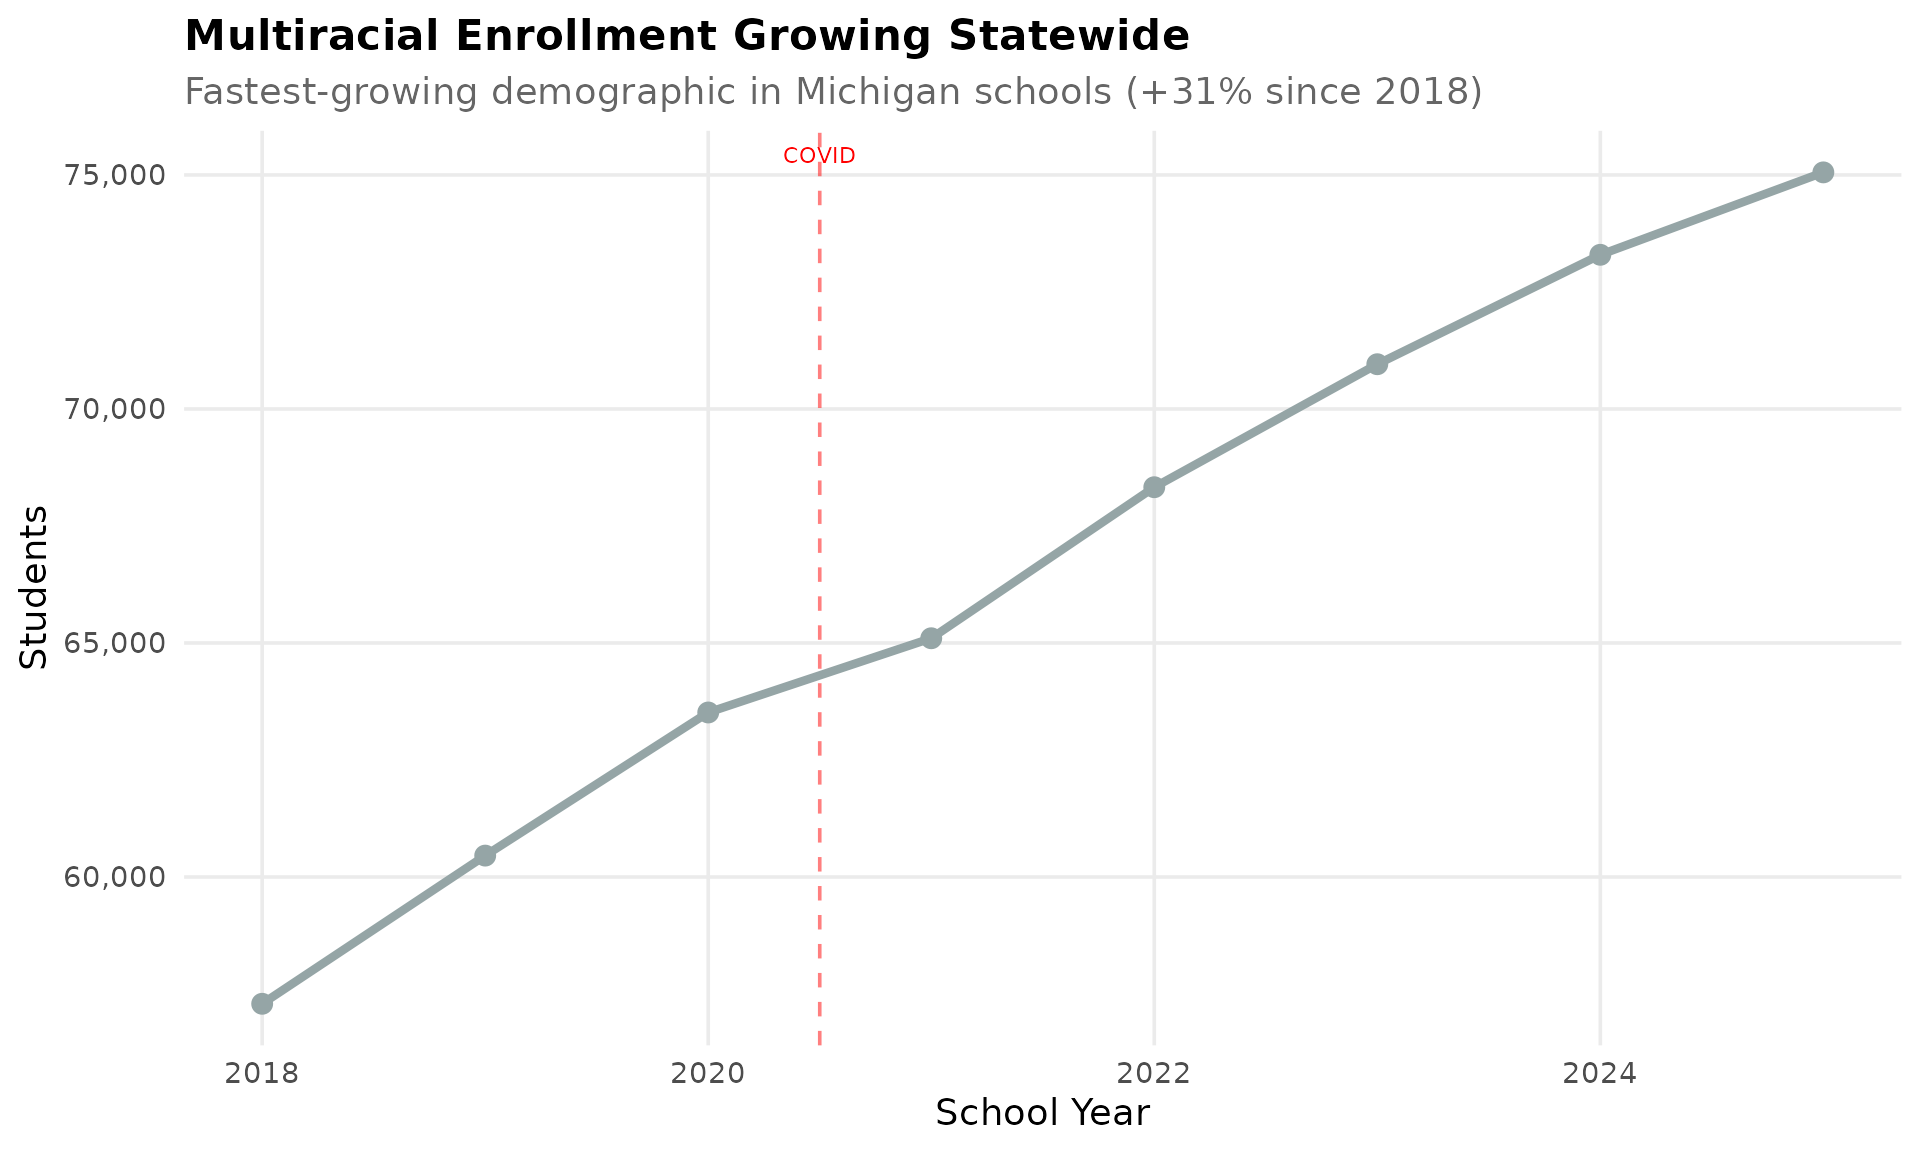
Data Taxonomy
| Category | Years | Function | Details |
|---|---|---|---|
| Enrollment | 1996-2025 |
fetch_enr() / fetch_enr_multi()
|
State, district, building. Race, gender |
| Assessments | 2007-2025 |
fetch_assessment() / fetch_assessment_multi()
|
M-STEP (2015+), MEAP (2007-2014). ELA, Math, Science, Social Studies. No 2020 (COVID) |
| Graduation | — | — | Not yet available |
| Directory | Current | fetch_directory() |
ISD, LEA, PSA districts and schools. Addresses, phone, superintendent/principal, grades served |
| Per-Pupil Spending | — | — | Not yet available |
| Accountability | — | — | Not yet available |
| Chronic Absence | — | — | Not yet available |
| EL Progress | — | — | Not yet available |
| Special Ed | — | — | Not yet available |
See DATA-CATEGORY-TAXONOMY.md for what each category covers.
Quick Start
R
# install.packages("remotes")
remotes::install_github("almartin82/mischooldata")
library(mischooldata)
library(dplyr)

# Fetch one year
enr_2025 <- fetch_enr(2025, use_cache = TRUE)

# Fetch multiple years
enr_multi <- fetch_enr_multi(2020:2025, use_cache = TRUE)

# State totals
enr_2025 %>%
  filter(is_state, subgroup == "total_enrollment", grade_level == "TOTAL") %>%
  select(end_year, n_students)
#> # A tibble: 1 x 2
#>   end_year n_students
#>      <dbl>      <dbl>
#> 1     2025    1366207

# Largest districts
enr_2025 %>%
  filter(is_district, subgroup == "total_enrollment", grade_level == "TOTAL") %>%
  arrange(desc(n_students)) %>%
  head(5) %>%
  select(district_name, n_students)
#> # A tibble: 5 x 2
#>   district_name                            n_students
#>   <chr>                                         <dbl>
#> 1 Detroit Public Schools Community District     48117
#> 2 Utica Community Schools                       25092
#> 3 Dearborn City School District                 19168
#> 4 Ann Arbor Public Schools                      16810
#> 5 Plymouth-Canton Community Schools             15885
Python
import pymischooldata as mi

# Check available years
years = mi.get_available_years()
print(f"Data available from {years['min_year']} to {years['max_year']}")
#> Data available from 1996 to 2025

# Fetch one year
enr_2025 = mi.fetch_enr(2025)

# State totals
state_total = enr_2025[
    (enr_2025['is_state'] == True) &
    (enr_2025['subgroup'] == 'total_enrollment') &
    (enr_2025['grade_level'] == 'TOTAL')
]
print(state_total[['end_year', 'n_students']])
#>    end_year  n_students
#> 0      2025     1366207
Explore More
- Full documentation — 15 stories with interactive charts
- Enrollment trends — 15 stories
- Function reference
Data Notes
Data Source
All data is sourced directly from the Michigan Center for Educational Performance and Information (CEPI): - Main portal: https://www.mischooldata.org/ - Data files: https://www.mischooldata.org/student-enrollment-counts-data-files/ - CEPI home: https://www.michigan.gov/cepi
Available Years
- Full range: 1996-2025 (30 school years)
-
Note: 2015 data uses
.xlsbformat which requires special handling
Collection Period
Michigan enrollment data is collected on Count Day, typically the first Wednesday in October (Fall Count) and the second Wednesday in February (Spring Count). This package uses Fall Count data.
Suppression Rules
CEPI suppresses (shows as blank/NA) student counts when: - Cell counts are less than 10 students for demographic breakdowns - The suppression is necessary to prevent identification of individual students
Known Data Quality Issues
Detroit restructuring (2016): Detroit City School District (82010) was restructured as Detroit Public Schools Community District (82015) in 2016. Historical analysis should account for this ID change.
2015 XLSB format gap: The 2014-15 school year data file uses
.xlsb(Excel Binary) format instead of.xlsx. Thereadxlpackage cannot read.xlsbfiles natively. Multi-year fetches that include 2015 (e.g.,fetch_enr_multi(2014:2016)) will skip this year. To include 2015 data, convert the file to.xlsxmanually or use a dedicated.xlsbreader.Charter school proliferation: Michigan has ~300 charter schools (PSAs - Public School Academies) which are counted as separate districts.
Schools of Choice: Inter-district enrollment means some students are counted in districts different from their residence.
Entity Levels
- State: Statewide totals
- District: 880+ traditional public school districts plus charter schools
- Building: 3,500+ individual schools
Deeper Dive
4. Statewide enrollment has been declining
Michigan has lost over 100,000 students since 2018 alone, reflecting demographic shifts and economic changes. The state peaked at around 1.7 million K-12 students and now serves approximately 1.4 million.
library(mischooldata)
library(dplyr)

enr <- fetch_enr_multi(2018:2025, use_cache = TRUE)

state <- enr %>%
  filter(is_state, subgroup == "total_enrollment", grade_level == "TOTAL") %>%
  select(end_year, n_students)
stopifnot(nrow(state) > 0)
state
#> # A tibble: 8 x 2
#>   end_year n_students
#>      <dbl>      <dbl>
#> 1     2018    1468256
#> 2     2019    1453135
#> 3     2020    1444313
#> 4     2021    1398455
#> 5     2022    1392700
#> 6     2023    1383889
#> 7     2024    1373686
#> 8     2025    1366207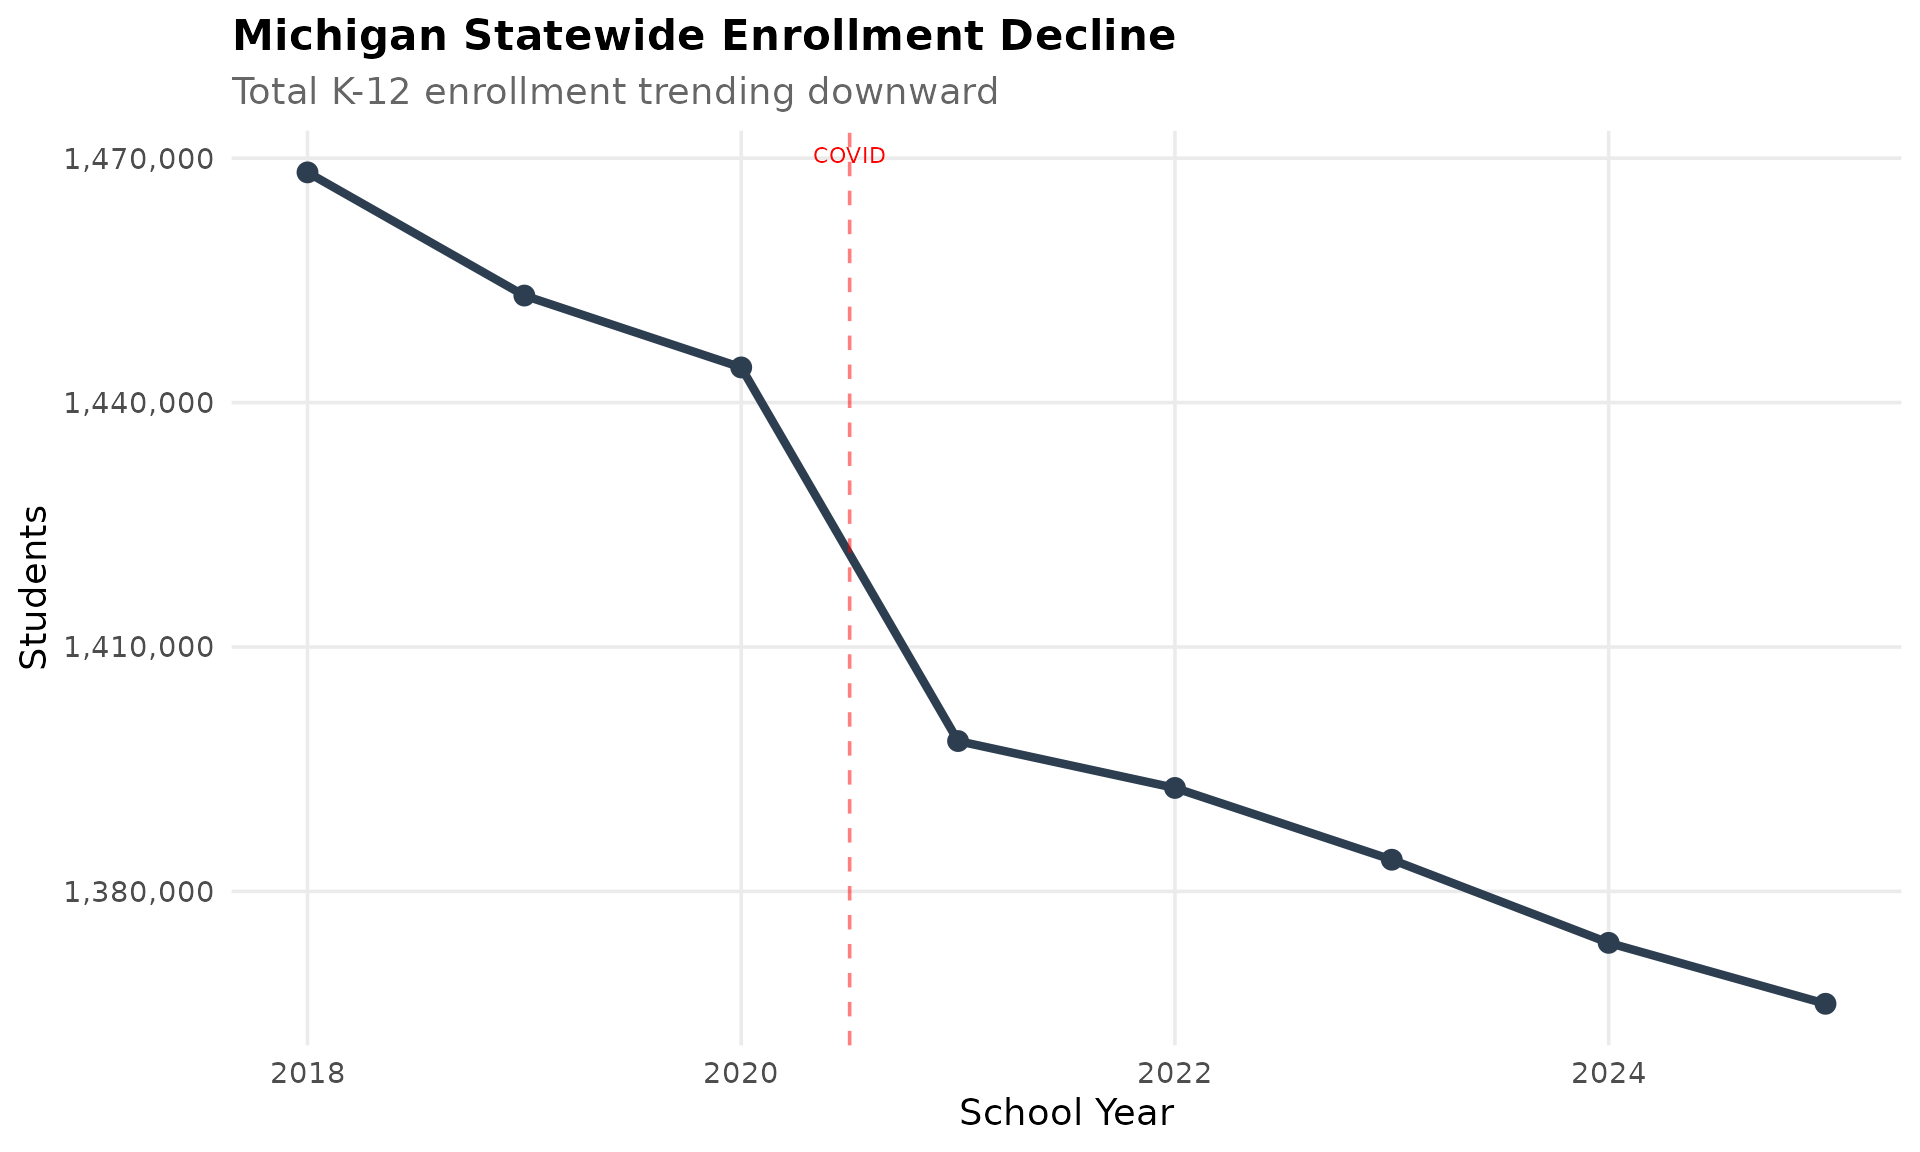
5. Grand Rapids is more diverse than you think
Michigan’s second-largest city has become majority-minority, with Hispanic enrollment growing fastest. Grand Rapids Public Schools now has 39.5% Hispanic, 30.1% Black, 22.1% White, and 1.0% Asian students.
library(mischooldata)
library(dplyr)

enr <- fetch_enr_multi(2018:2025, use_cache = TRUE)

gr <- enr %>%
  filter(is_district, district_name == "Grand Rapids Public Schools",
         grade_level == "TOTAL", end_year == 2025,
         subgroup %in% c("white", "black", "hispanic", "asian")) %>%
  select(subgroup, n_students, pct) %>%
  mutate(pct = round(pct * 100, 1))
stopifnot(nrow(gr) > 0)
gr
#> # A tibble: 4 x 3
#>   subgroup n_students   pct
#>   <chr>         <dbl> <dbl>
#> 1 white          2997  22.1
#> 2 black          4077  30.1
#> 3 hispanic       5359  39.5
#> 4 asian           141   1.0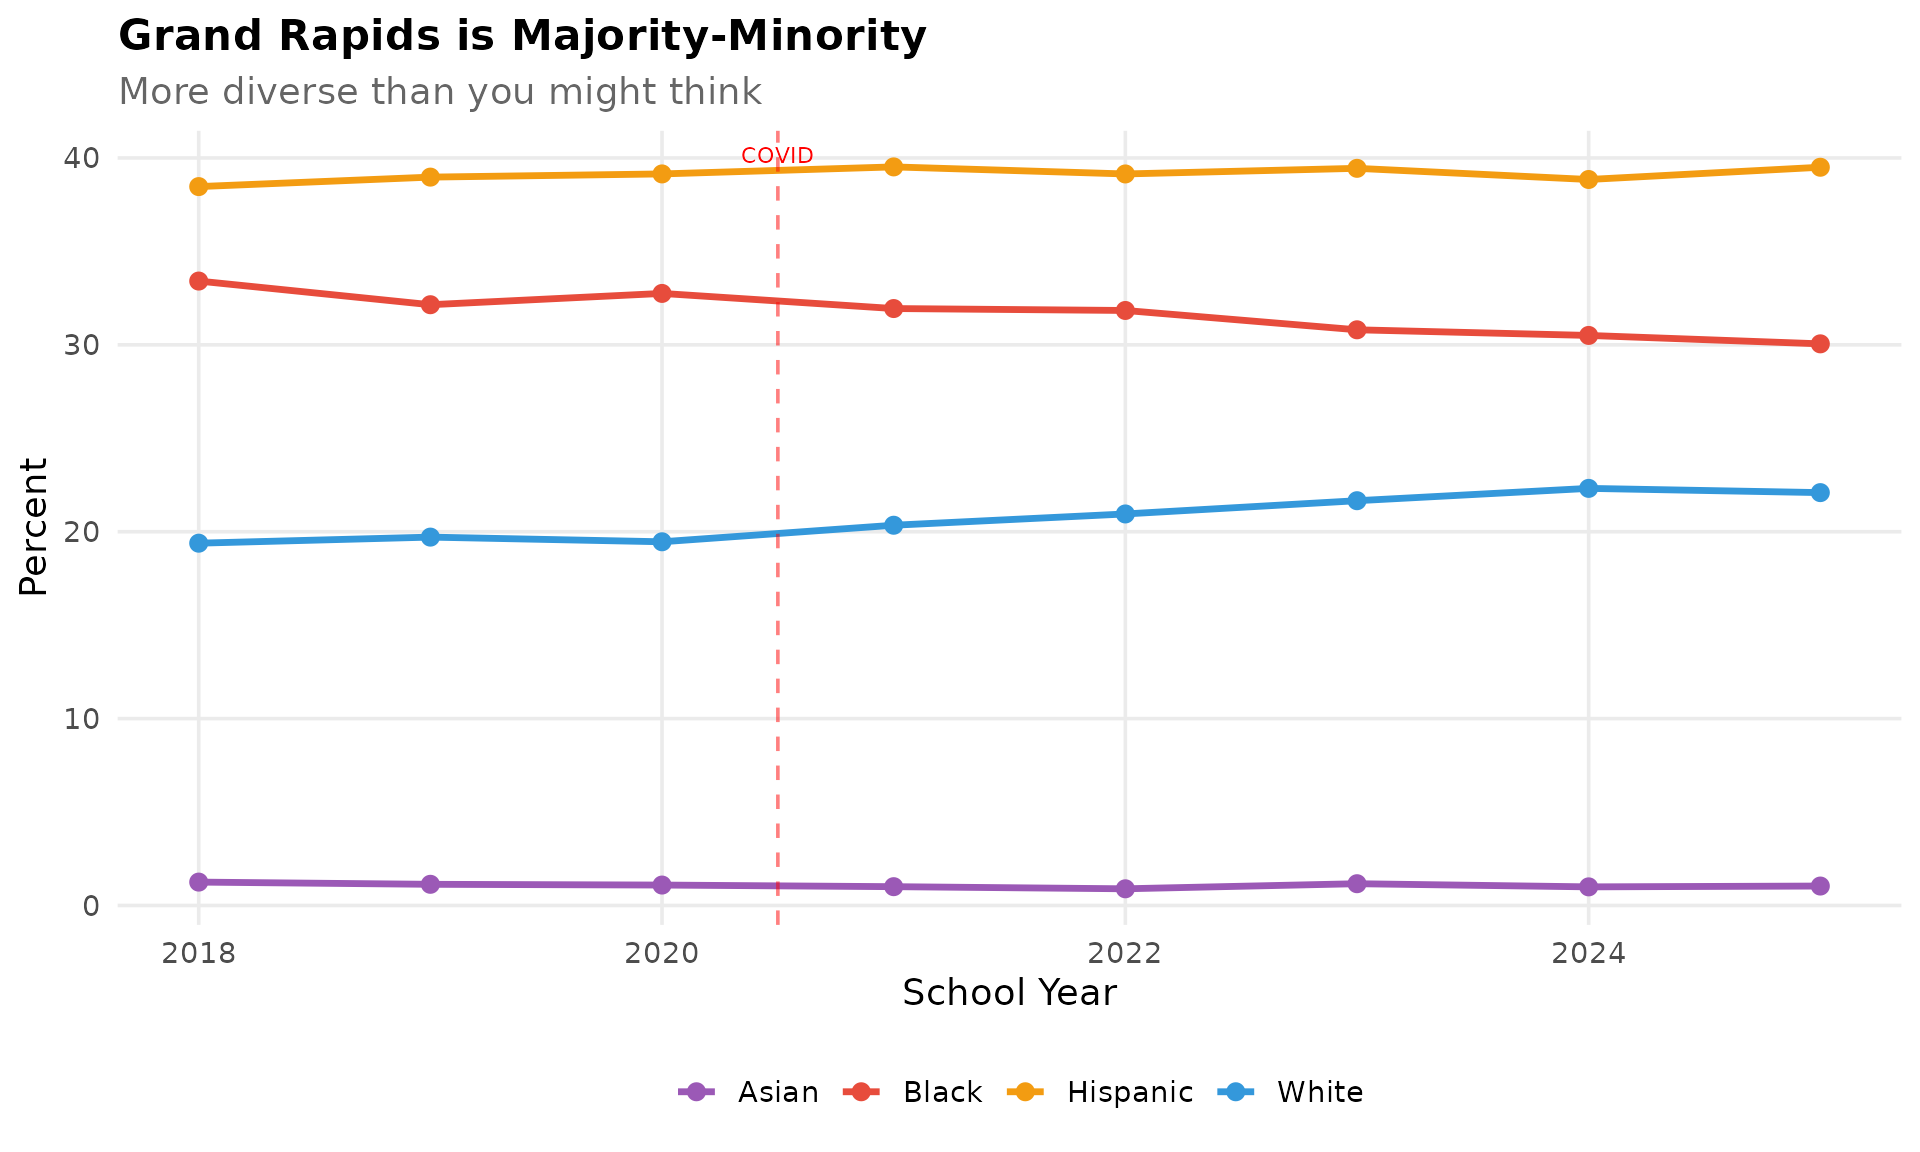
6. The Upper Peninsula is emptying out
UP districts have lost over 30% of students since 2000 as the region’s population ages and young families move south. Combined enrollment in Marquette, Houghton, Iron Mountain, and Menominee area districts dropped from 11,280 to 7,733.
library(mischooldata)
library(dplyr)

enr_long <- fetch_enr_multi(c(2000, 2005, 2010, 2020, 2025), use_cache = TRUE)

up_districts <- c("Marquette", "Houghton", "Iron Mountain", "Menominee")
up <- enr_long %>%
  filter(is_district, grepl(paste(up_districts, collapse = "|"), district_name, ignore.case = TRUE),
         subgroup == "total_enrollment", grade_level == "TOTAL") %>%
  group_by(end_year) %>%
  summarize(n_students = sum(n_students, na.rm = TRUE), .groups = "drop")
stopifnot(nrow(up) > 0)
up
#> # A tibble: 5 x 2
#>   end_year n_students
#>      <dbl>      <dbl>
#> 1     2000      11280
#> 2     2005      10250
#> 3     2010       9115
#> 4     2020       7975
#> 5     2025       7733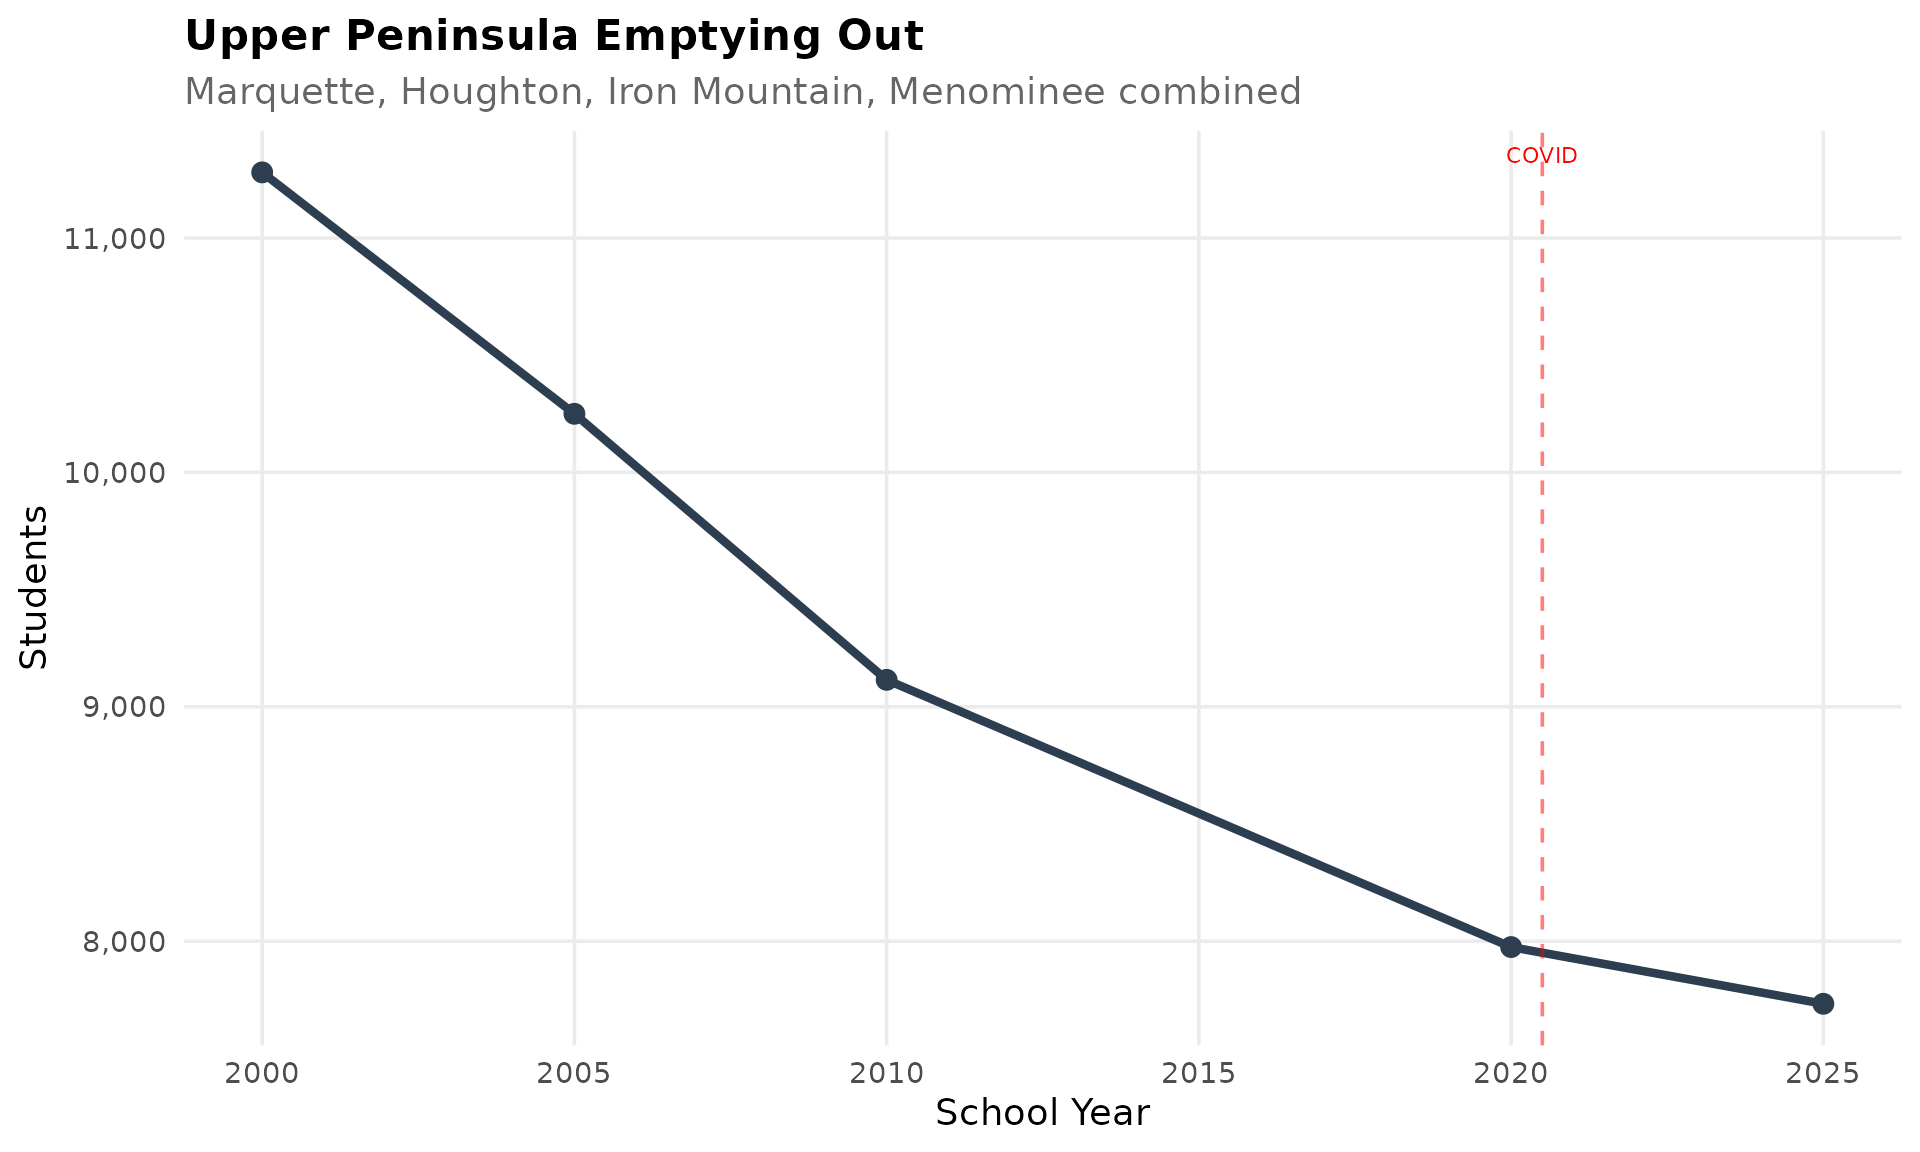
7. COVID hit kindergarten hard
Michigan lost nearly 14,000 kindergartners in 2021 (from 120,133 in 2020 to 106,539 in 2021) and hasn’t fully recovered. The pandemic disrupted the transition to formal schooling for thousands of Michigan families.
library(mischooldata)
library(dplyr)

enr <- fetch_enr_multi(2018:2025, use_cache = TRUE)

k_enr <- enr %>%
  filter(is_state, subgroup == "total_enrollment", grade_level == "K") %>%
  select(end_year, n_students)
stopifnot(nrow(k_enr) > 0)
k_enr
#> # A tibble: 8 x 2
#>   end_year n_students
#>      <dbl>      <dbl>
#> 1     2018     116636
#> 2     2019     117694
#> 3     2020     120133
#> 4     2021     106539
#> 5     2022     114744
#> 6     2023     113864
#> 7     2024     110738
#> 8     2025     108230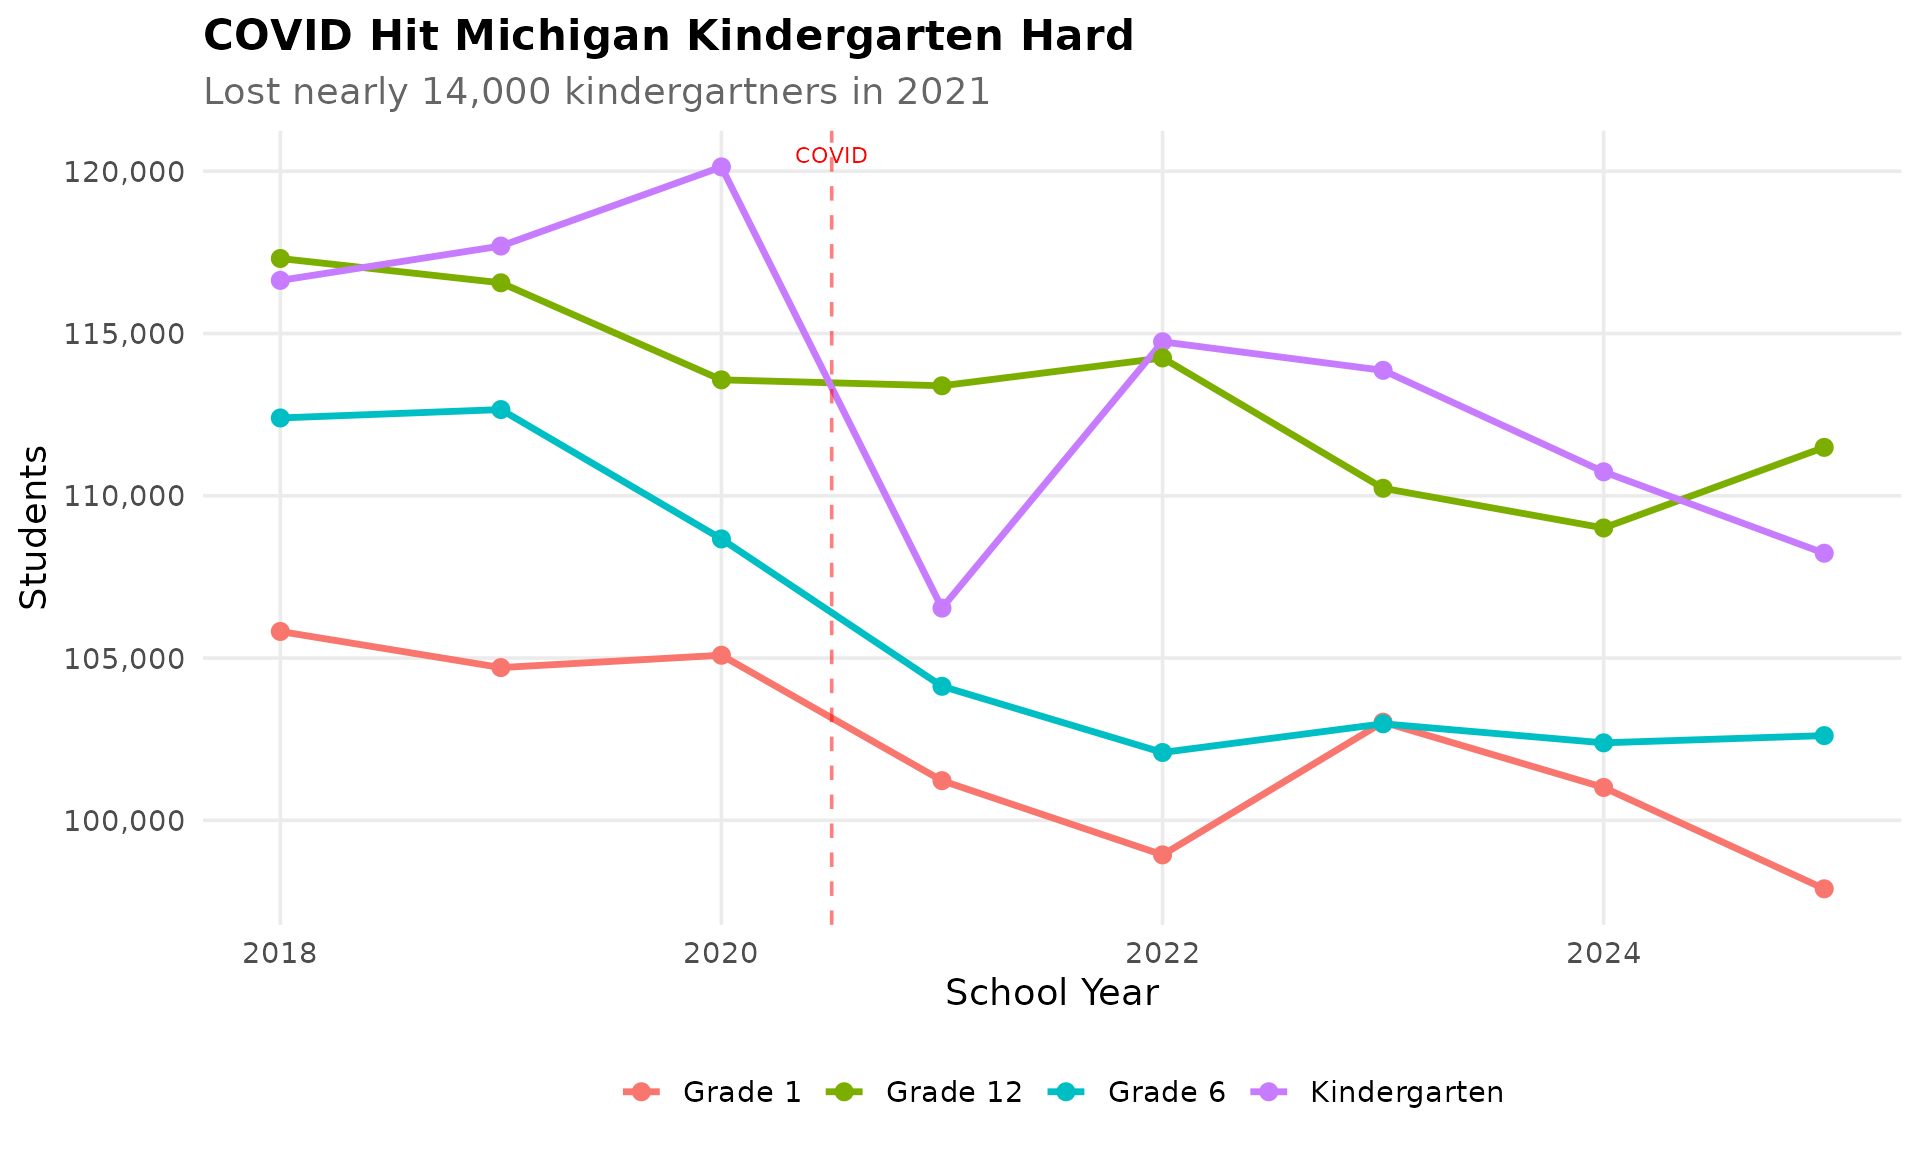
8. Ann Arbor: island of stability
While Detroit hemorrhages students, Ann Arbor Public Schools maintains around 16,800 students with high diversity. The university town’s economic stability and educated workforce create a different enrollment trajectory.
library(mischooldata)
library(dplyr)

enr <- fetch_enr_multi(2018:2025, use_cache = TRUE)

aa <- enr %>%
  filter(is_district, grepl("Ann Arbor Public Schools", district_name, ignore.case = TRUE),
         subgroup == "total_enrollment", grade_level == "TOTAL") %>%
  select(end_year, n_students)
stopifnot(nrow(aa) > 0)
aa
#> # A tibble: 8 x 2
#>   end_year n_students
#>      <dbl>      <dbl>
#> 1     2018      17669
#> 2     2019      17950
#> 3     2020      17942
#> 4     2021      17386
#> 5     2022      17016
#> 6     2023      16961
#> 7     2024      16918
#> 8     2025      16810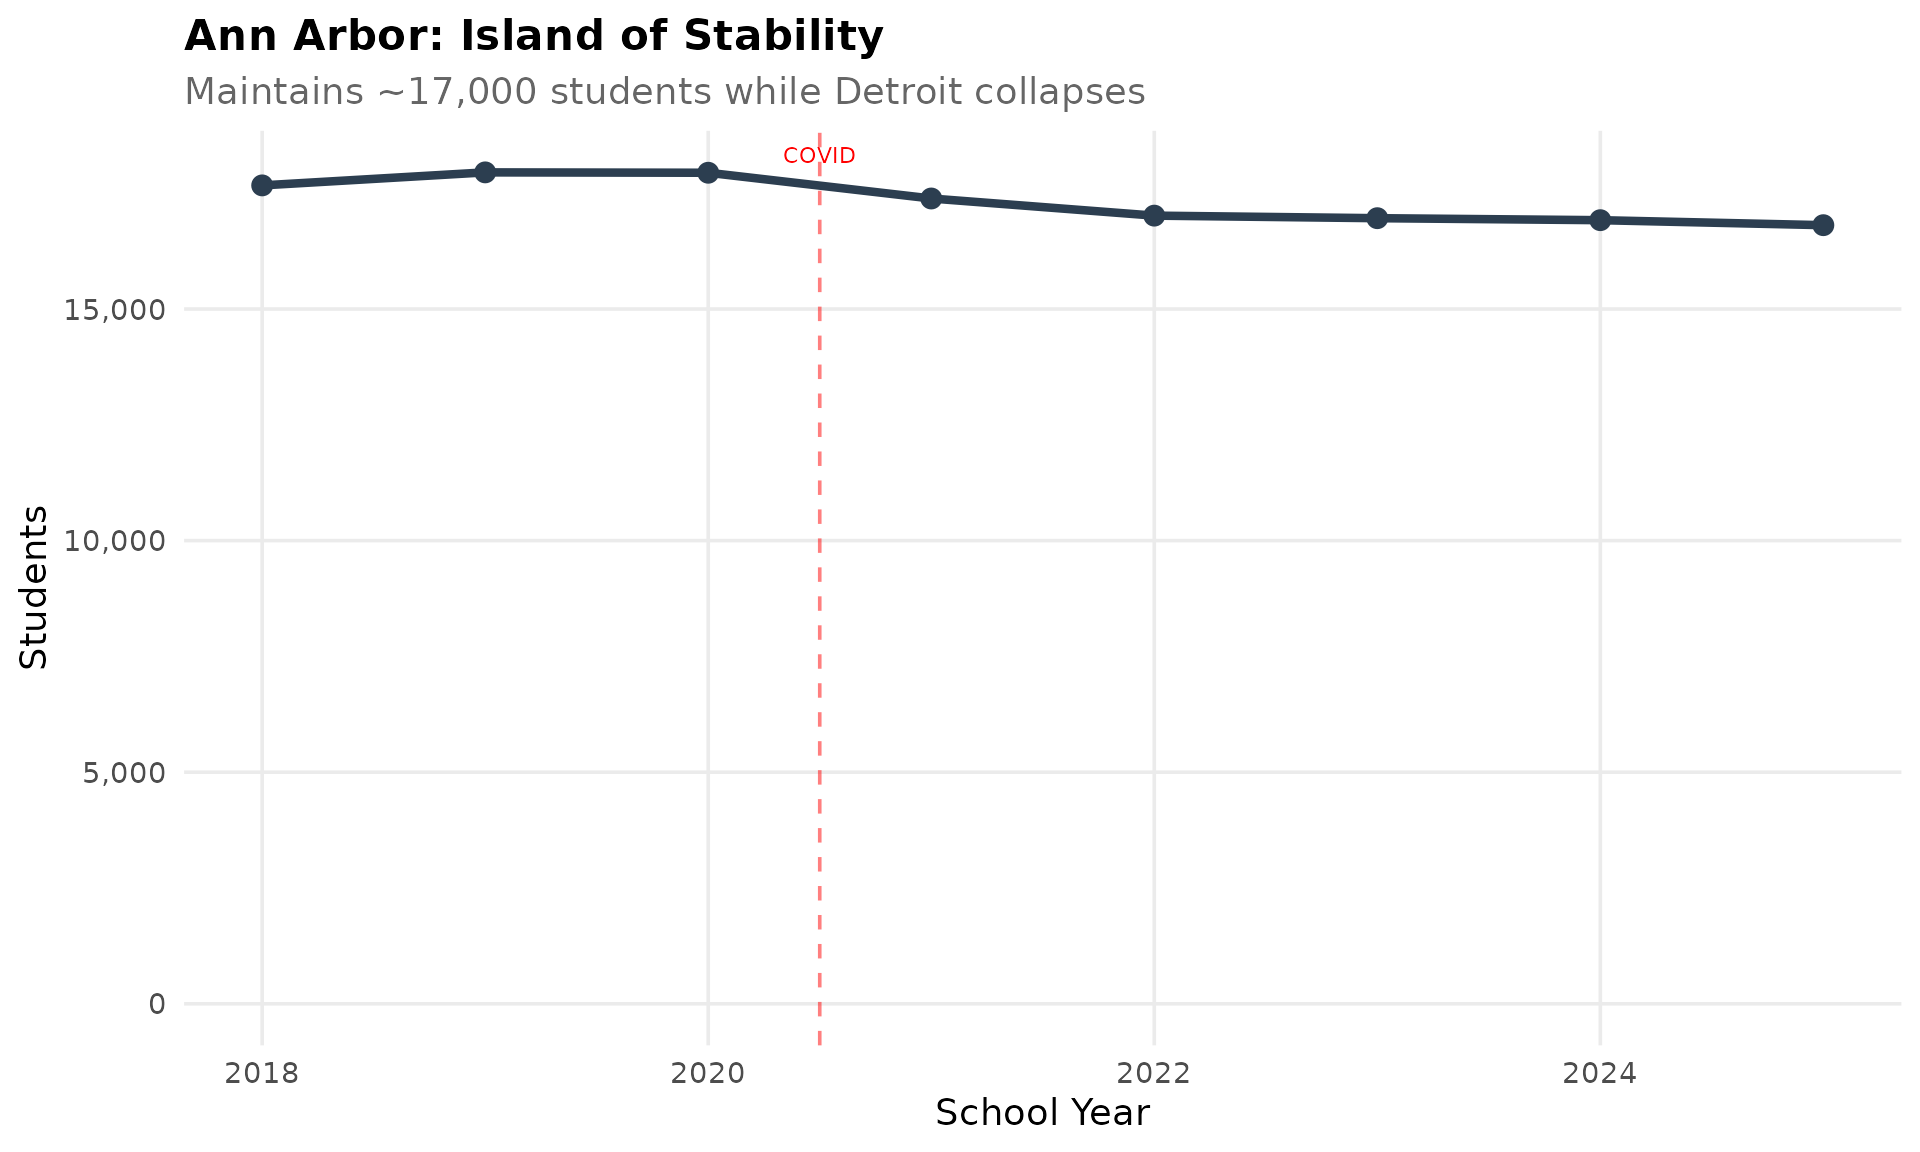
9. Largest districts by enrollment
The 10 largest districts represent a mix of urban, suburban, and diverse communities. Detroit remains the largest despite decades of decline, followed by suburban powerhouses like Utica and Dearborn.
library(mischooldata)
library(dplyr)

enr_current <- fetch_enr(2025, use_cache = TRUE)

largest <- enr_current %>%
  filter(is_district, subgroup == "total_enrollment", grade_level == "TOTAL") %>%
  arrange(desc(n_students)) %>%
  head(10) %>%
  select(district_name, n_students)
stopifnot(nrow(largest) > 0)
largest
#> # A tibble: 10 x 2
#>    district_name                            n_students
#>    <chr>                                         <dbl>
#>  1 Detroit Public Schools Community District     48117
#>  2 Utica Community Schools                       25092
#>  3 Dearborn City School District                 19168
#>  4 Ann Arbor Public Schools                      16810
#>  5 Plymouth-Canton Community Schools             15885
#>  6 Rochester Community School District           14592
#>  7 Chippewa Valley Schools                       14155
#>  8 Grand Rapids Public Schools                   13566
#>  9 Livonia Public Schools School District        12818
#> 10 Warren Consolidated Schools                   12421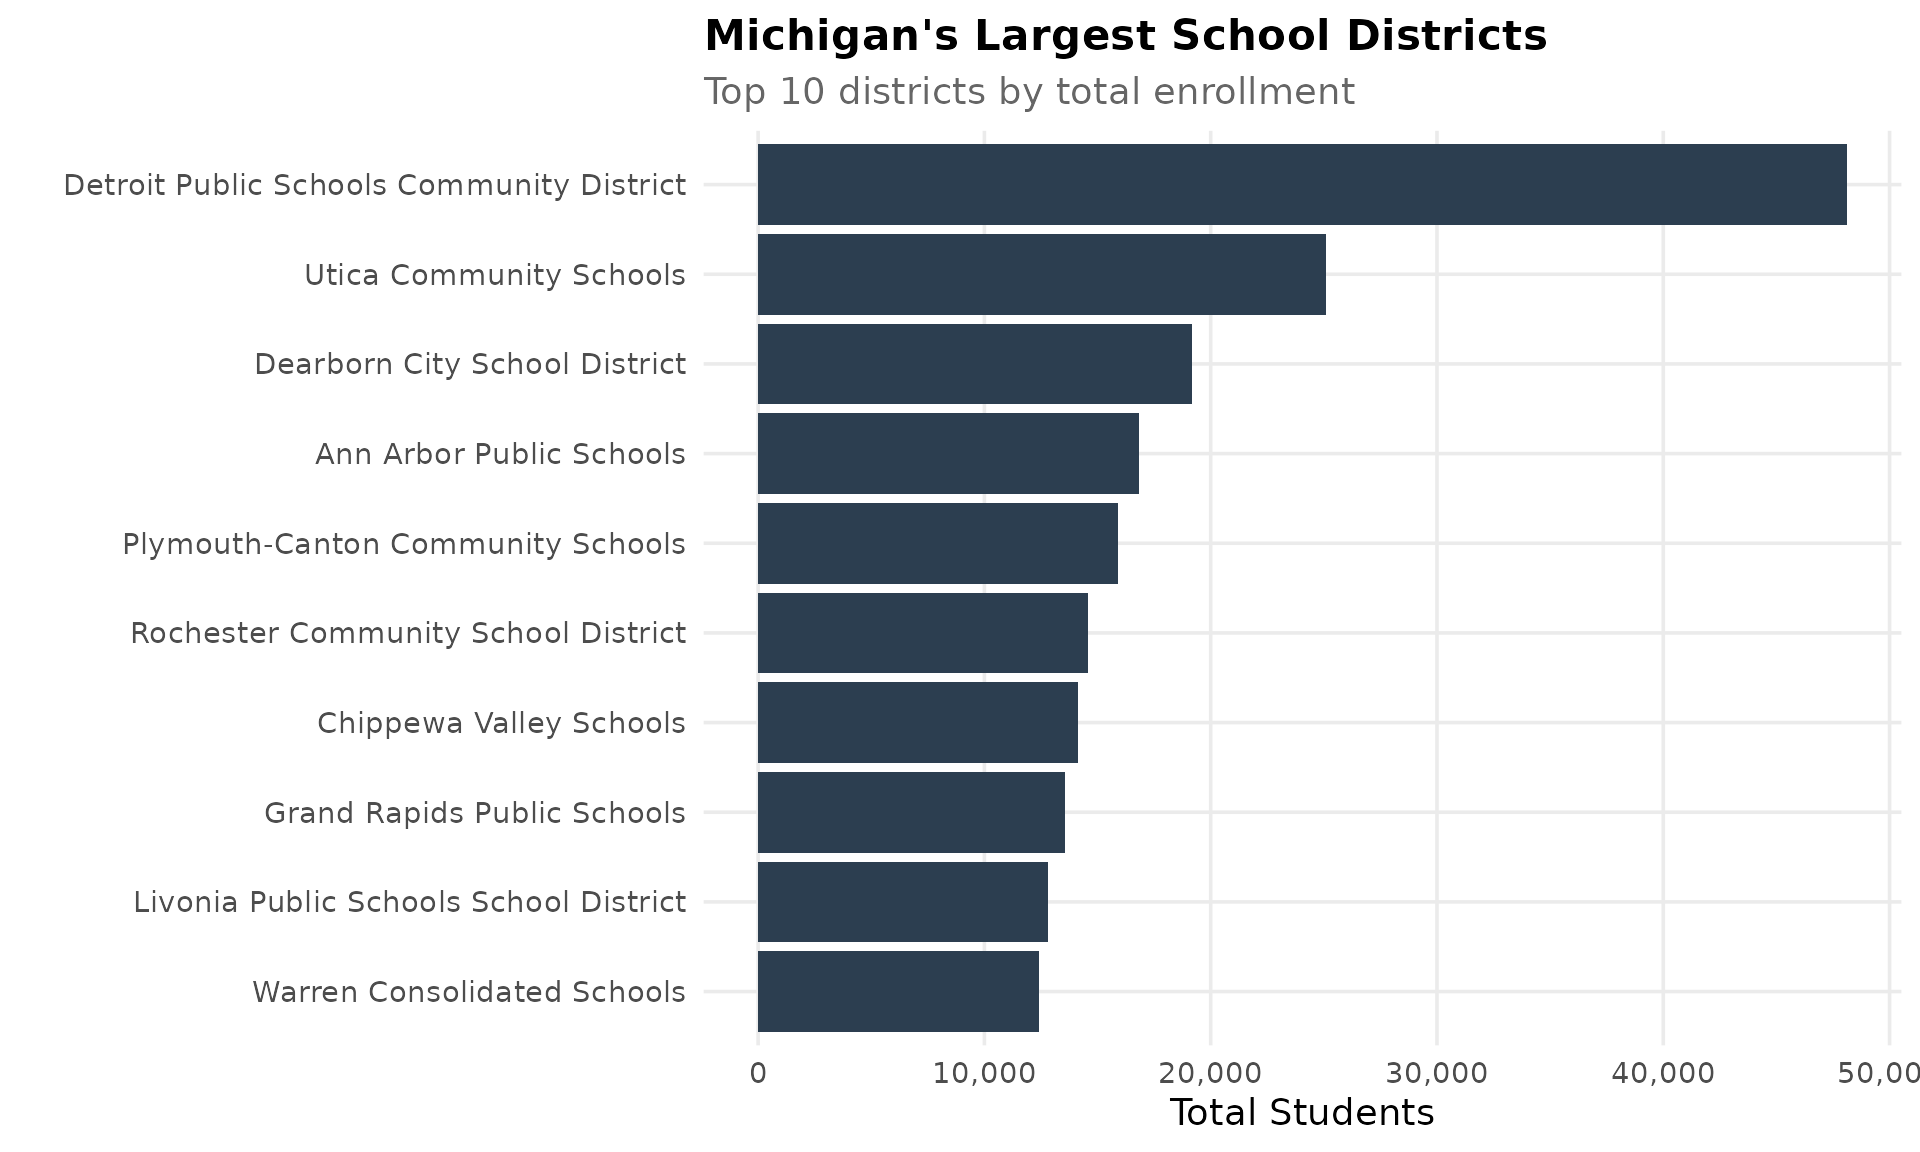
10. Oakland County suburbs holding
Oakland County districts like Troy, Rochester, Novi, and Farmington maintain strong enrollment while Detroit collapses. These affluent suburbs benefit from strong economies and excellent school reputations.
library(mischooldata)
library(dplyr)

enr <- fetch_enr_multi(2018:2025, use_cache = TRUE)

oakland <- c("Troy", "Rochester", "Novi", "Farmington")
oakland_2025 <- enr %>%
  filter(is_district, grepl(paste(oakland, collapse = "|"), district_name, ignore.case = TRUE),
         subgroup == "total_enrollment", grade_level == "TOTAL", end_year == 2025) %>%
  select(district_name, n_students) %>%
  arrange(desc(n_students))
stopifnot(nrow(oakland_2025) > 0)
oakland_2025
#> # A tibble: 4 x 2
#>   district_name                    n_students
#>   <chr>                                 <dbl>
#> 1 Rochester Community School District   14592
#> 2 Troy School District                  12128
#> 3 Farmington Public School District      8937
#> 4 Novi Community School District         6722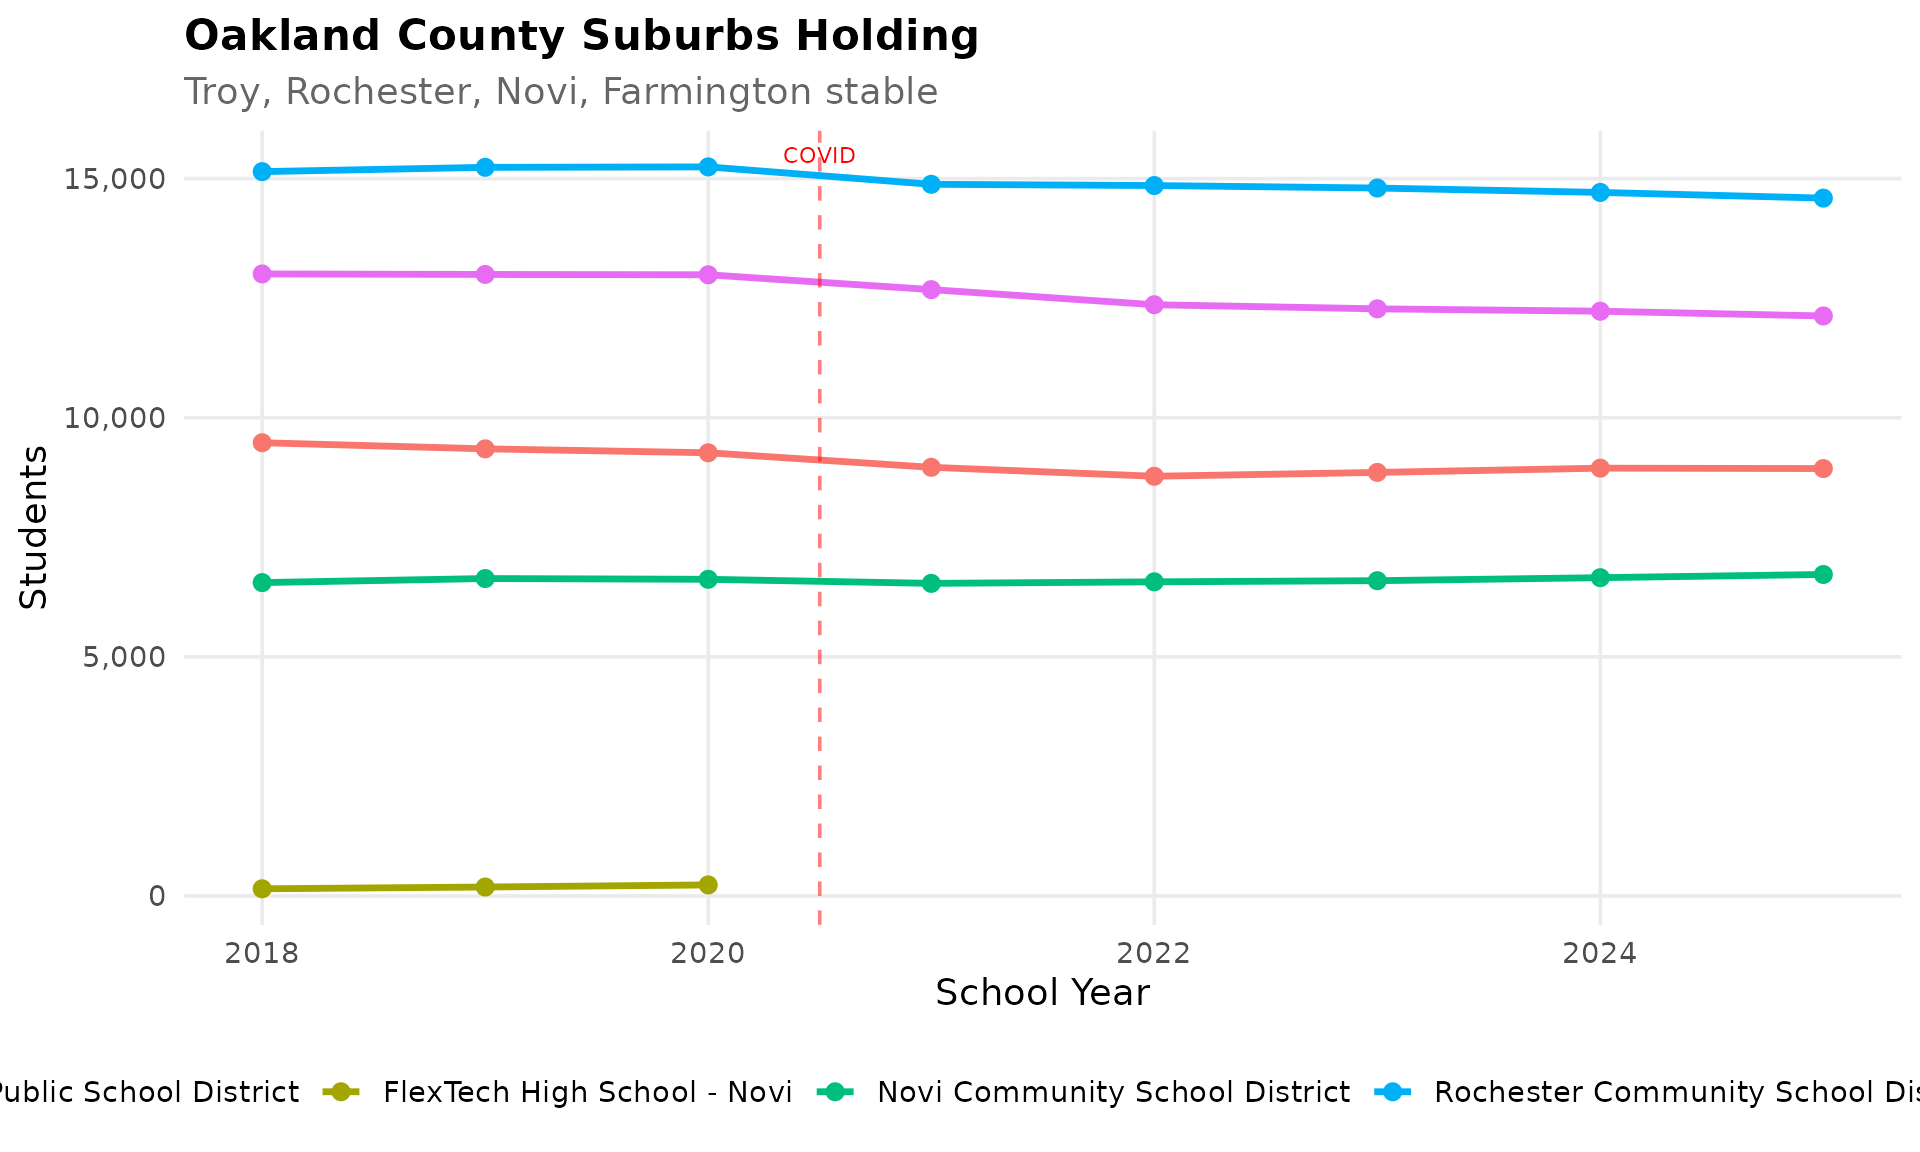
11. Dearborn: Arab American educational hub
Dearborn City School District serves one of the largest Arab American communities in the nation with 19,168 students. The district maintains stable enrollment with a unique demographic profile.
library(mischooldata)
library(dplyr)

enr <- fetch_enr_multi(2018:2025, use_cache = TRUE)

dearborn <- enr %>%
  filter(is_district, grepl("Dearborn City", district_name, ignore.case = TRUE),
         subgroup == "total_enrollment", grade_level == "TOTAL") %>%
  select(end_year, n_students)
stopifnot(nrow(dearborn) > 0)
dearborn
#> # A tibble: 8 x 2
#>   end_year n_students
#>      <dbl>      <dbl>
#> 1     2018      20798
#> 2     2019      20629
#> 3     2020      20535
#> 4     2021      20334
#> 5     2022      20045
#> 6     2023      20013
#> 7     2024      19524
#> 8     2025      19168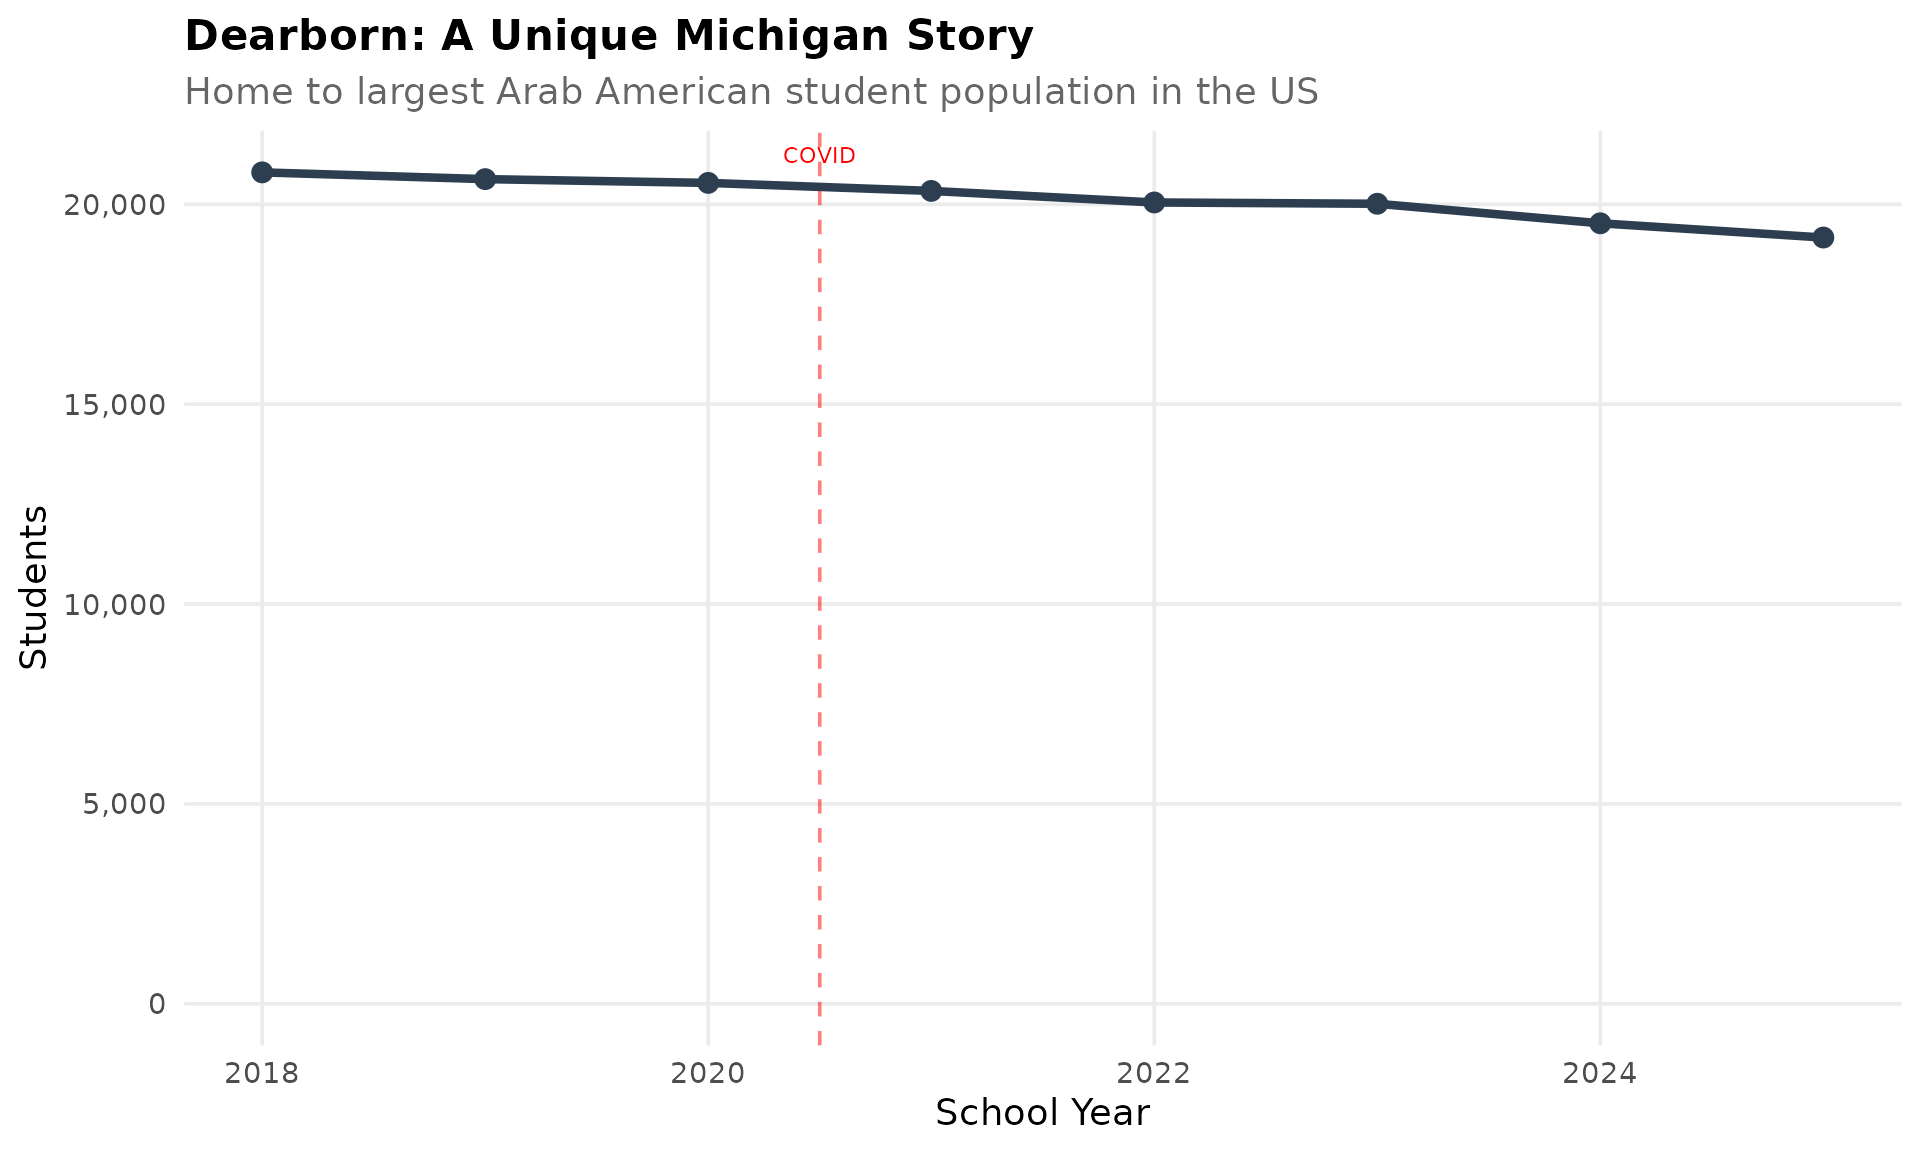
12. Black student enrollment declining
Black student enrollment in Michigan has declined from 260,423 in 2018 to 246,009 in 2025, driven primarily by Detroit’s collapse. This demographic shift is reshaping the state’s educational landscape.
library(mischooldata)
library(dplyr)

enr <- fetch_enr_multi(2018:2025, use_cache = TRUE)

black_state <- enr %>%
  filter(is_state, subgroup == "black", grade_level == "TOTAL") %>%
  select(end_year, n_students)
stopifnot(nrow(black_state) > 0)
black_state
#> # A tibble: 8 x 2
#>   end_year n_students
#>      <dbl>      <dbl>
#> 1     2018     260423
#> 2     2019     256379
#> 3     2020     255296
#> 4     2021     246583
#> 5     2022     246831
#> 6     2023     246629
#> 7     2024     245569
#> 8     2025     246009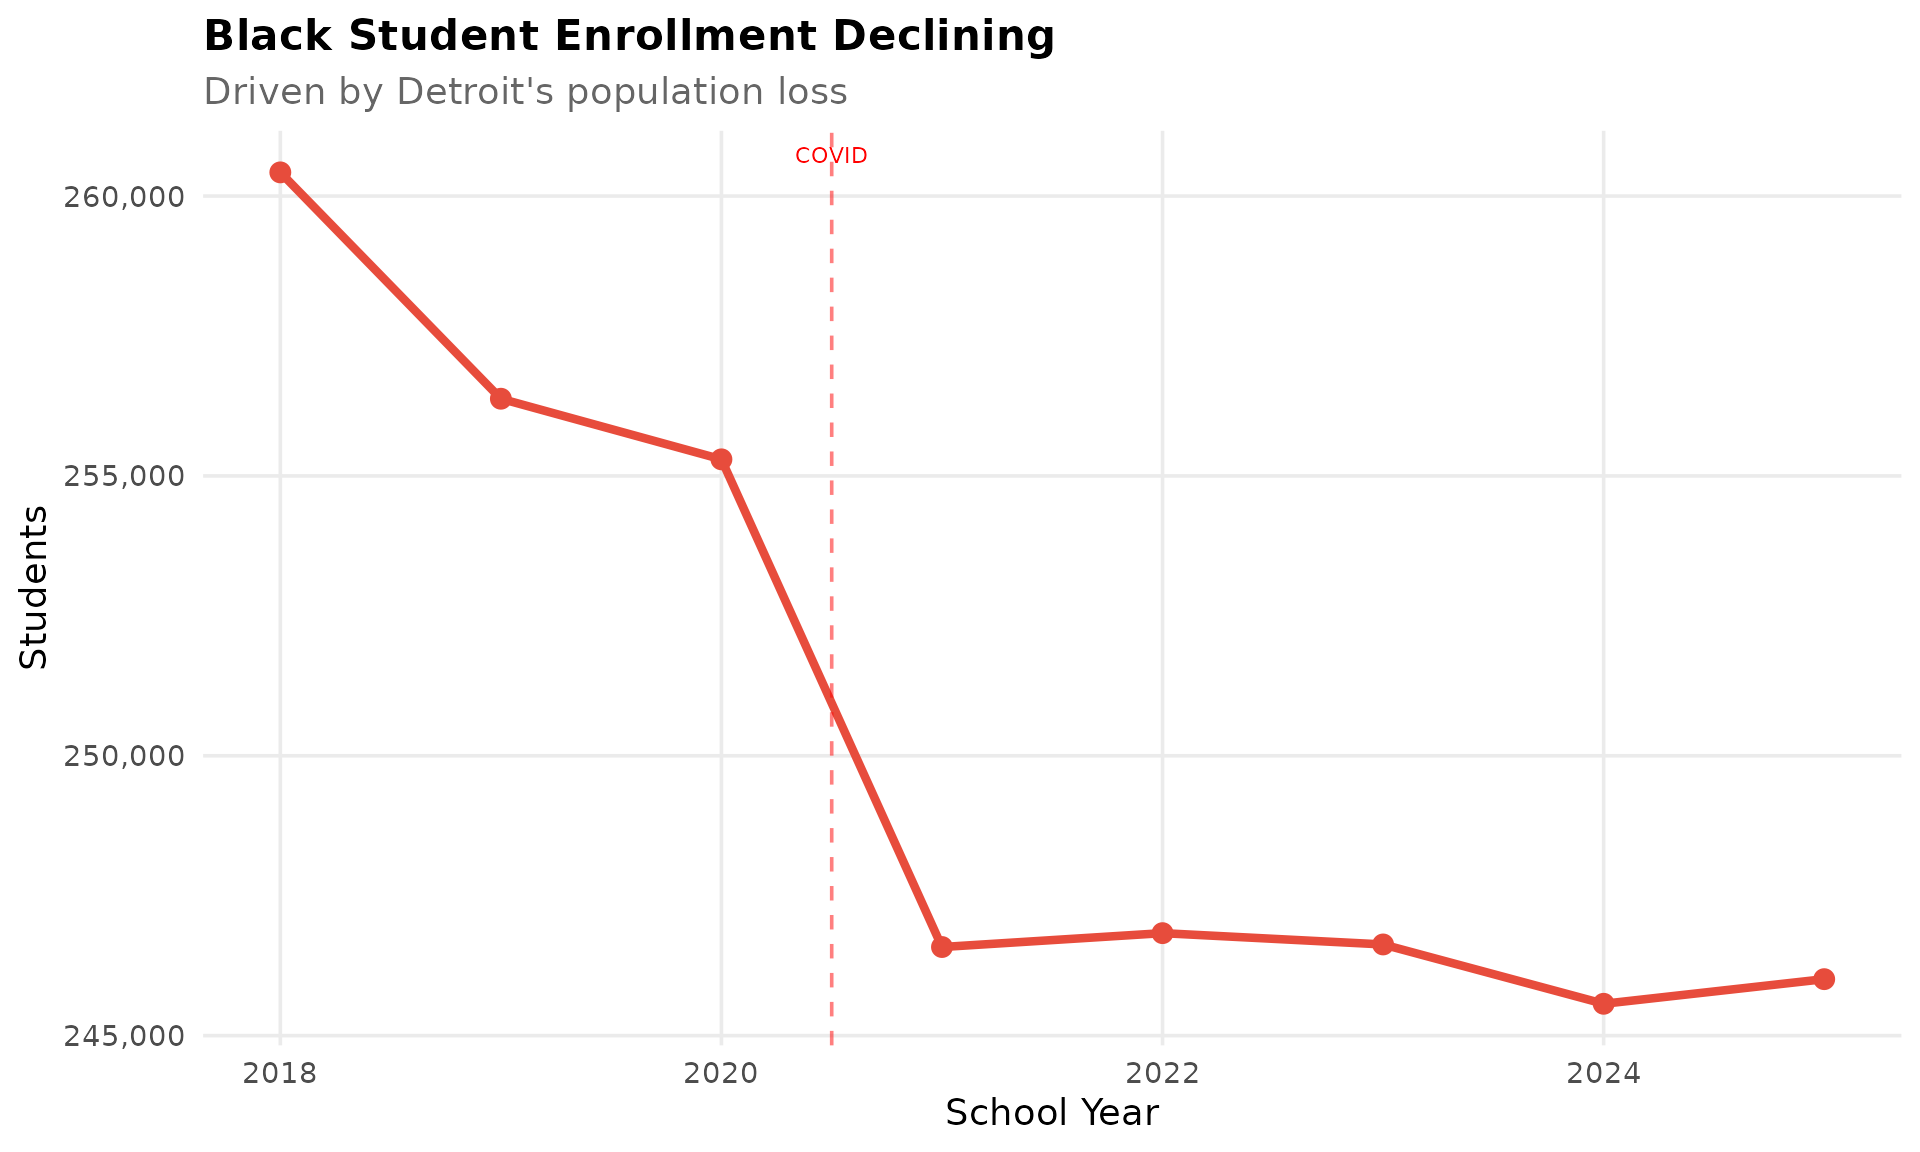
13. Lansing bucking the urban decline
Unlike Detroit and Flint, Lansing Public School District has maintained relatively stable enrollment around 10,000 students. The state capital’s diverse economy and state government employment provide a buffer.
library(mischooldata)
library(dplyr)

enr <- fetch_enr_multi(2018:2025, use_cache = TRUE)

lansing <- enr %>%
  filter(is_district, grepl("Lansing Public School District", district_name, ignore.case = TRUE),
         subgroup == "total_enrollment", grade_level == "TOTAL") %>%
  select(end_year, n_students)
stopifnot(nrow(lansing) > 0)
lansing
#> # A tibble: 8 x 2
#>   end_year n_students
#>      <dbl>      <dbl>
#> 1     2018      10641
#> 2     2019      10462
#> 3     2020      10440
#> 4     2021       9862
#> 5     2022      10015
#> 6     2023       9866
#> 7     2024      10022
#> 8     2025       9808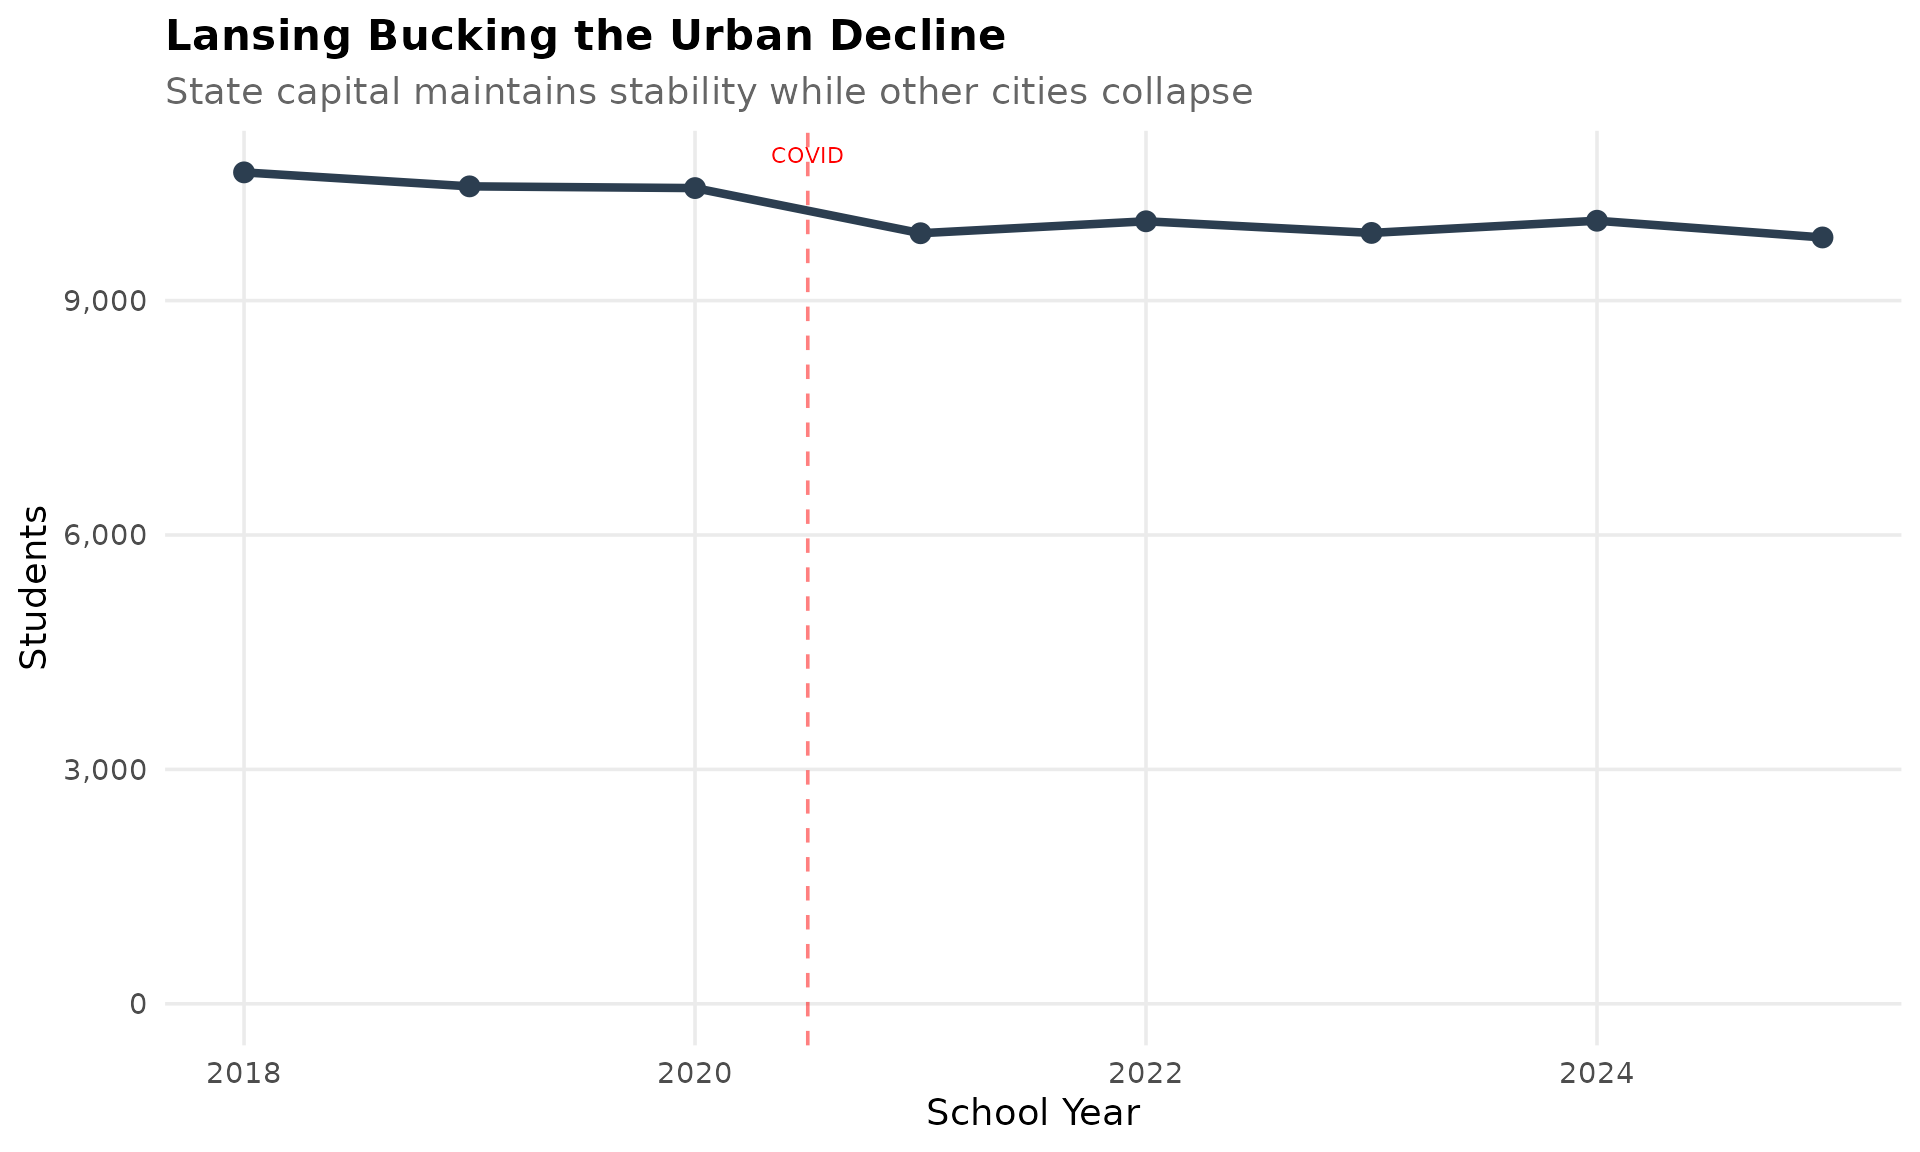
14. High school enrollment shrinking faster
High school grades are shrinking faster than elementary grades statewide, as the birth rate decline from the 2008 recession reaches secondary schools. Elementary (K-5) dropped from 652,006 to 615,754 (-5.6%) while high school (9-12) dropped from 477,489 to 440,089 (-7.8%).
library(mischooldata)
library(dplyr)

enr <- fetch_enr_multi(2018:2025, use_cache = TRUE)

grade_bands <- enr %>%
  filter(is_state, subgroup == "total_enrollment",
         grade_level %in% c("K", "01", "02", "03", "04", "05",
                            "09", "10", "11", "12")) %>%
  mutate(level = ifelse(grade_level %in% c("K", "01", "02", "03", "04", "05"),
                        "Elementary (K-5)", "High School (9-12)")) %>%
  group_by(end_year, level) %>%
  summarize(n_students = sum(n_students, na.rm = TRUE), .groups = "drop") %>%
  filter(end_year %in% c(2018, 2025))
stopifnot(nrow(grade_bands) > 0)
grade_bands
#> # A tibble: 4 x 3
#>   end_year level              n_students
#>      <dbl> <chr>                   <dbl>
#> 1     2018 Elementary (K-5)       652006
#> 2     2018 High School (9-12)     477489
#> 3     2025 Elementary (K-5)       615754
#> 4     2025 High School (9-12)     440089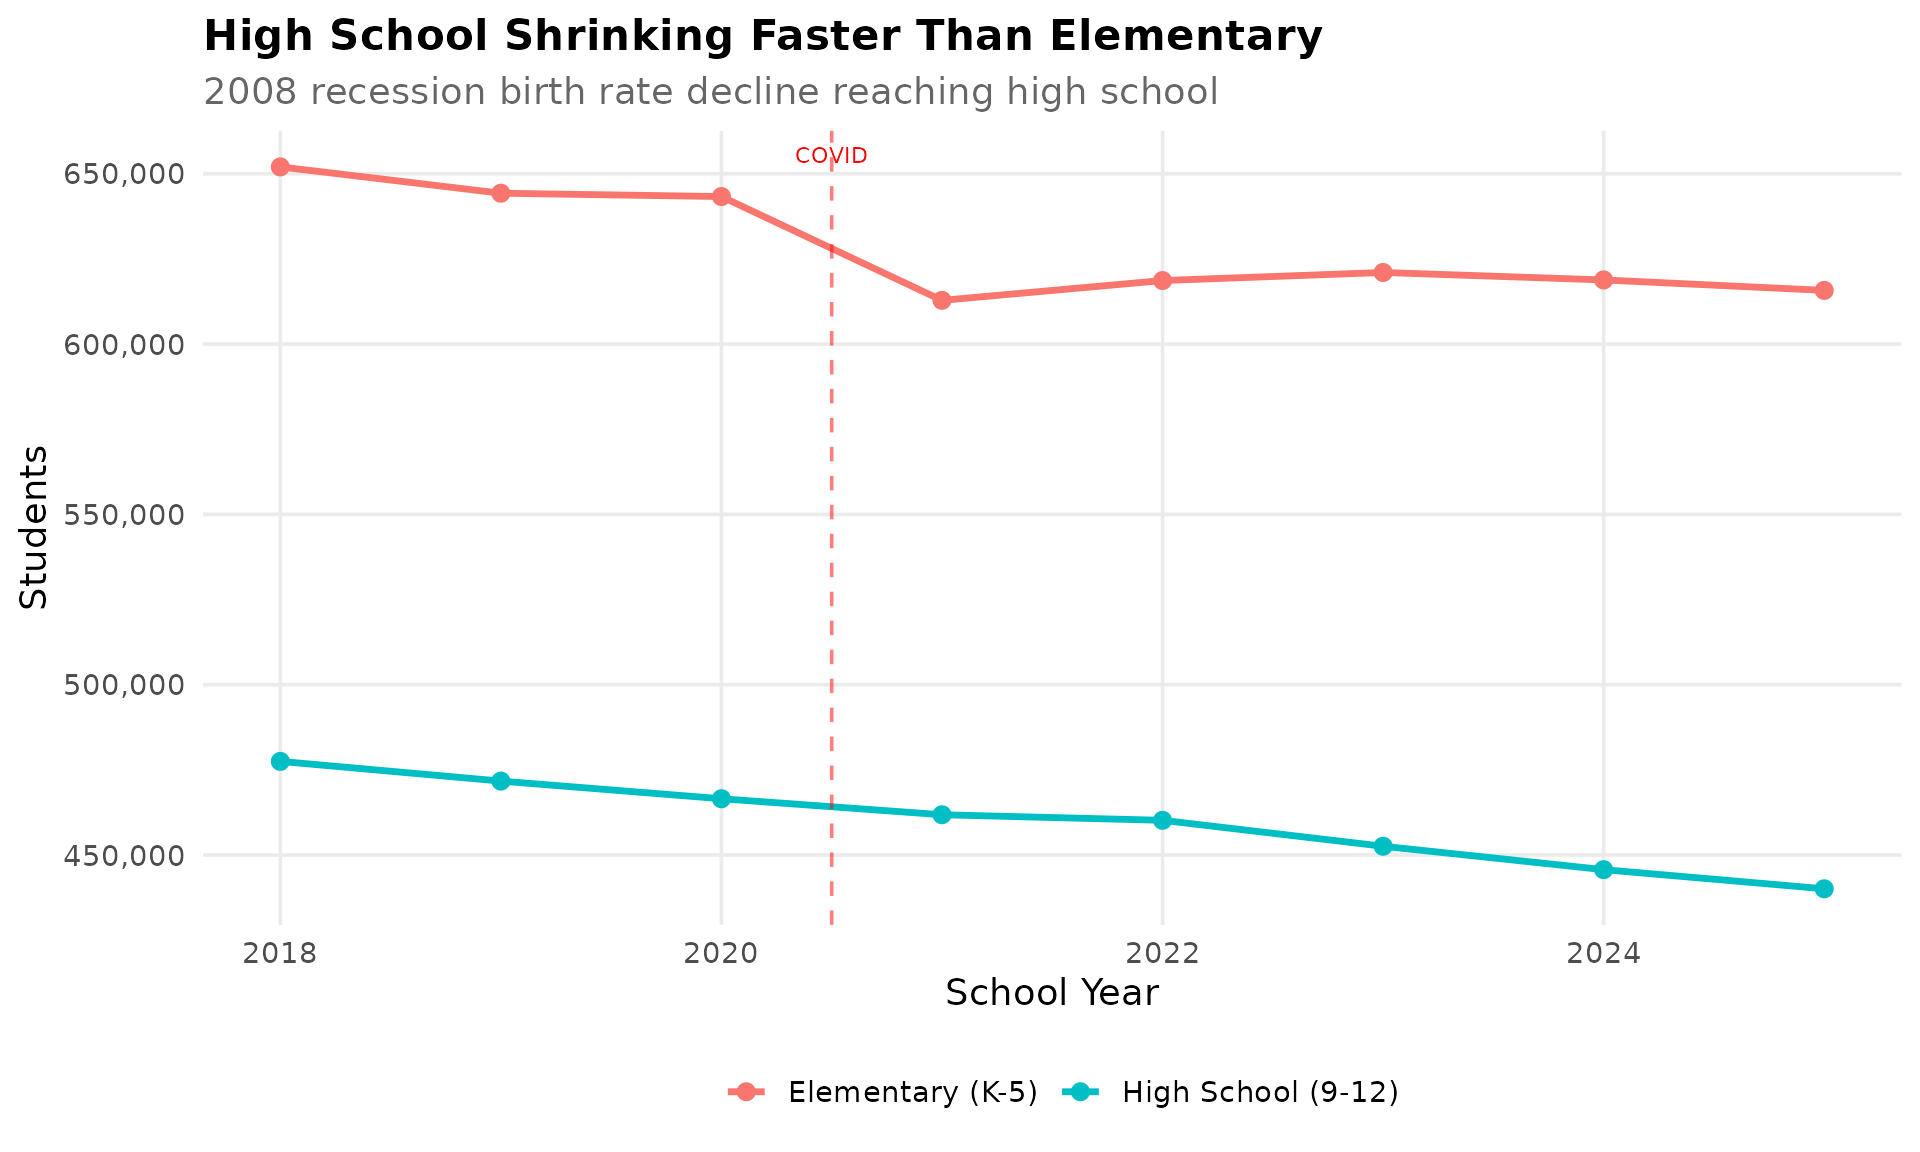
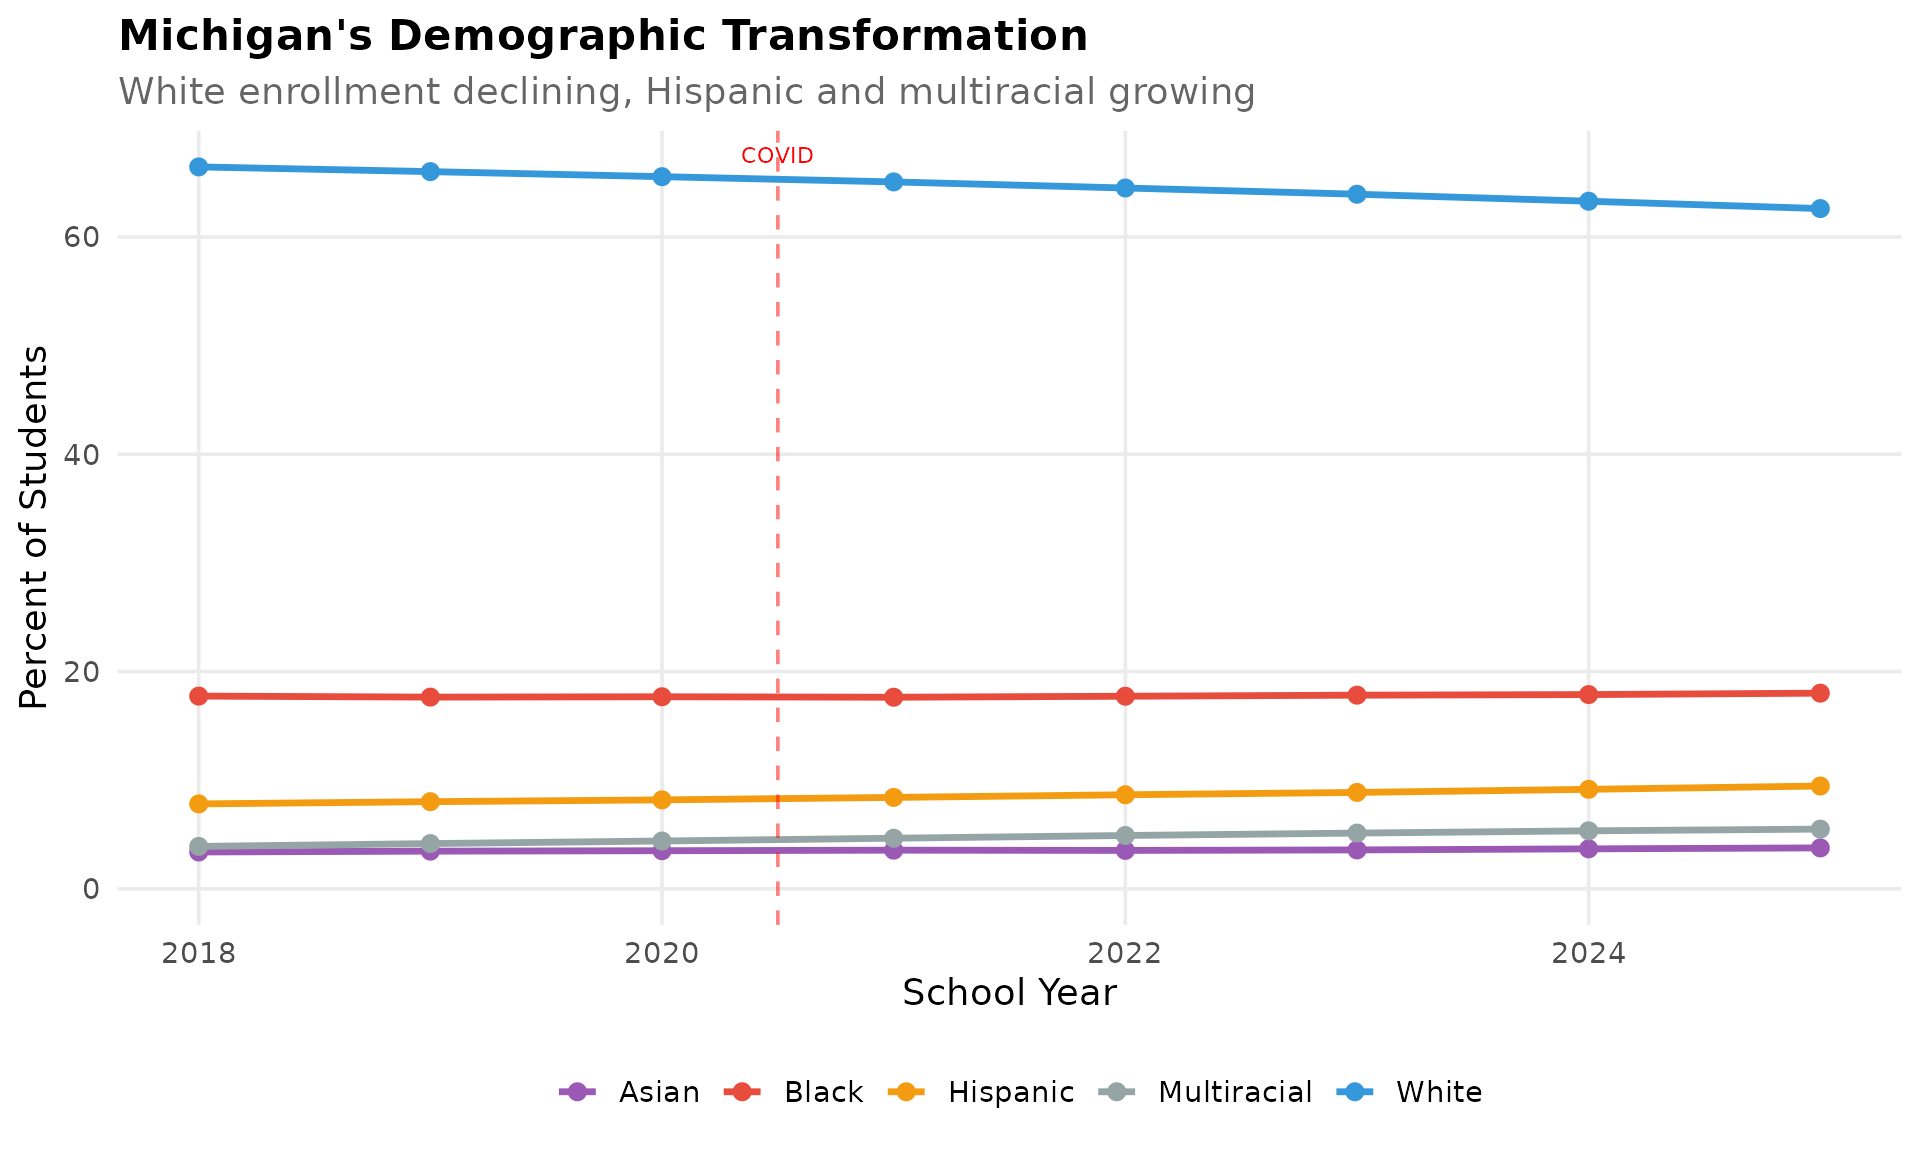
15. Demographic transformation: Michigan’s changing face
Michigan’s racial demographics are shifting. White students now make up 62.6% (855,383), Black 18.0% (246,009), Hispanic 9.5% (129,236), Multiracial 5.5% (75,055), and Asian 3.8% (51,423).
library(mischooldata)
library(dplyr)

enr <- fetch_enr_multi(2018:2025, use_cache = TRUE)

demo_state <- enr %>%
  filter(is_state, grade_level == "TOTAL", end_year == 2025,
         subgroup %in% c("white", "black", "hispanic", "asian", "multiracial")) %>%
  select(subgroup, n_students, pct) %>%
  mutate(pct = round(pct * 100, 1)) %>%
  arrange(desc(n_students))
stopifnot(nrow(demo_state) > 0)
demo_state
#> # A tibble: 5 x 3
#>   subgroup    n_students   pct
#>   <chr>            <dbl> <dbl>
#> 1 white           855383  62.6
#> 2 black           246009  18.0
#> 3 hispanic        129236   9.5
#> 4 multiracial      75055   5.5
#> 5 asian            51423   3.8