Mississippi’s education landscape tells a unique story – from the demographic patterns of the Delta to the suburban stability around Jackson and Memphis. 20 years of enrollment data (2007-2026). 437,000 students. 144 districts.
Part of the njschooldata family.
Full documentation – all 14 stories with interactive charts, getting-started guide, and complete function reference.
Highlights
library(msschooldata)
library(ggplot2)
library(dplyr)
library(scales)

years <- get_available_years()
max_year <- max(years)
min_year <- min(years)

# Key years for long-term trend (only years with cached data)
key_years <- c(2007, 2010, 2012, 2013, 2016:max_year)

enr_long <- fetch_enr_multi(key_years, use_cache = TRUE)

enr <- fetch_enr_multi(2016:max_year, use_cache = TRUE)

enr_current <- fetch_enr(2024, use_cache = TRUE)
1. Mississippi is majority Black in many districts
Unlike most Southern states, Mississippi has numerous majority-Black school districts, especially in the Delta region.
black <- enr_current %>%
  filter(is_district, subgroup == "black", grade_level == "TOTAL") %>%
  arrange(desc(pct)) %>%
  head(10) %>%
  mutate(district_label = reorder(district_name, pct))

stopifnot(nrow(black) > 0)

black %>% select(district_name, pct) %>% mutate(pct = round(pct * 100, 1))
#>                               district_name  pct
#> 1          Jefferson County School District 99.2
#> 2                      Ambition Preparatory 98.9
#> 3                               Smilow Prep 98.8
#> 4          Claiborne County School District 98.6
#> 5                Hollandale School District 98.5
#> 6         West Tallahatchie School District 98.3
#> 7       Holmes Consolidated School District 98.2
#> 8  East Jasper Consolidated School District 98.2
#> 9               South Delta School District 98.1
#> 10     Yazoo City Municipal School District 98.0
2. Jackson Public Schools’ steep decline
Mississippi’s capital city has lost 44% of students since 2007, from 32,000 to under 18,000.
jackson <- enr %>%
  filter(is_district, grepl("Jackson Public", district_name, ignore.case = TRUE),
         subgroup == "total_enrollment", grade_level == "TOTAL")

stopifnot(nrow(jackson) > 0)

jackson %>% select(end_year, district_name, n_students)
#>   end_year                  district_name n_students
#> 1     2016 Jackson Public School District      28019
#> 2     2017 Jackson Public School District      26948
#> 3     2018 Jackson Public School District      25595
#> 4     2019 Jackson Public School District      23935
#> 5     2020 Jackson Public School District      22510
#> 6     2021 Jackson Public School District      20401
#> 7     2022 Jackson Public School District      19348
#> 8     2023 Jackson Public School District      18710
#> 9     2024 Jackson Public School District      17747
3. Mississippi lost 50,000 students in a decade
State enrollment dropped from 487,000 in 2016 to 437,000 in 2024, a 10% decline.
state_trend <- enr %>%
  filter(is_state, subgroup == "total_enrollment", grade_level == "TOTAL")

stopifnot(nrow(state_trend) > 0)

state_trend %>% select(end_year, n_students)
#>   end_year n_students
#> 1     2016     487195
#> 2     2017     482991
#> 3     2018     477954
#> 4     2019     471246
#> 5     2020     465959
#> 6     2021     442569
#> 7     2022     441988
#> 8     2023     440285
#> 9     2024     436514
Data Taxonomy
| Category | Years | Function | Details |
|---|---|---|---|
| Enrollment | 2007-2026 |
fetch_enr() / fetch_enr_multi()
|
State, district, school. Race, gender |
| Assessments | – | – | Not yet available |
| Graduation | – | – | Not yet available |
| Directory | 2017-2024 | fetch_directory() |
State, district, school. Contact info, addresses, accountability grades, coordinates |
| Per-Pupil Spending | – | – | Not yet available |
| Accountability | – | – | Not yet available |
| Chronic Absence | – | – | Not yet available |
| EL Progress | – | – | Not yet available |
| Special Ed | – | – | Not yet available |
See the full data category taxonomy
Quick Start
R
# install.packages("remotes")
remotes::install_github("almartin82/msschooldata")

library(msschooldata)
library(dplyr)

# Fetch one year
enr_2024 <- fetch_enr(2024)

# Fetch multiple years
enr_multi <- fetch_enr_multi(2020:2024)

# State totals
enr_2024 %>%
  filter(is_state, subgroup == "total_enrollment", grade_level == "TOTAL")

# Largest districts
enr_2024 %>%
  filter(is_district, subgroup == "total_enrollment", grade_level == "TOTAL") %>%
  arrange(desc(n_students)) %>%
  head(15)

# Jackson demographics
enr_2024 %>%
  filter(grepl("Jackson Public", district_name), grade_level == "TOTAL",
         subgroup %in% c("white", "black", "hispanic", "asian")) %>%
  select(subgroup, n_students, pct)
Python
import pymsschooldata as ms

# Check available years
years = ms.get_available_years()
print(f"Data available from {years['min_year']} to {years['max_year']}")

# Fetch one year
enr_2024 = ms.fetch_enr(2024)

# Fetch multiple years
enr_multi = ms.fetch_enr_multi([2020, 2021, 2022, 2023, 2024])

# State totals
state_total = enr_2024[
    (enr_2024['is_state'] == True) &
    (enr_2024['subgroup'] == 'total_enrollment') &
    (enr_2024['grade_level'] == 'TOTAL')
]

# Largest districts
districts = enr_2024[
    (enr_2024['is_district'] == True) &
    (enr_2024['subgroup'] == 'total_enrollment') &
    (enr_2024['grade_level'] == 'TOTAL')
].sort_values('n_students', ascending=False).head(15)

# Jackson demographics
jackson = enr_2024[
    (enr_2024['district_name'].str.contains('Jackson Public', na=False)) &
    (enr_2024['grade_level'] == 'TOTAL') &
    (enr_2024['subgroup'].isin(['white', 'black', 'hispanic', 'asian']))
][['subgroup', 'n_students', 'pct']]
Explore More
Full analysis with 14 stories: - Enrollment trends – 14 stories - Function reference
Data Notes
Data Source
All data comes directly from the Mississippi Department of Education (MDE):
- Primary Portal: https://newreports.mdek12.org/
- Data Explorer: https://newreports.mdek12.org/DataExplorer
- Data Download: https://newreports.mdek12.org/DataDownload
Data Collection
- Census Day: October 1 counts via Mississippi Student Information System (MSIS)
- Reporting Period: Each year represents the fall semester count
Suppression Rules
- Small cell sizes may be suppressed for student privacy
- Typically cells with fewer than 10 students are masked
Known Data Quality Issues
- Charter school data is not separately identified in the MDE portal
- Some district names have changed over time (consolidations, reorganizations)
- Pre-2007 data is not available through the current portal
- Cached data not available for all years between 2007-2026 (gaps at 2008-2009, 2011, 2014-2015)
Deeper Dive
4. The Delta is emptying out
Districts in the Mississippi Delta have seen steep enrollment declines since 2007.
delta <- c("Coahoma County", "Sunflower County", "Leflore County")
delta_trend <- enr_long %>%
  filter(is_district, grepl(paste(delta, collapse = "|"), district_name, ignore.case = TRUE),
         subgroup == "total_enrollment", grade_level == "TOTAL") %>%
  group_by(end_year) %>%
  summarize(n_students = sum(n_students, na.rm = TRUE), .groups = "drop")

stopifnot(nrow(delta_trend) > 0)

delta_trend
#> # A tibble: 13 x 2
#>    end_year n_students
#>       <dbl>      <dbl>
#>  1     2007       4656
#>  2     2010       4364
#>  3     2012       4162
#>  4     2013       4377
#>  5     2016       8051
#>  6     2017       7833
#>  7     2018       7523
#>  8     2019       7062
#>  9     2020       4628
#> 10     2021       4270
#> 11     2022       4116
#> 12     2023       3917
#> 13     2024       3961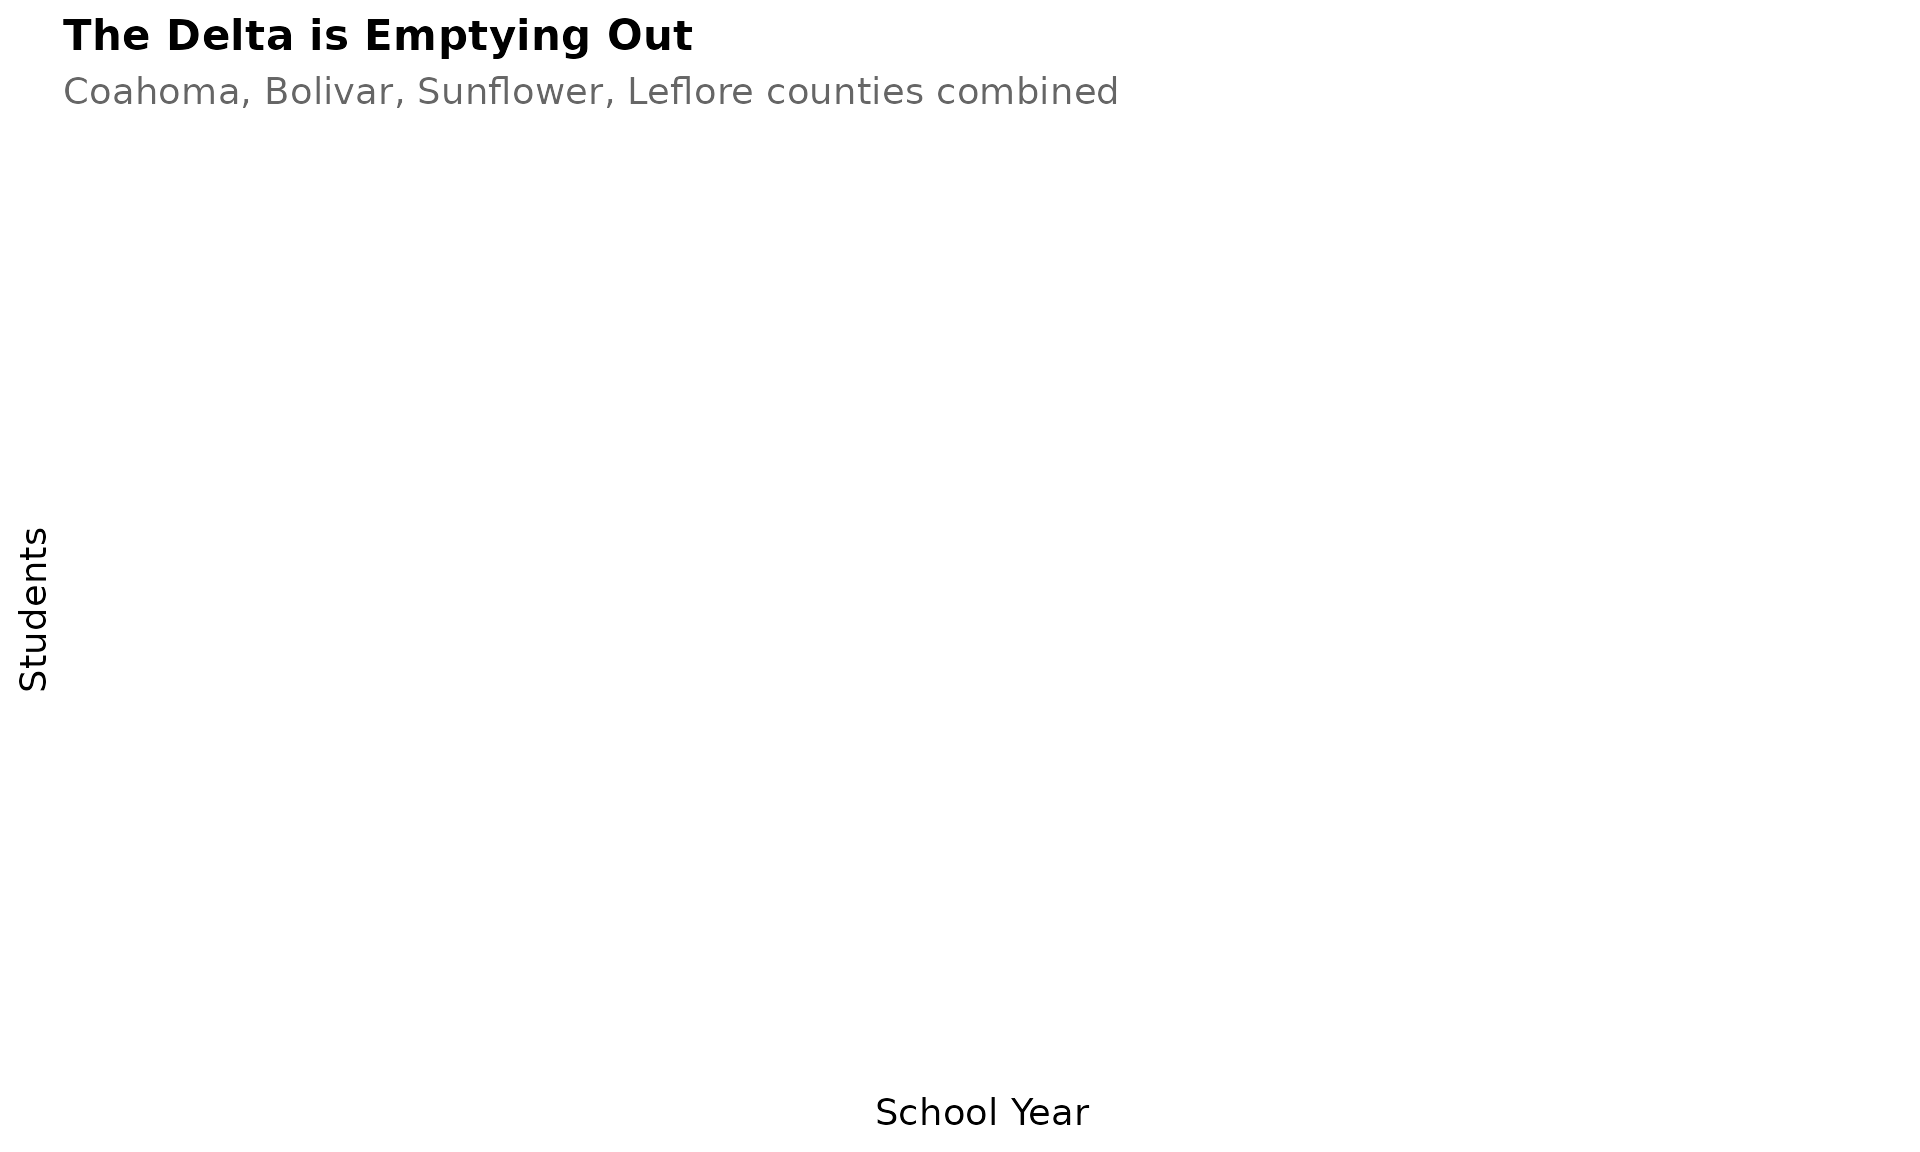
5. DeSoto County: Mississippi’s largest district
Bordering Memphis, DeSoto County grew 21% since 2007 to become Mississippi’s largest district with nearly 35,000 students.
desoto <- enr %>%
  filter(is_district, grepl("DeSoto|Desoto", district_name, ignore.case = TRUE),
         subgroup == "total_enrollment", grade_level == "TOTAL")

stopifnot(nrow(desoto) > 0)

desoto %>% select(end_year, district_name, n_students)
#>   end_year                 district_name n_students
#> 1     2016 Desoto County School District      33140
#> 2     2017 Desoto County School District      33537
#> 3     2018 Desoto County School District      33991
#> 4     2019 Desoto County School District      34392
#> 5     2020 Desoto County School District      34752
#> 6     2021 Desoto County School District      34067
#> 7     2022 Desoto County School District      34469
#> 8     2023 Desoto County School District      35003
#> 9     2024 Desoto County School District      34819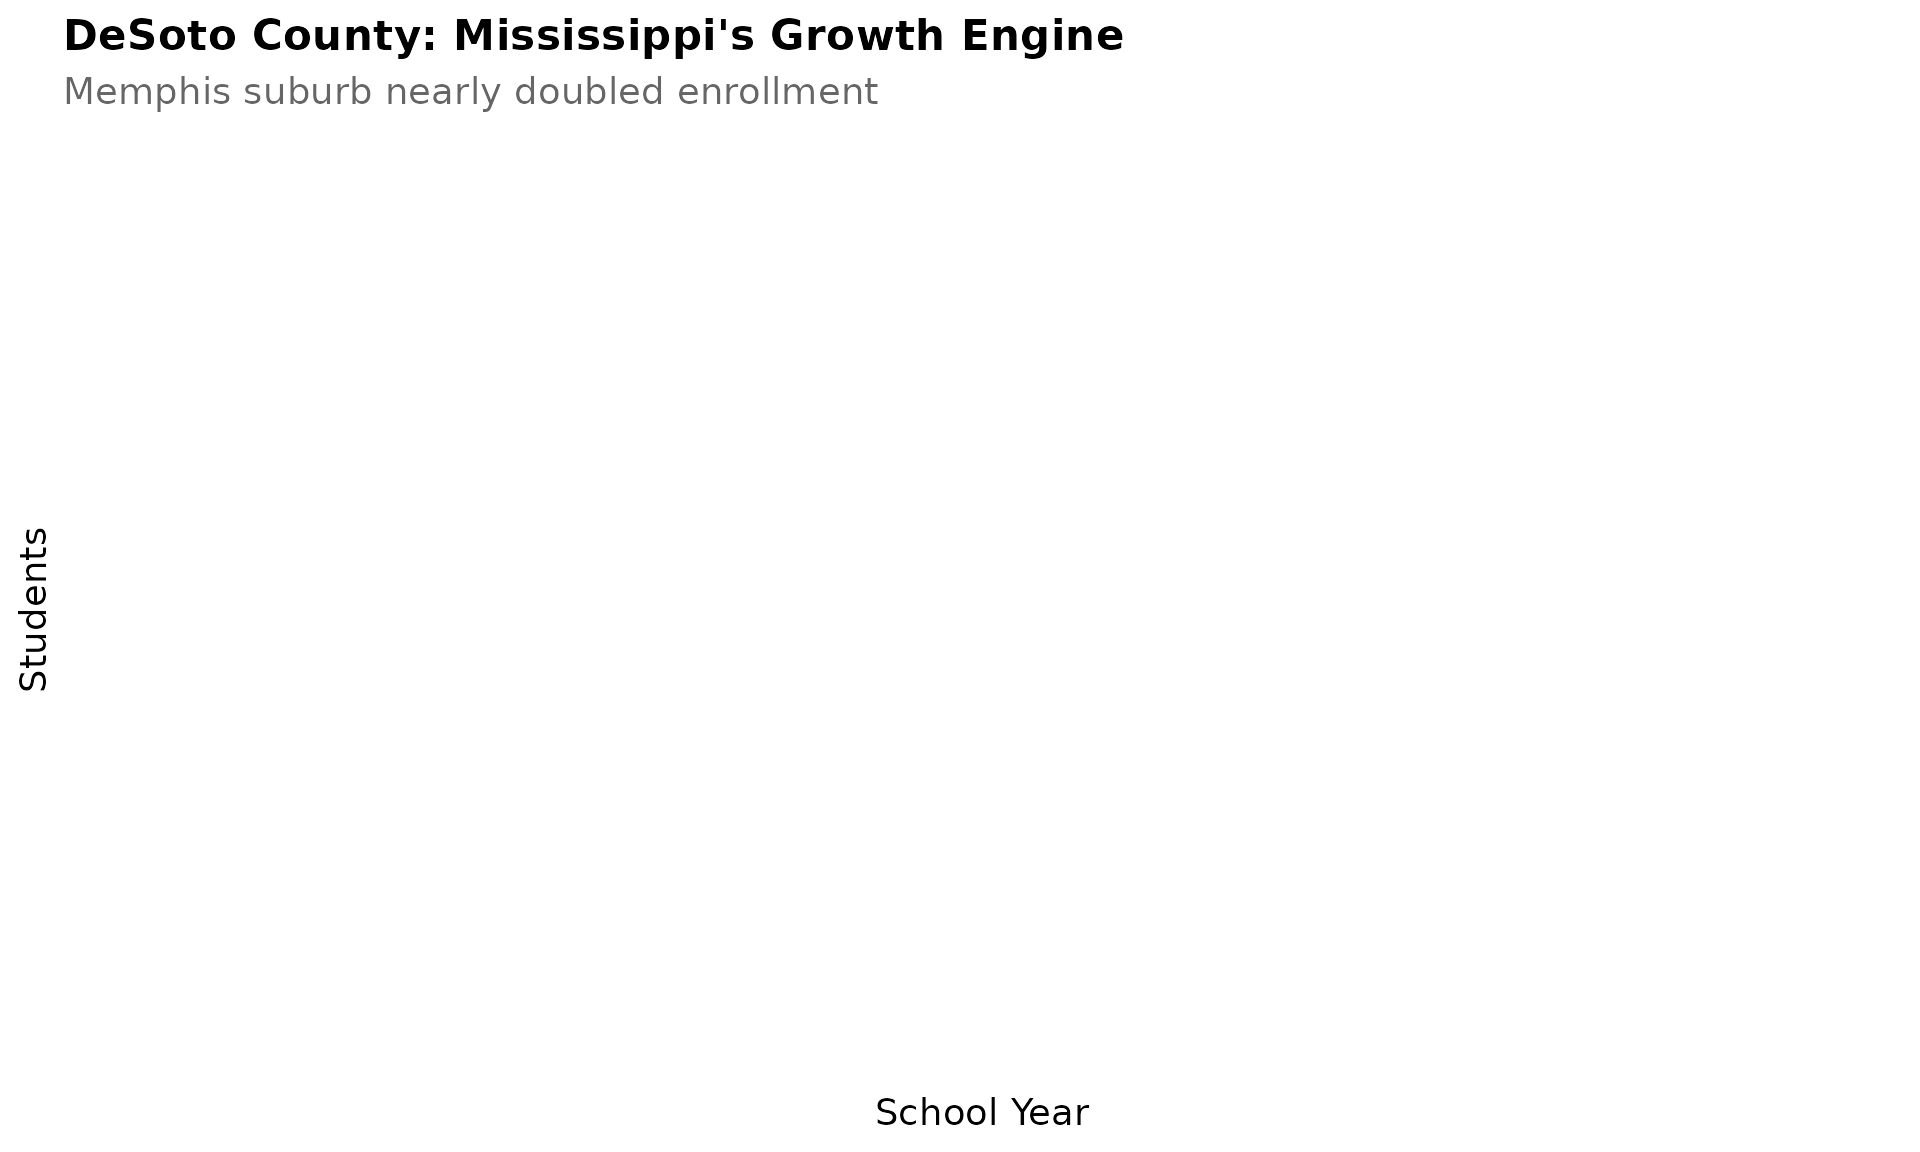
6. COVID hit kindergarten hard
Mississippi lost 13% of kindergartners in 2021 and enrollment hasn’t recovered.
k_trend <- enr %>%
  filter(is_state, subgroup == "total_enrollment",
         grade_level %in% c("K", "01", "06", "12")) %>%
  mutate(grade_label = case_when(
    grade_level == "K" ~ "Kindergarten",
    grade_level == "01" ~ "Grade 1",
    grade_level == "06" ~ "Grade 6",
    grade_level == "12" ~ "Grade 12"
  ))

stopifnot(nrow(k_trend) > 0)

k_trend %>%
  filter(grade_level == "K") %>%
  select(end_year, n_students)
#>   end_year n_students
#> 1     2016      37567
#> 2     2017      36638
#> 3     2018      35983
#> 4     2019      35134
#> 5     2020      34965
#> 6     2021      30356
#> 7     2022      33560
#> 8     2023      32887
#> 9     2024      32586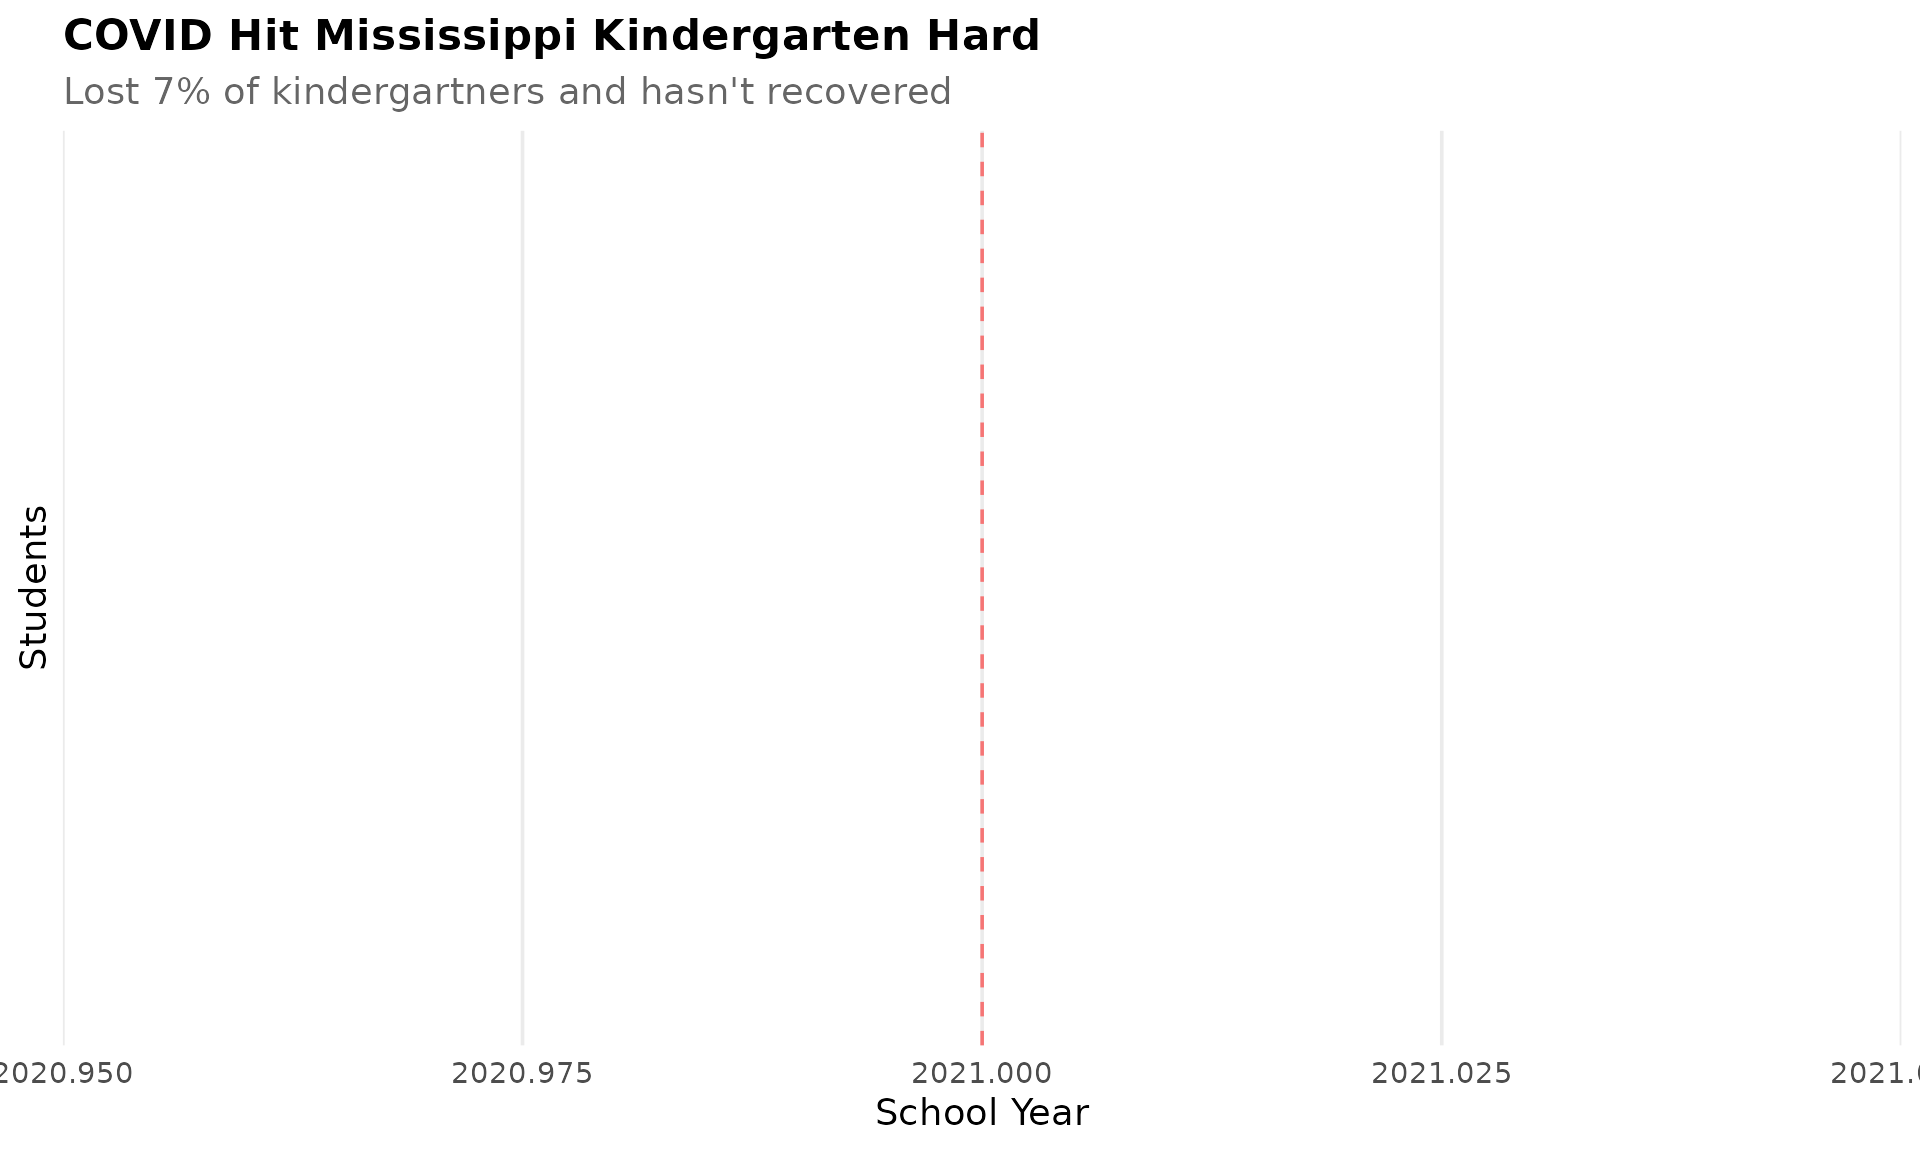
7. Madison County holds steady while Jackson shrinks
Madison County has maintained enrollment around 13,000 while neighboring Jackson declined – a sign of suburban stability.
madison <- enr %>%
  filter(is_district, grepl("Madison County", district_name, ignore.case = TRUE),
         subgroup == "total_enrollment", grade_level == "TOTAL")

stopifnot(nrow(madison) > 0)

madison %>% select(end_year, district_name, n_students)
#>   end_year                  district_name n_students
#> 1     2016 Madison County School District      13078
#> 2     2017 Madison County School District      13171
#> 3     2018 Madison County School District      13252
#> 4     2019 Madison County School District      13302
#> 5     2020 Madison County School District      13310
#> 6     2021 Madison County School District      12988
#> 7     2022 Madison County School District      13032
#> 8     2023 Madison County School District      13162
#> 9     2024 Madison County School District      12971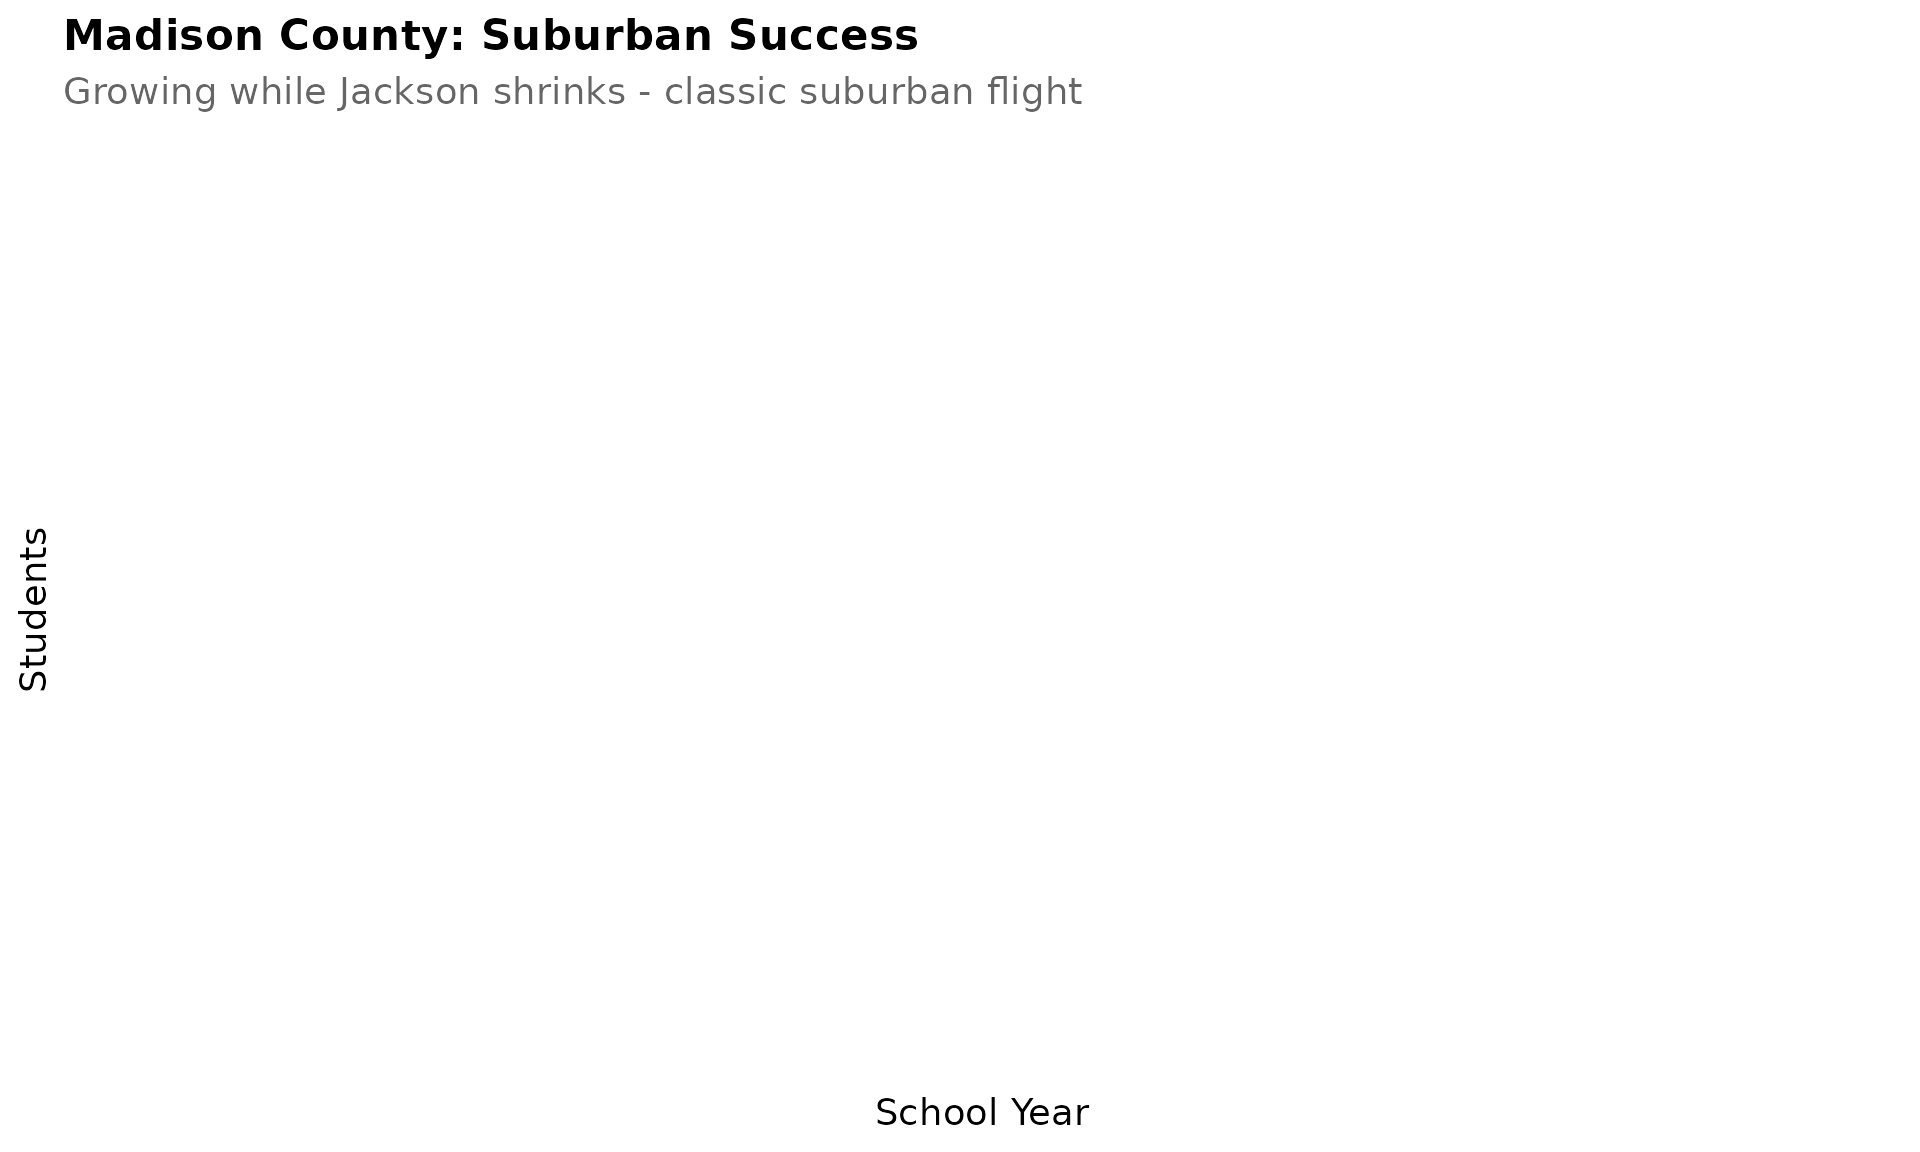
8. Hispanic students reach 46% in Forest Municipal
Forest Municipal School District is 46% Hispanic, with several other districts above 15%.
hispanic <- enr_current %>%
  filter(is_district, subgroup == "hispanic", grade_level == "TOTAL") %>%
  arrange(desc(pct)) %>%
  head(10) %>%
  mutate(district_label = reorder(district_name, pct))

stopifnot(nrow(hispanic) > 0)

hispanic %>% select(district_name, pct) %>% mutate(pct = round(pct * 100, 1))
#>                         district_name  pct
#> 1    Forest Municipal School District 45.5
#> 2        Leake County School District 18.1
#> 3       Pontotoc City School District 18.1
#> 4  Pascagoula Gautier School District 17.9
#> 5     Marshall County School District 16.7
#> 6        Scott County School District 16.4
#> 7       Biloxi Public School District 15.8
#> 8           New Albany Public Schools 15.7
#> 9     Hazlehurst City School District 14.9
#> 10      Canton Public School District 14.8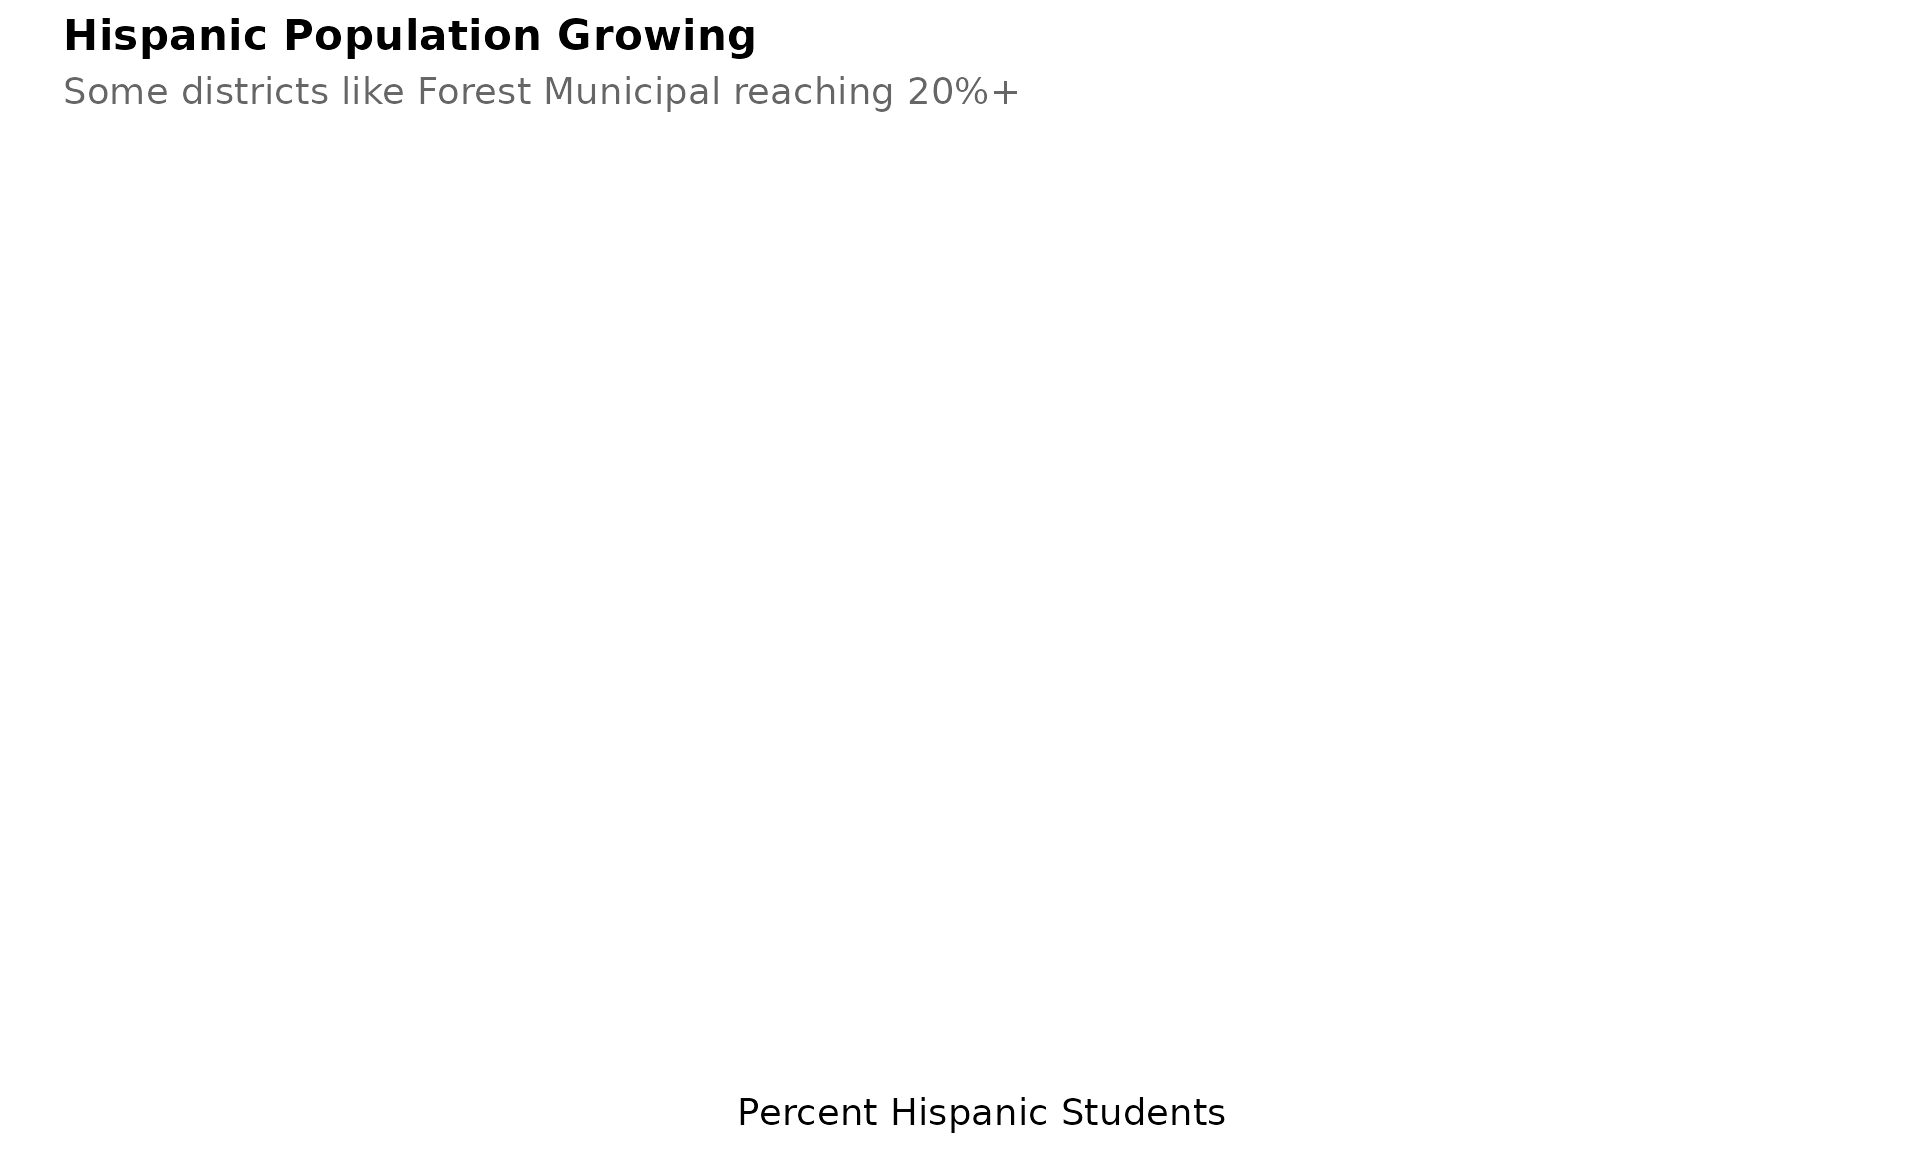
9. The Coast is holding steady
Gulf Coast districts have maintained enrollment despite hurricanes.
coast <- c("Harrison County", "Jackson County", "Hancock County")
coast_trend <- enr %>%
  filter(is_district, grepl(paste(coast, collapse = "|"), district_name, ignore.case = TRUE),
         subgroup == "total_enrollment", grade_level == "TOTAL")

stopifnot(nrow(coast_trend) > 0)

coast_trend %>%
  group_by(end_year) %>%
  summarize(total = sum(n_students, na.rm = TRUE), .groups = "drop")
#> # A tibble: 9 x 2
#>   end_year total
#>      <dbl> <dbl>
#> 1     2016 28393
#> 2     2017 28603
#> 3     2018 28698
#> 4     2019 28635
#> 5     2020 28421
#> 6     2021 26577
#> 7     2022 27275
#> 8     2023 27321
#> 9     2024 27246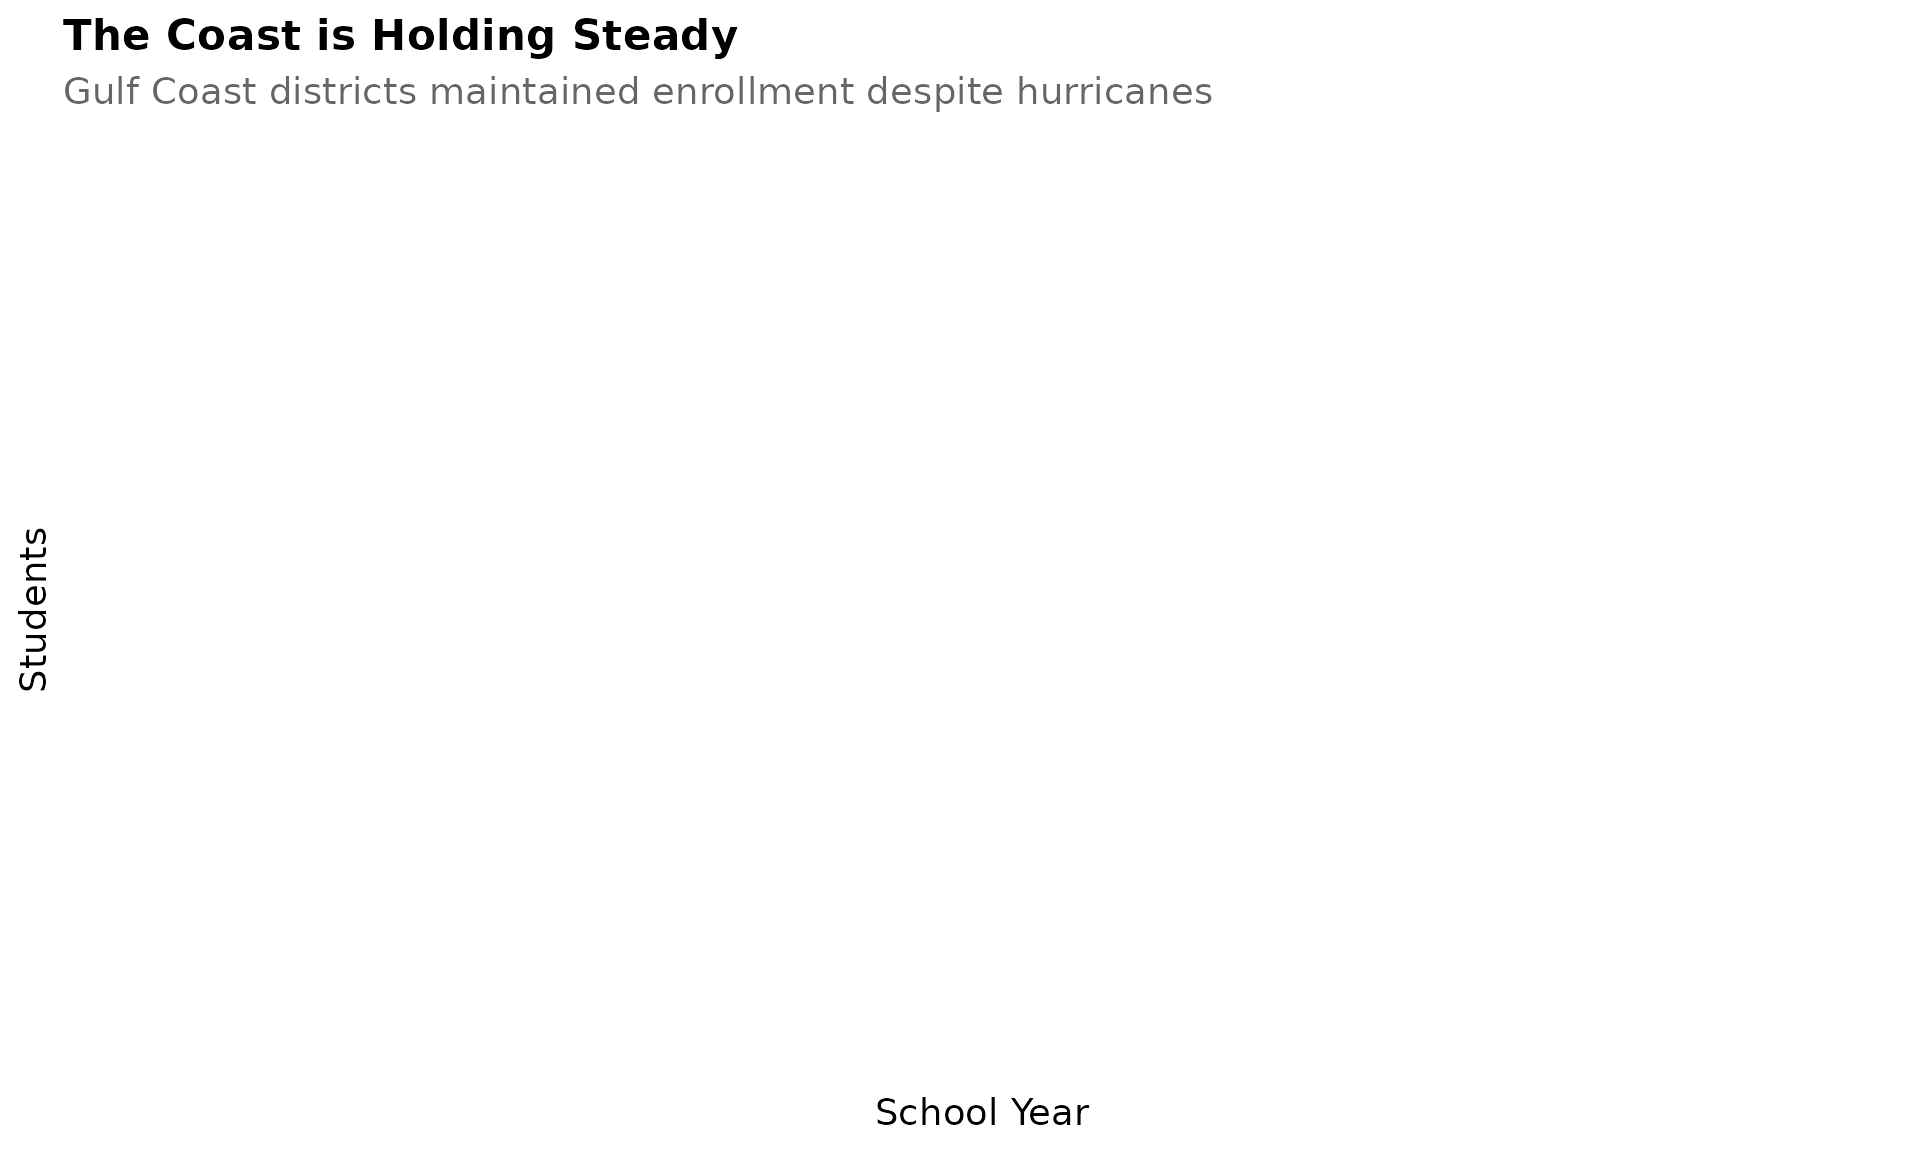
10. Charter schools are minimal
Mississippi has one of the smallest charter sectors in the nation, with fewer than 5,000 students enrolled across all charter schools.
Note: Charter school enrollment tracking is not yet implemented in this package. The MDE data portal does not currently distinguish charter schools as a separate entity type.
11. Mississippi is nearly 47% Black statewide
Mississippi has the highest percentage of Black students of any US state, with Black students outnumbering white students statewide.
race <- enr_current %>%
  filter(is_state, grade_level == "TOTAL",
         subgroup %in% c("white", "black", "hispanic", "asian")) %>%
  mutate(subgroup_label = case_when(
    subgroup == "white" ~ "White",
    subgroup == "black" ~ "Black",
    subgroup == "hispanic" ~ "Hispanic",
    subgroup == "asian" ~ "Asian"
  ))

stopifnot(nrow(race) > 0)

race %>% select(subgroup_label, n_students, pct) %>% mutate(pct = round(pct * 100, 1))
#>   subgroup_label n_students  pct
#> 1          White     183899 42.1
#> 2          Black     204447 46.8
#> 3       Hispanic      21225  4.9
#> 4          Asian       4404  1.0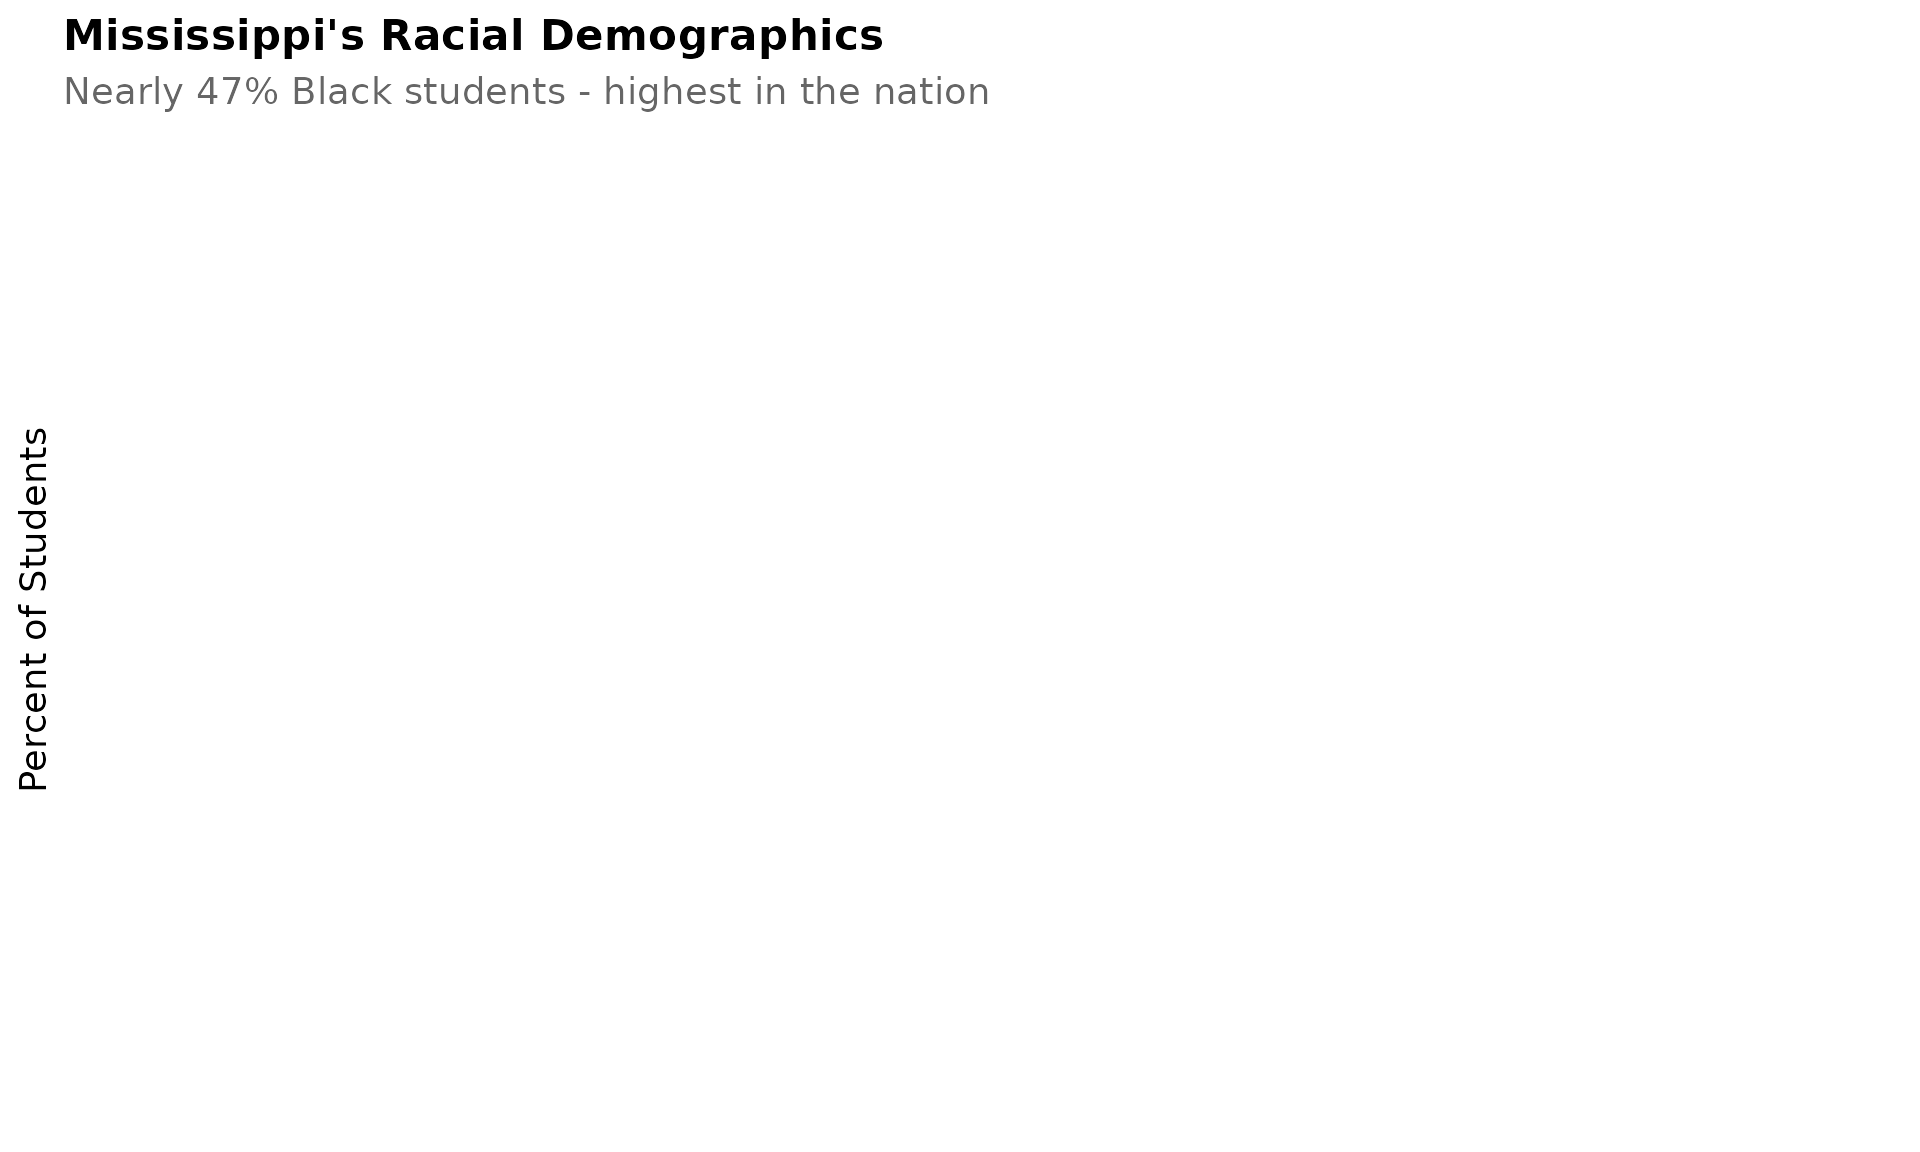
12. DeSoto and Rankin dominate enrollment rankings
The top 15 districts account for nearly half of all Mississippi students, with Memphis and Jackson suburbs leading the pack.
top_districts <- enr_current %>%
  filter(is_district, subgroup == "total_enrollment", grade_level == "TOTAL") %>%
  arrange(desc(n_students)) %>%
  head(15) %>%
  mutate(district_label = reorder(district_name, n_students))

stopifnot(nrow(top_districts) > 0)

top_districts %>% select(district_name, n_students)
#>                         district_name n_students
#> 1       Desoto County School District      34819
#> 2       Rankin County School District      18485
#> 3      Jackson Public School District      17747
#> 4     Harrison County School District      14299
#> 5      Madison County School District      12971
#> 6        Lamar County School District      10498
#> 7      Jackson County School District       8936
#> 8        Jones County School District       8581
#> 9       Tupelo Public School District       7134
#> 10   Vicksburg Warren School District       6844
#> 11 Pascagoula Gautier School District       6501
#> 12         Lee County School District       6296
#> 13           Gulfport School District       6084
#> 14  Lauderdale County School District       5951
#> 15      Ocean Springs School District       5808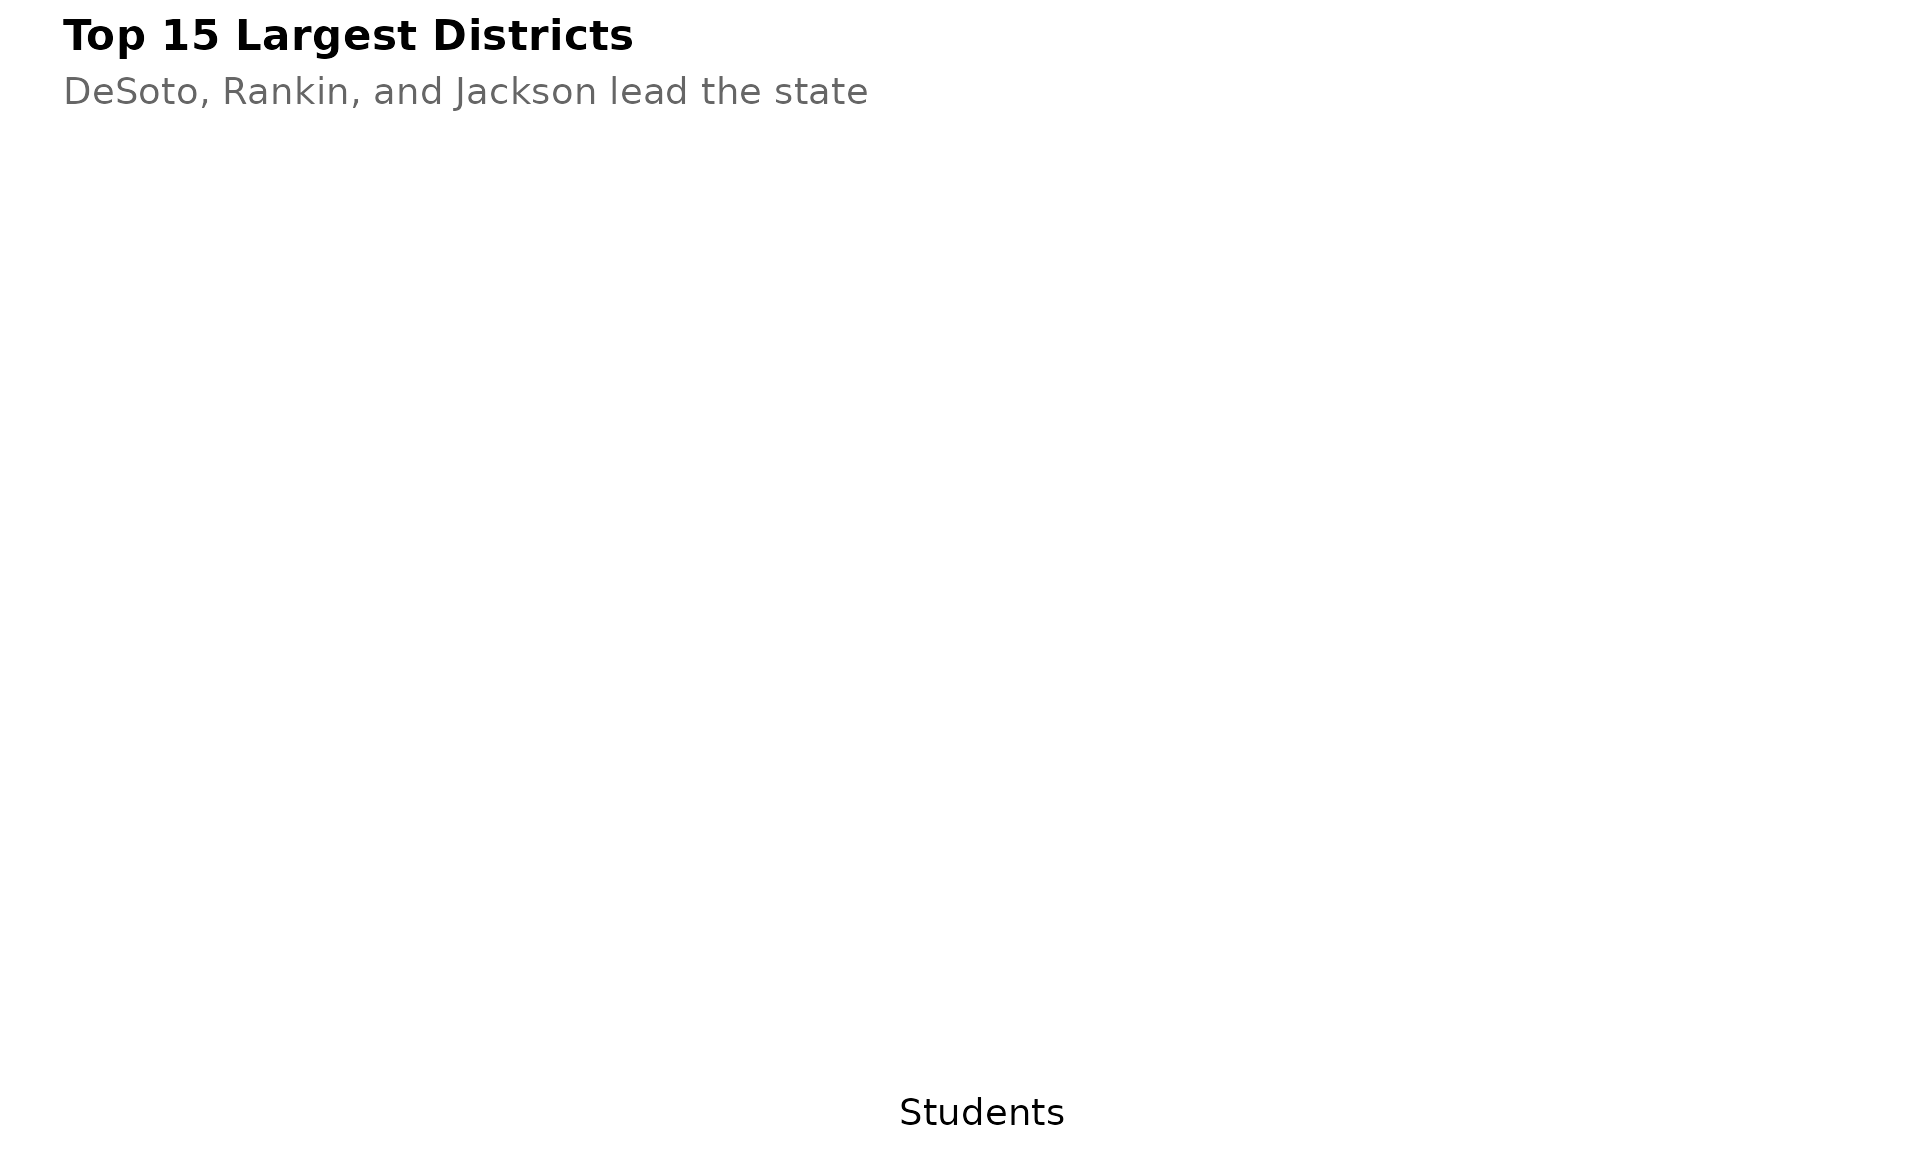
13. Rankin County is the stable suburban anchor
Rankin County (east of Jackson) has maintained enrollment around 19,000 while the capital city declined.
rankin <- enr %>%
  filter(is_district, grepl("Rankin County", district_name, ignore.case = TRUE),
         subgroup == "total_enrollment", grade_level == "TOTAL")

stopifnot(nrow(rankin) > 0)

rankin %>% select(end_year, district_name, n_students)
#>   end_year                 district_name n_students
#> 1     2016 Rankin County School District      19234
#> 2     2017 Rankin County School District      19205
#> 3     2018 Rankin County School District      19314
#> 4     2019 Rankin County School District      19206
#> 5     2020 Rankin County School District      19160
#> 6     2021 Rankin County School District      18384
#> 7     2022 Rankin County School District      18598
#> 8     2023 Rankin County School District      18720
#> 9     2024 Rankin County School District      18485
14. Mississippi’s gender balance is nearly even
Like most states, Mississippi schools are roughly 51% male and 49% female, with slight variation by district.
gender <- enr %>%
  filter(is_state, grade_level == "TOTAL",
         subgroup %in% c("male", "female")) %>%
  mutate(subgroup_label = ifelse(subgroup == "male", "Male", "Female"))

stopifnot(nrow(gender) > 0)

gender %>%
  filter(end_year == max_year) %>%
  select(subgroup_label, n_students, pct) %>%
  mutate(pct = round(pct * 100, 1))
#>   subgroup_label n_students  pct
#> 1           Male     222312 50.9
#> 2         Female     214180 49.1