North Carolina educates 1.5 million students across 115 traditional districts and 219 charter schools – and the demographic, geographic, and sector shifts hiding in the data are dramatic.
Part of the njschooldata family of state education data packages.
Full documentation – all 15 stories with interactive charts, getting-started guide, and complete function reference.
Highlights
1. Charter schools grew from 26,000 to 144,000 students in 18 years
North Carolina’s charter sector has exploded. In 2006, 99 charter schools served 26,000 students. By 2024, 219 charters serve 144,000 – nearly 10% of all students.
enr_2024 <- fetch_enr(2024, use_cache = TRUE)

charter_summary <- enr_2024 %>%
  filter(is_campus, subgroup == "total_enrollment", grade_level == "TOTAL") %>%
  group_by(is_charter) %>%
  summarize(
    n_schools = n(),
    students = sum(n_students, na.rm = TRUE),
    .groups = "drop"
  )

state_total <- enr_2024 %>%
  filter(is_state, subgroup == "total_enrollment", grade_level == "TOTAL") %>%
  pull(n_students)

charter_summary <- charter_summary %>%
  mutate(pct = round(students / state_total * 100, 1))

stopifnot(nrow(charter_summary) == 2)
charter_summary
#> # A tibble: 2 x 4
#>   is_charter n_schools students   pct
#>   <lgl>          <int>    <dbl> <dbl>
#> 1 FALSE           2483  1364278  90.5
#> 2 TRUE             219   143916   9.5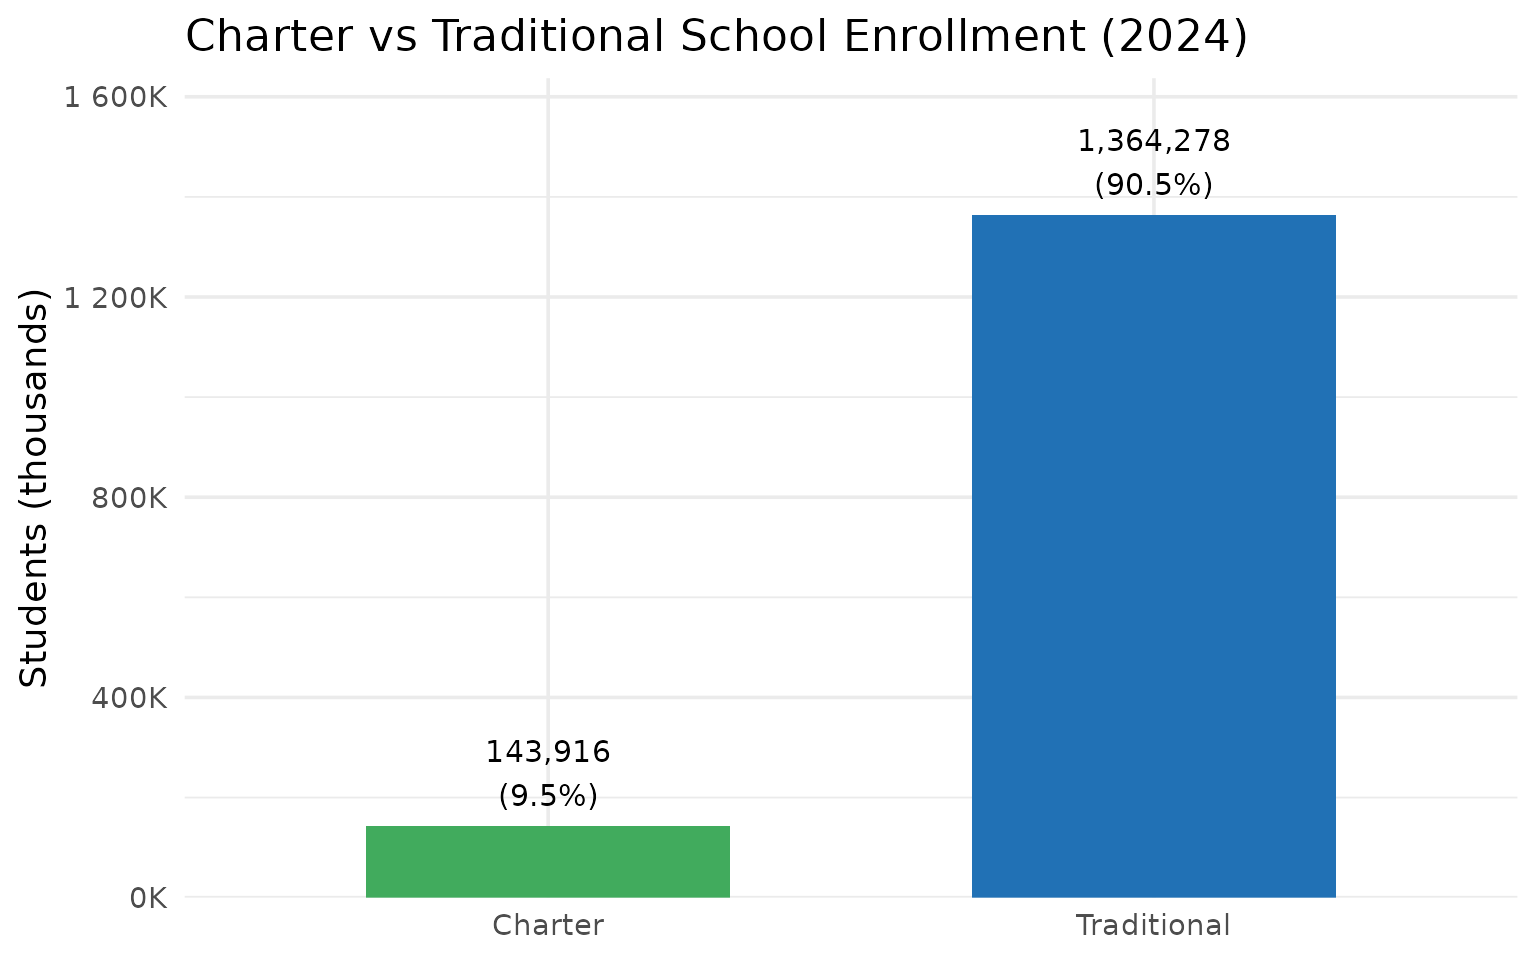
2. Durham is nearly a 50/50 Black-Hispanic district
In 2018 Durham was 46% Black and 32% Hispanic. By 2024 the gap closed to 39% Black and 38% Hispanic. The crossover is imminent.
enr_durham <- fetch_enr_multi(c(2018, 2020, 2024), use_cache = TRUE)

durham_demographics <- enr_durham %>%
  filter(is_district, district_id == "320", grade_level == "TOTAL",
         subgroup %in% c("white", "black", "hispanic", "asian")) %>%
  group_by(end_year) %>%
  mutate(
    total = sum(n_students),
    pct = round(n_students / total * 100, 1)
  ) %>%
  ungroup() %>%
  select(end_year, subgroup, n_students, pct)

stopifnot(nrow(durham_demographics) > 0)
durham_demographics
#> # A tibble: 12 x 4
#>    end_year subgroup n_students   pct
#>       <dbl> <chr>         <dbl> <dbl>
#>  1     2018 asian           753   2.3
#>  2     2018 black         14976  46.3
#>  3     2018 hispanic      10295  31.8
#>  4     2018 white          6314  19.5
#>  5     2020 asian           691   2.2
#>  6     2020 black         13924  43.6
#>  7     2020 hispanic      10943  34.3
#>  8     2020 white          6345  19.9
#>  9     2024 asian           701   2.4
#> 10     2024 black         11339  39.2
#> 11     2024 hispanic      11090  38.4
#> 12     2024 white          5770  20.0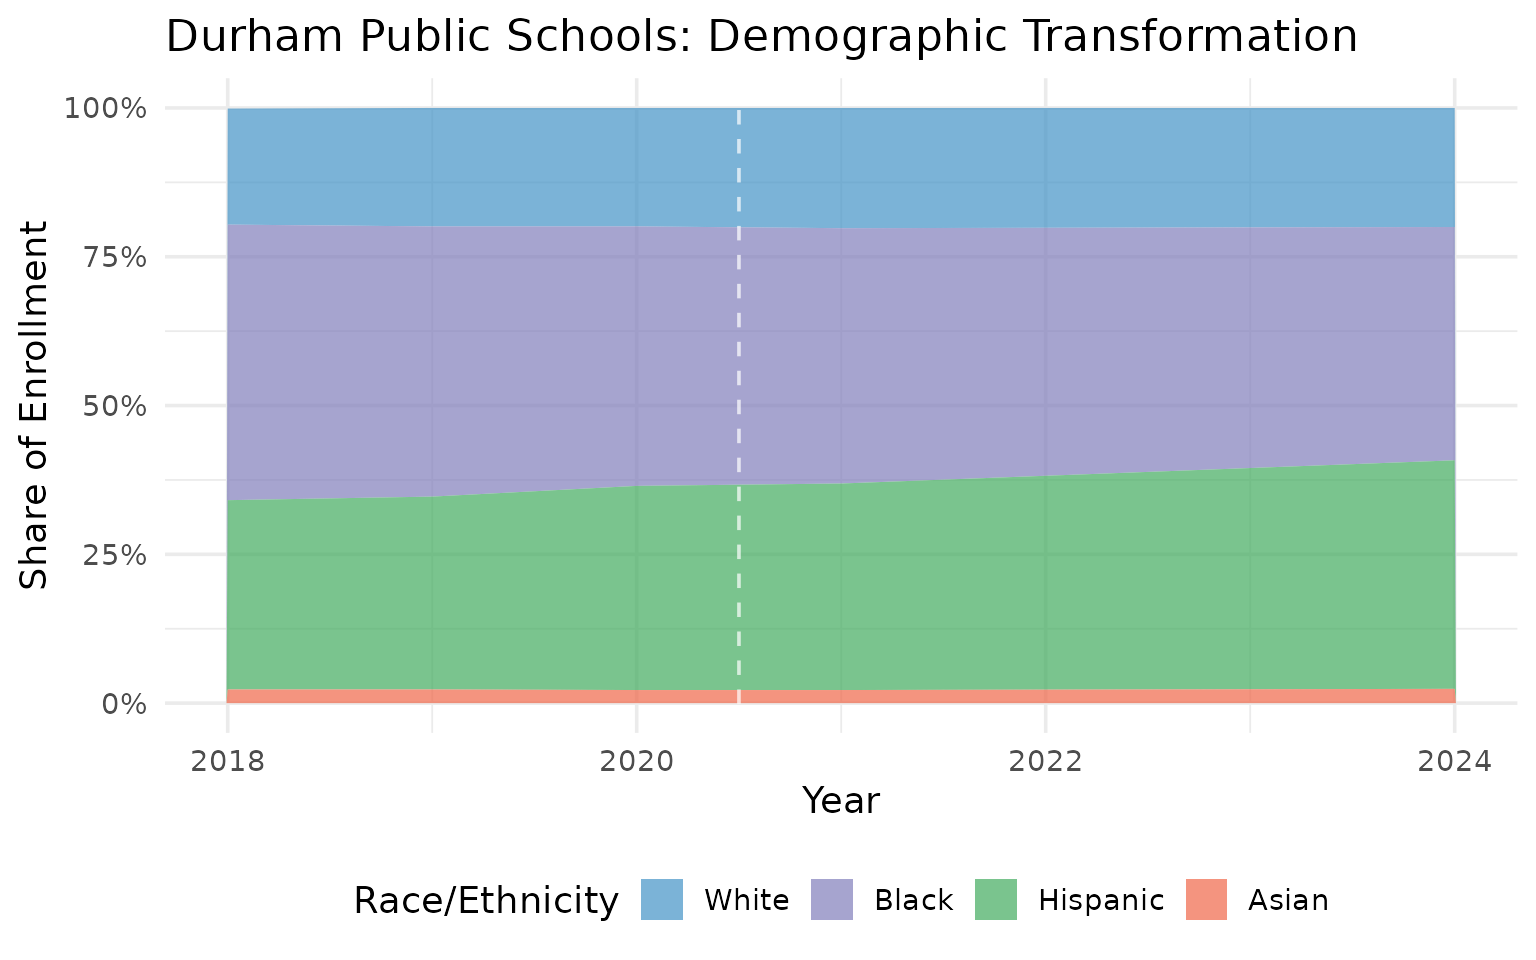
3. Rural eastern NC lost 25% of its students since 2015
Eight tobacco belt counties (Edgecombe, Halifax, Hertford, Northampton, Bertie, Martin, Washington, Tyrrell) dropped from 21,596 to 16,219 students – a 25% decline in under a decade.
enr_multi <- fetch_enr_multi(c(2015, 2024), use_cache = TRUE)

eastern_rural <- c("Edgecombe", "Halifax", "Hertford", "Northampton",
                   "Bertie", "Martin", "Washington", "Tyrrell")

eastern_data <- enr_multi %>%
  filter(is_district, subgroup == "total_enrollment", grade_level == "TOTAL") %>%
  mutate(is_eastern = grepl(paste(eastern_rural, collapse = "|"), district_name)) %>%
  filter(is_eastern) %>%
  group_by(end_year) %>%
  summarize(total = sum(n_students, na.rm = TRUE), .groups = "drop") %>%
  mutate(pct_change = round((total / first(total) - 1) * 100, 1))

stopifnot(nrow(eastern_data) == 2)
eastern_data
#> # A tibble: 2 x 3
#>   end_year total pct_change
#>      <dbl> <dbl>      <dbl>
#> 1     2015 21596        0
#> 2     2024 16219      -24.9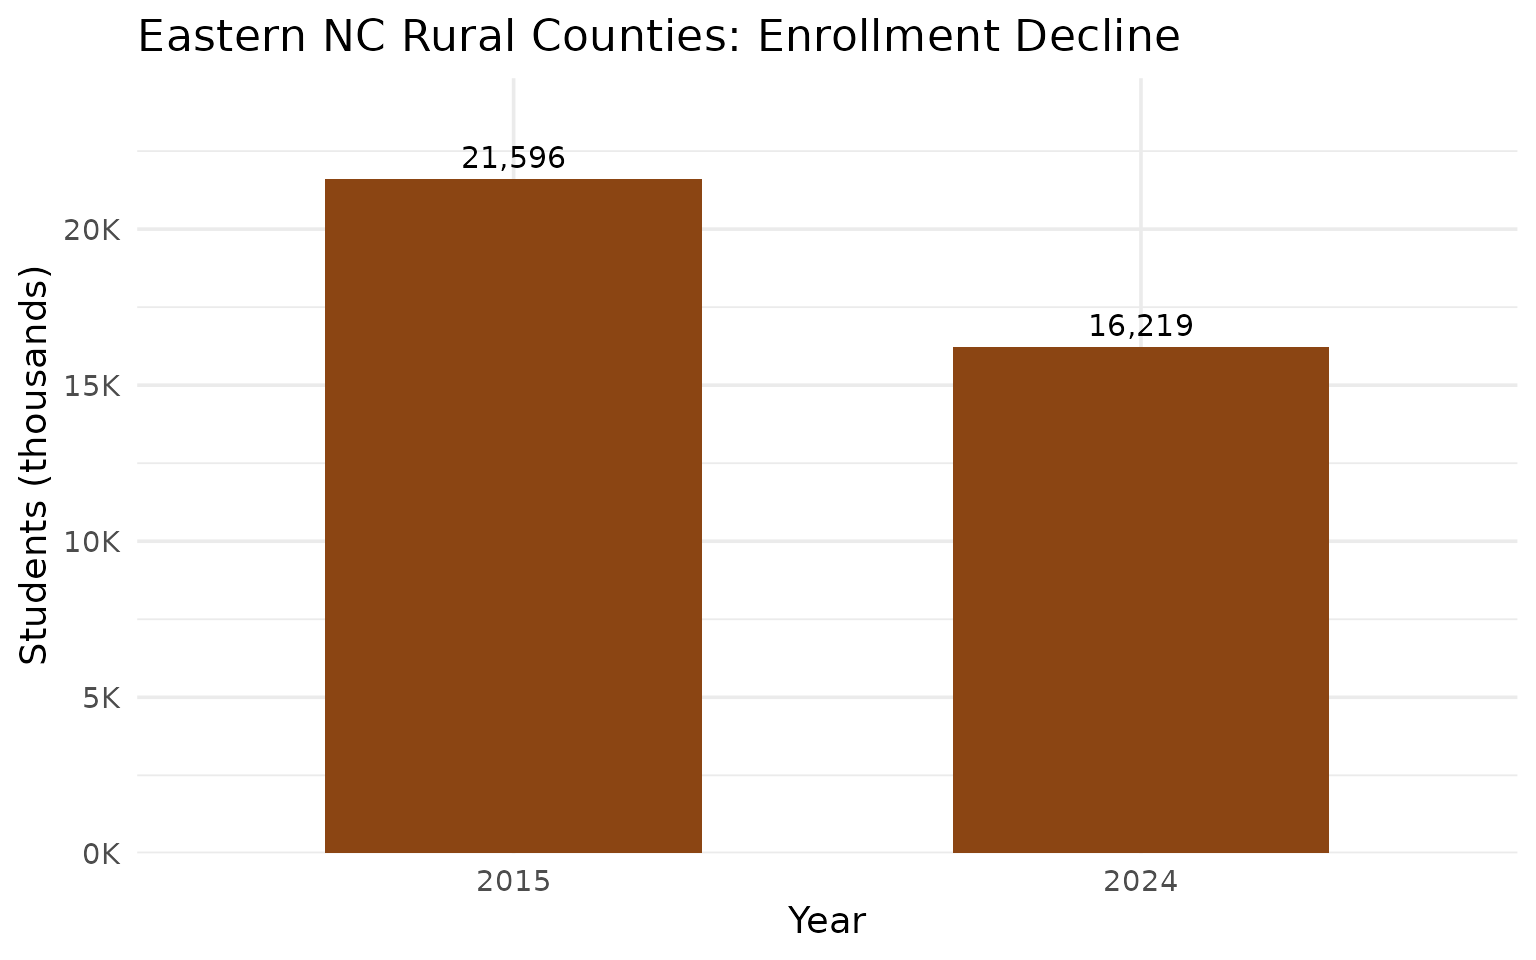
Data Taxonomy
| Category | Years | Function | Details |
|---|---|---|---|
| Enrollment | 2006-2024 |
fetch_enr() / fetch_enr_multi()
|
State, district, school. Race, gender, FRPL, SpEd, LEP |
| Assessments | 2014-2024 |
fetch_assessment() / fetch_assessment_multi()
|
EOG (3-8) + EOC. State, district, school. All ESSA subgroups |
| Directory | Current | fetch_directory() |
School names, addresses, types |
| Graduation | — | — | Not yet available |
| Per-Pupil Spending | — | — | Not yet available |
| Accountability | — | — | Not yet available |
| Chronic Absence | — | — | Not yet available |
| EL Progress | — | — | Not yet available |
| Special Ed | — | — | Not yet available |
See the full data category taxonomy
Quick Start
R
# install.packages("remotes")
remotes::install_github("almartin82/ncschooldata")

library(ncschooldata)
library(dplyr)

# Fetch one year
enr_2024 <- fetch_enr(2024, use_cache = TRUE)

# Fetch multiple years
enr_recent <- fetch_enr_multi(c(2018, 2019, 2020, 2021, 2024), use_cache = TRUE)

# State totals
enr_2024 %>%
  filter(is_state, subgroup == "total_enrollment", grade_level == "TOTAL")

# District breakdown
enr_2024 %>%
  filter(is_district, subgroup == "total_enrollment", grade_level == "TOTAL") %>%
  arrange(desc(n_students))

# Demographics
enr_2024 %>%
  filter(is_state, grade_level == "TOTAL",
         subgroup %in% c("white", "black", "hispanic"))
Python
import pyncschooldata as nc

# Fetch one year
enr_2024 = nc.fetch_enr(2024)

# Fetch multiple years
enr_recent = nc.fetch_enr_multi([2018, 2019, 2020, 2021, 2024])

# State totals
state_total = enr_2024[
    (enr_2024['is_state'] == True) &
    (enr_2024['subgroup'] == 'total_enrollment') &
    (enr_2024['grade_level'] == 'TOTAL')
]

# District breakdown
districts = enr_2024[
    (enr_2024['is_district'] == True) &
    (enr_2024['subgroup'] == 'total_enrollment') &
    (enr_2024['grade_level'] == 'TOTAL')
].sort_values('n_students', ascending=False)
Explore More
Full analysis with 15 stories: - Enrollment trends – 15 stories - Function reference
Data Notes
Data Source
NC Department of Public Instruction Statistical Profile: apps.schools.nc.gov
Census Day
Enrollment counts are based on the first school month (typically late September/early October). The official reporting day varies by year but is generally the 20th school day.
Suppression Rules
- Counts fewer than 10 students are suppressed at the school level for privacy
- Suppressed values appear as
NAin the data - State and district totals include all students (no suppression at aggregate levels)
- When analyzing small schools or subgroups, expect some missing values
Data Quality Notes
- 2006-2010: Total enrollment only; no demographic breakdowns
- 2018+: Full demographic breakdowns available (12-13 subgroups)
- 2022-2023: Not cached; NC DPI API requires session authentication
-
Charter schools: Counted as campuses, not districts; use
is_charterflag - Special populations: May overlap (e.g., a student can be both LEP and economically disadvantaged)
Known Limitations
- Pre-K enrollment may be incomplete (not all programs report to DPI)
- Individual grade-level data (K, 01-08) at state level may have duplicates; use
grade_level == "TOTAL"for reliable state/district totals - Historical data before 2006 uses different reporting formats
- Some charter schools have opened/closed mid-year affecting comparisons
Deeper Dive
4. North Carolina’s 1.5 million students peaked in 2019 – COVID erased a decade of growth
NC grew steadily from 1.39M to 1.54M, then lost 66,000 students by 2021. Recovery is underway but the state is still 27K below its 2019 peak.
enr <- fetch_enr_multi(c(2006, 2010, 2015, 2020, 2024), use_cache = TRUE)

statewide <- enr %>%
  filter(is_state, subgroup == "total_enrollment", grade_level == "TOTAL") %>%
  select(end_year, n_students)

stopifnot(nrow(statewide) > 0)
statewide
#> # A tibble: 5 x 2
#>   end_year n_students
#>      <dbl>      <dbl>
#> 1     2006    1390168
#> 2     2010    1440212
#> 3     2015    1502009
#> 4     2020    1525592
#> 5     2024    1508194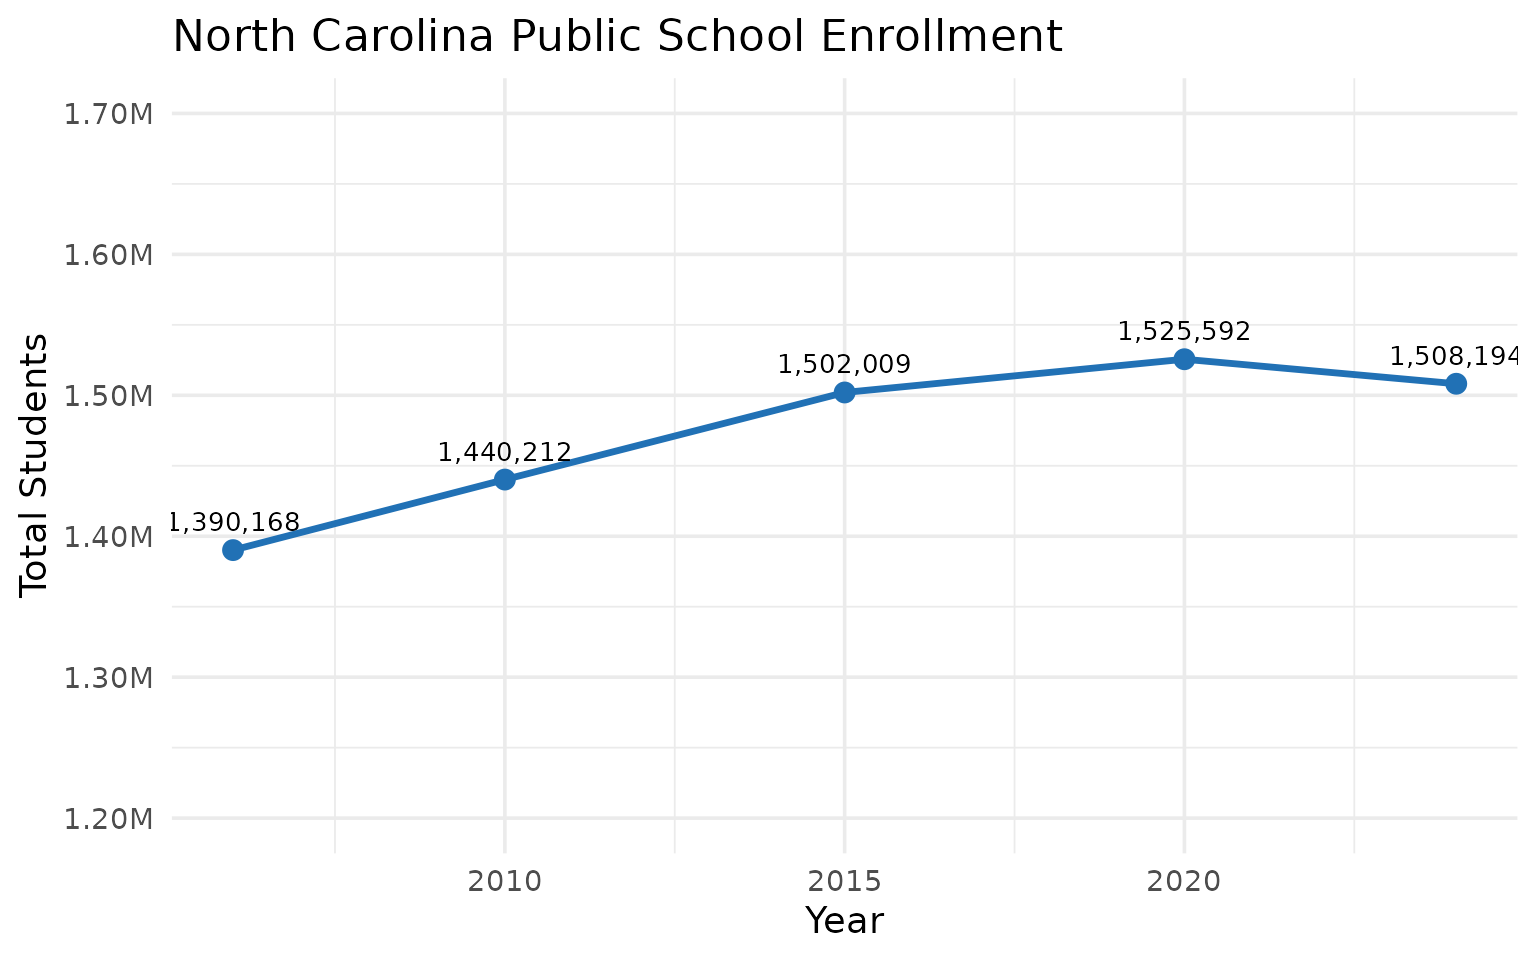
5. Wake County: 160,000 students and bigger than many states
Wake County Schools is the largest district in NC, with nearly 160,000 students. Charlotte-Mecklenburg follows at 140,000.
enr_2024 <- fetch_enr(2024, use_cache = TRUE)

top_districts <- enr_2024 %>%
  filter(is_district, subgroup == "total_enrollment", grade_level == "TOTAL") %>%
  arrange(desc(n_students)) %>%
  head(10) %>%
  select(district_name, n_students)

stopifnot(nrow(top_districts) == 10)
top_districts
#> # A tibble: 10 x 2
#>    district_name                          n_students
#>    <chr>                                       <dbl>
#>  1 Wake County Schools                        159675
#>  2 Charlotte-Mecklenburg Schools              140415
#>  3 Guilford County Schools                     65879
#>  4 Winston Salem / Forsyth County Schools      50842
#>  5 Cumberland County Schools                   47871
#>  6 Union County Public Schools                 41378
#>  7 Johnston County Public Schools              36745
#>  8 Cabarrus County Schools                     34919
#>  9 Durham Public Schools                       30783
#> 10 Gaston County Schools                       29714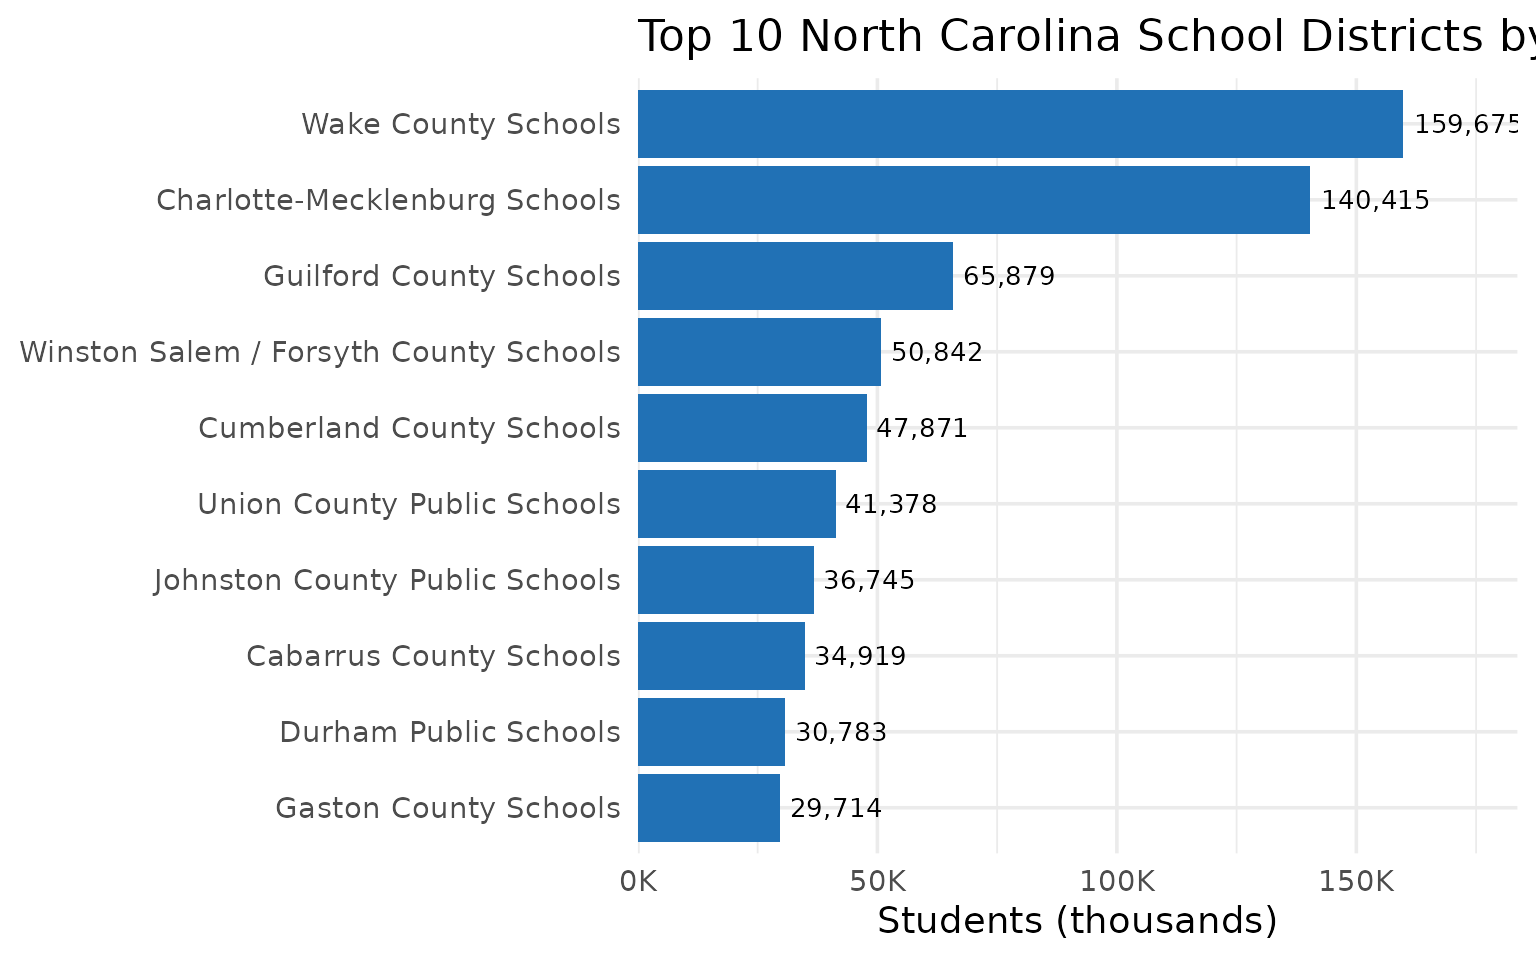
6. White students dropped from 47% to 43% while Hispanic enrollment surged
Between 2018 and 2024, white enrollment fell by 106,000 students while Hispanic enrollment grew by 57,000. North Carolina is becoming a majority-minority school system.
enr_demo <- fetch_enr_multi(c(2018, 2019, 2020, 2021, 2024), use_cache = TRUE)

demographics <- enr_demo %>%
  filter(is_state, grade_level == "TOTAL",
         subgroup %in% c("white", "black", "hispanic", "asian")) %>%
  select(end_year, subgroup, n_students) %>%
  mutate(subgroup = factor(subgroup,
    levels = c("white", "black", "hispanic", "asian"),
    labels = c("White", "Black", "Hispanic", "Asian")))

stopifnot(nrow(demographics) > 0)
demographics
#> # A tibble: 20 x 3
#>    end_year subgroup n_students
#>       <dbl> <fct>         <dbl>
#>  1     2018 Asian         51706
#>  2     2018 Black        393618
#>  3     2018 Hispanic     271304
#>  4     2018 White        749498
#>  5     2019 Asian         54349
#>  6     2019 Black        394222
#>  7     2019 Hispanic     282328
#>  8     2019 White        746767
#>  9     2020 Asian         55582
#> 10     2020 Black        382563
#> 11     2020 Hispanic     292782
#> 12     2020 White        722929
#> 13     2021 Asian         56197
#> 14     2021 Black        373647
#> 15     2021 Hispanic     285867
#> 16     2021 White        687491
#> 17     2024 Asian         64402
#> 18     2024 Black        369522
#> 19     2024 Hispanic     328041
#> 20     2024 White        643051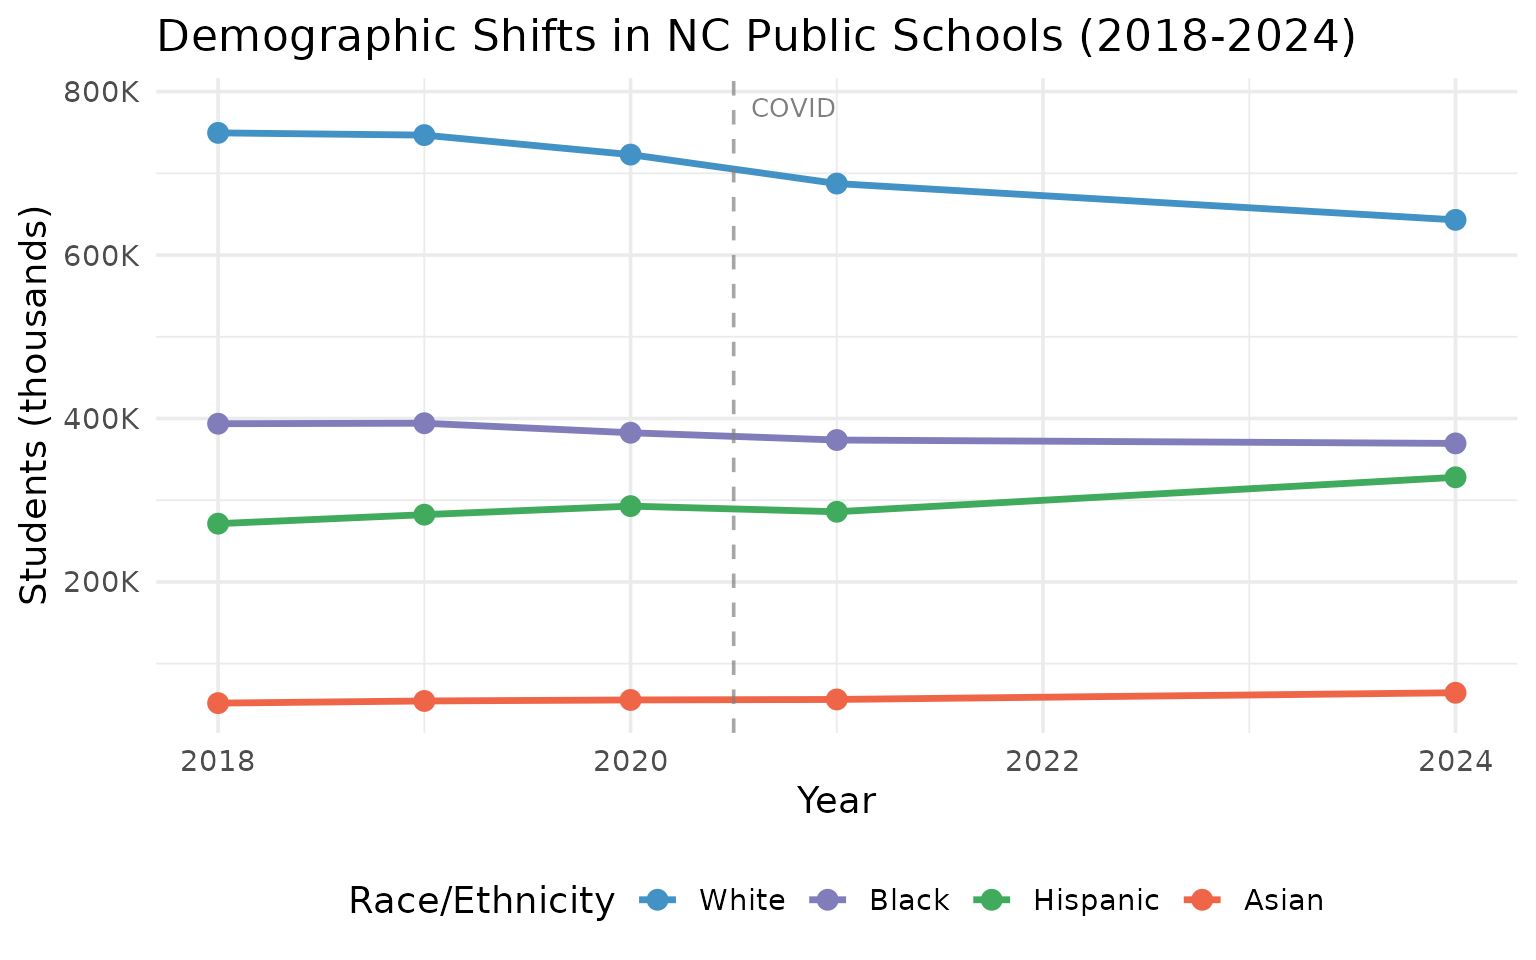
7. Charlotte-Mecklenburg lost 10,000 students during COVID then partially recovered
CMS dropped from 147,600 in 2019 to 137,600 in 2021 – a staggering 10,000-student loss. By 2024 it has clawed back to 140,400 but remains 7,200 below its peak.
enr_cms <- fetch_enr_multi(c(2018, 2019, 2020, 2021, 2024), use_cache = TRUE)

cms_trend <- enr_cms %>%
  filter(is_district, grepl("Charlotte-Mecklenburg", district_name),
         subgroup == "total_enrollment", grade_level == "TOTAL") %>%
  select(end_year, district_name, n_students) %>%
  mutate(change = n_students - lag(n_students))

stopifnot(nrow(cms_trend) > 0)
cms_trend
#> # A tibble: 5 x 4
#>   end_year district_name                 n_students change
#>      <dbl> <chr>                              <dbl>  <dbl>
#> 1     2018 Charlotte-Mecklenburg Schools     146693     NA
#> 2     2019 Charlotte-Mecklenburg Schools     147639    946
#> 3     2020 Charlotte-Mecklenburg Schools     146255  -1384
#> 4     2021 Charlotte-Mecklenburg Schools     137578  -8677
#> 5     2024 Charlotte-Mecklenburg Schools     140415   2837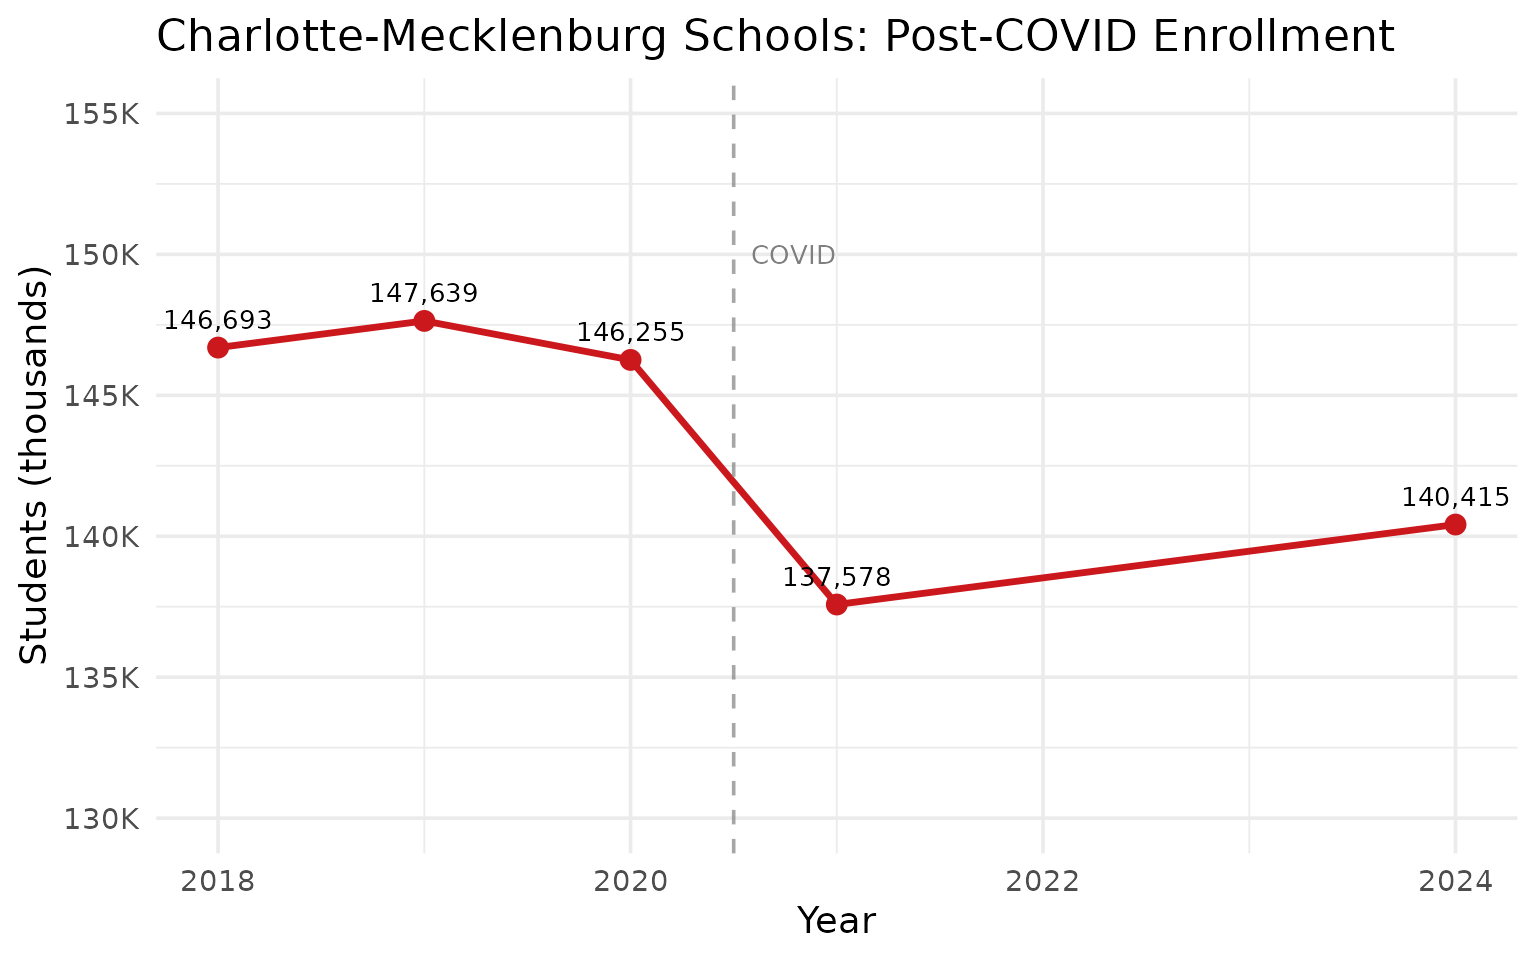
8. Half of NC students are economically disadvantaged
757,944 students – 50.3% of the state – qualify as economically disadvantaged. This is the first year econ_disadv data is available in the package.
econ_data <- enr_2024 %>%
  filter(is_state, grade_level == "TOTAL",
         subgroup %in% c("total_enrollment", "econ_disadv")) %>%
  select(subgroup, n_students) %>%
  mutate(pct = round(n_students / max(n_students) * 100, 1))

stopifnot(nrow(econ_data) == 2)
econ_data
#> # A tibble: 2 x 3
#>   subgroup         n_students   pct
#>   <chr>                 <dbl> <dbl>
#> 1 total_enrollment    1508194 100
#> 2 econ_disadv          757944  50.3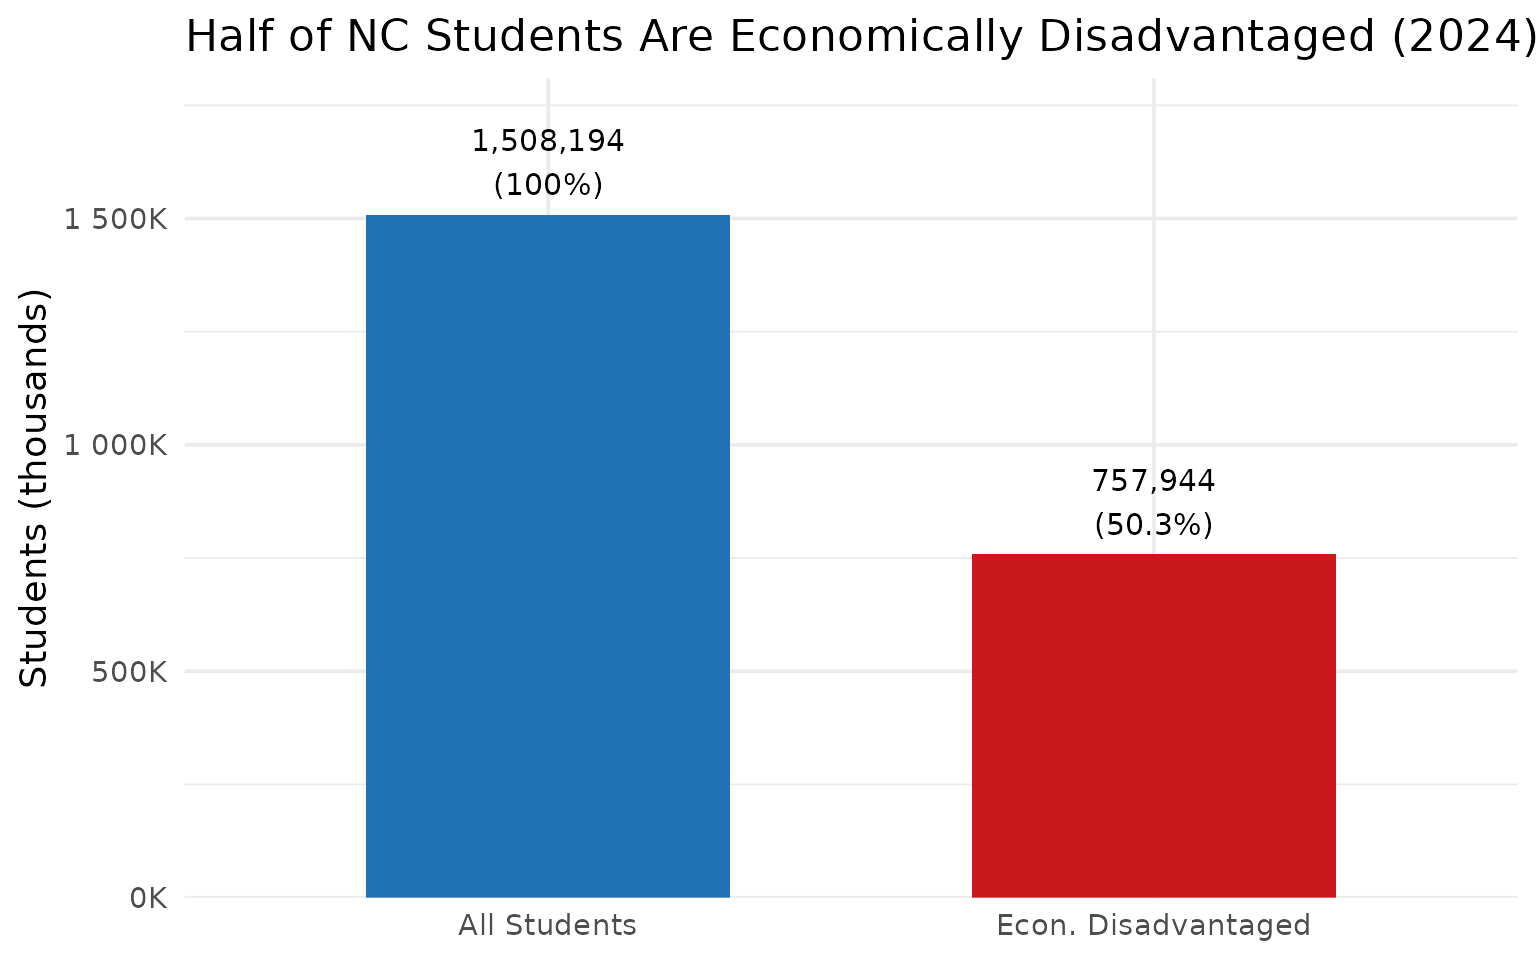
9. English Learners grew 42% in six years
From 118,569 in 2018 to 168,383 in 2024, NC schools added nearly 50,000 English Learners. LEP students now make up 11.2% of total enrollment.
enr_lep <- fetch_enr_multi(c(2018, 2019, 2020, 2021, 2024), use_cache = TRUE)

lep_trend <- enr_lep %>%
  filter(is_state, grade_level == "TOTAL", subgroup == "lep") %>%
  select(end_year, n_students) %>%
  mutate(pct_change = round((n_students / first(n_students) - 1) * 100, 1))

stopifnot(nrow(lep_trend) > 0)
lep_trend
#> # A tibble: 5 x 3
#>   end_year n_students pct_change
#>      <dbl>      <dbl>      <dbl>
#> 1     2018     118569        0
#> 2     2019     127843        7.8
#> 3     2020     126240        6.5
#> 4     2021     131322       10.8
#> 5     2024     168383       42
10. Wake County grew 33% since 2006 but may have peaked
Wake County added nearly 40,000 students from 2006 to 2020, then dipped slightly by 2024. After years of relentless growth, has the Research Triangle’s anchor district plateaued?
enr_wake <- fetch_enr_multi(c(2006, 2010, 2015, 2020, 2024), use_cache = TRUE)

wake_trend <- enr_wake %>%
  filter(is_district, subgroup == "total_enrollment", grade_level == "TOTAL",
         grepl("Wake", district_name)) %>%
  select(end_year, district_name, n_students) %>%
  mutate(change = n_students - lag(n_students))

stopifnot(nrow(wake_trend) > 0)
wake_trend
#> # A tibble: 5 x 4
#>   end_year district_name       n_students change
#>      <dbl> <chr>                    <dbl>  <dbl>
#> 1     2006 Wake County Schools     120367     NA
#> 2     2010 Wake County Schools     139064  18697
#> 3     2015 Wake County Schools     153488  14424
#> 4     2020 Wake County Schools     160622   7134
#> 5     2024 Wake County Schools     159675   -947
11. The coast is growing while the Piedmont shrinks
Coastal counties (New Hanover, Brunswick, Pender) gained students while Piedmont cities (Guilford, Forsyth, Alamance) lost nearly 9,000 since 2015.
enr_regional <- fetch_enr_multi(c(2015, 2024), use_cache = TRUE)

coastal <- c("New Hanover", "Brunswick", "Pender")
piedmont <- c("Guilford", "Forsyth", "Alamance")

regional <- enr_regional %>%
  filter(is_district, subgroup == "total_enrollment", grade_level == "TOTAL") %>%
  mutate(region = case_when(
    grepl(paste(coastal, collapse = "|"), district_name) ~ "Coast",
    grepl(paste(piedmont, collapse = "|"), district_name) ~ "Piedmont",
    TRUE ~ "Other"
  )) %>%
  filter(region %in% c("Coast", "Piedmont")) %>%
  group_by(end_year, region) %>%
  summarize(total = sum(n_students, na.rm = TRUE), .groups = "drop")

stopifnot(nrow(regional) == 4)
regional
#> # A tibble: 4 x 3
#>   end_year region    total
#>      <dbl> <chr>     <dbl>
#> 1     2015 Coast     46807
#> 2     2015 Piedmont 147754
#> 3     2024 Coast     48559
#> 4     2024 Piedmont 138801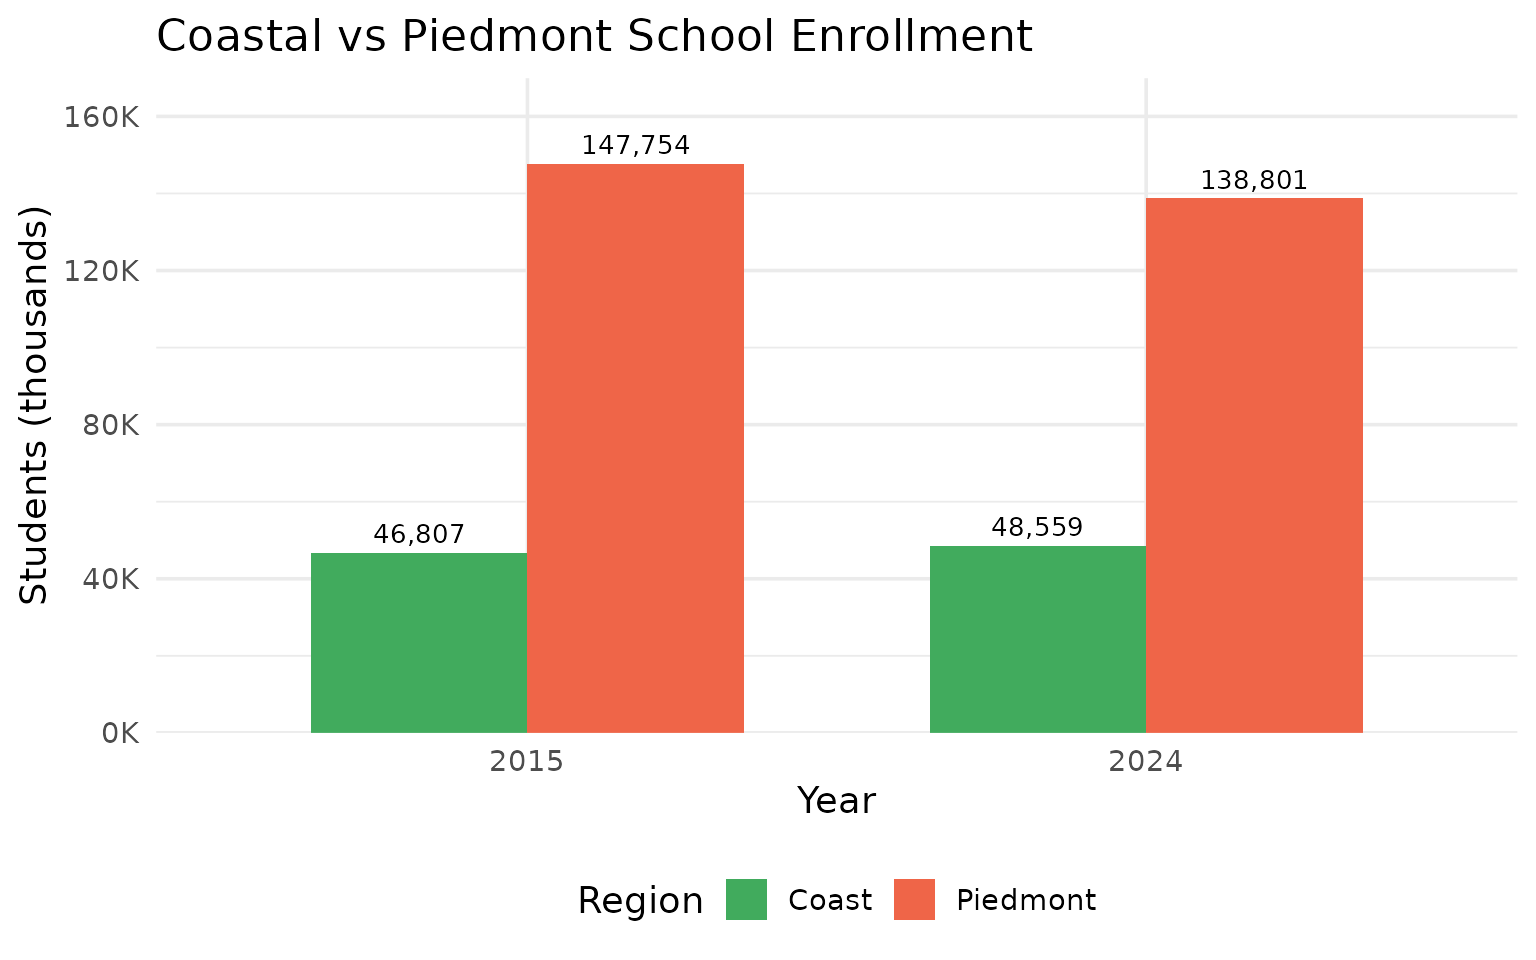
12. Union County grew 32% since 2006 on Charlotte suburban boom
Union County Public Schools went from 31,330 to 41,378 students. Weddington, Waxhaw, and Indian Trail fueled the growth, though the pace has slowed since 2015.
enr_union <- fetch_enr_multi(c(2006, 2010, 2015, 2020, 2024), use_cache = TRUE)

union_trend <- enr_union %>%
  filter(is_district, subgroup == "total_enrollment", grade_level == "TOTAL",
         grepl("Union", district_name)) %>%
  select(end_year, district_name, n_students)

stopifnot(nrow(union_trend) > 0)
union_trend
#> # A tibble: 5 x 3
#>   end_year district_name               n_students
#>      <dbl> <chr>                            <dbl>
#> 1     2006 Union County Public Schools      31330
#> 2     2010 Union County Public Schools      38282
#> 3     2015 Union County Public Schools      41296
#> 4     2020 Union County Public Schools      41452
#> 5     2024 Union County Public Schools      41378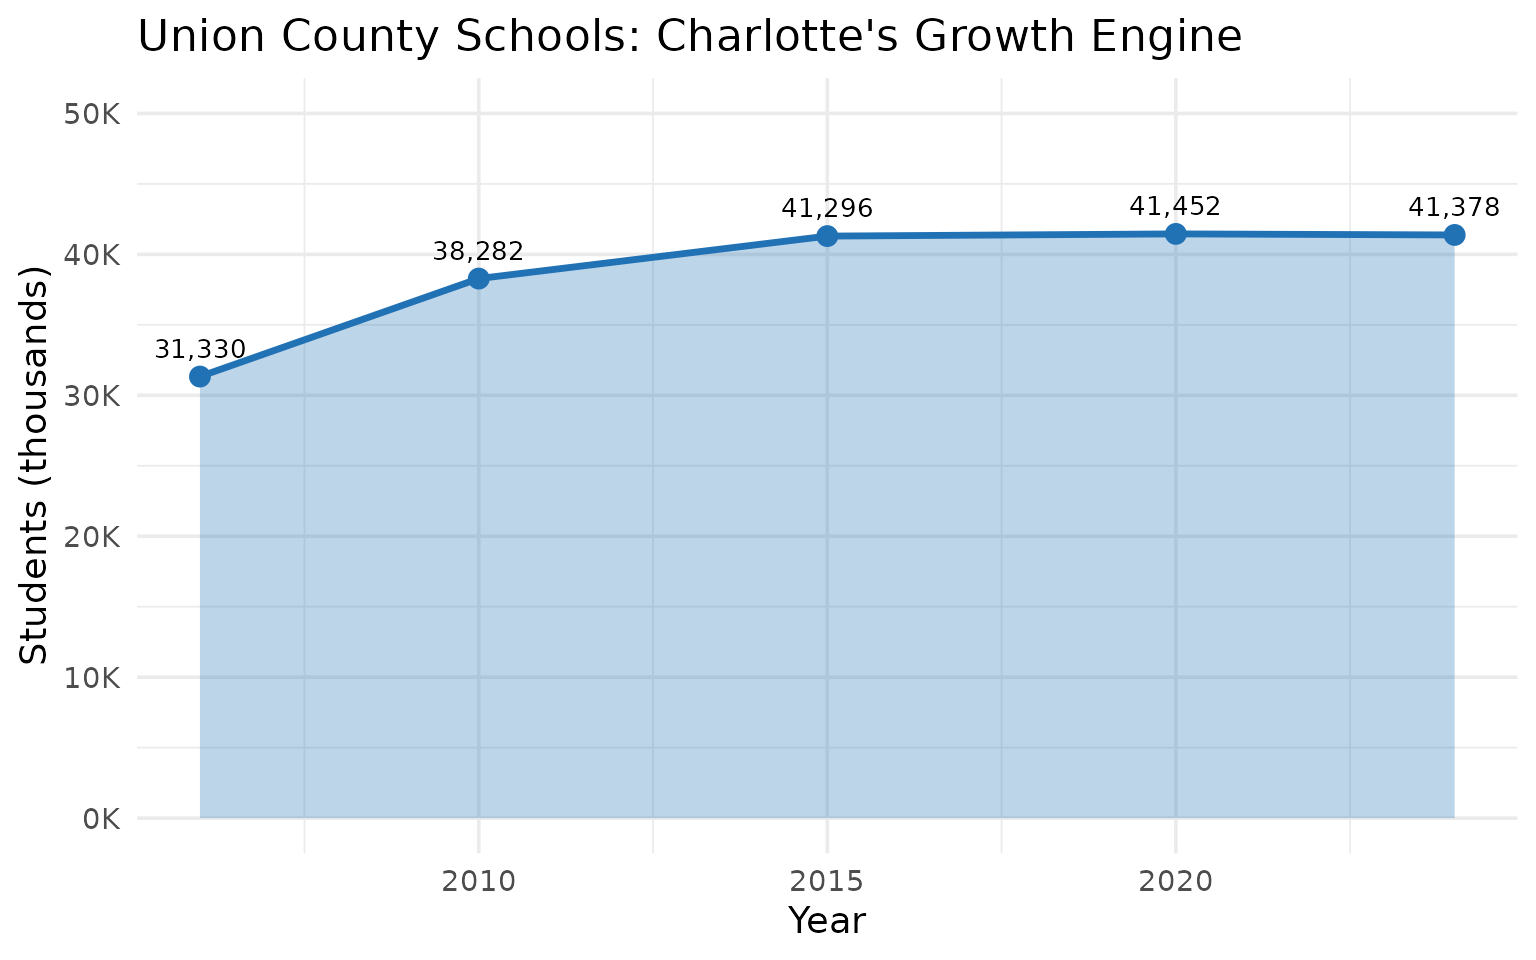
13. Asheville-area mountain counties lost 10% of students
Seven mountain counties around Asheville (Buncombe, Henderson, Haywood, Madison, Transylvania, Yancey, Mitchell) dropped from 55,623 to 49,817 students since 2015.
enr_mountain <- fetch_enr_multi(c(2015, 2024), use_cache = TRUE)

mountain <- c("Buncombe", "Henderson", "Haywood", "Madison",
              "Transylvania", "Yancey", "Mitchell")

mountain_data <- enr_mountain %>%
  filter(is_district, subgroup == "total_enrollment", grade_level == "TOTAL") %>%
  mutate(is_mountain = grepl(paste(mountain, collapse = "|"), district_name)) %>%
  filter(is_mountain) %>%
  group_by(end_year) %>%
  summarize(
    total = sum(n_students, na.rm = TRUE),
    n_districts = n(),
    .groups = "drop"
  )

stopifnot(nrow(mountain_data) == 2)
mountain_data
#> # A tibble: 2 x 3
#>   end_year total n_districts
#>      <dbl> <dbl>       <int>
#> 1     2015 55623           7
#> 2     2024 49817           7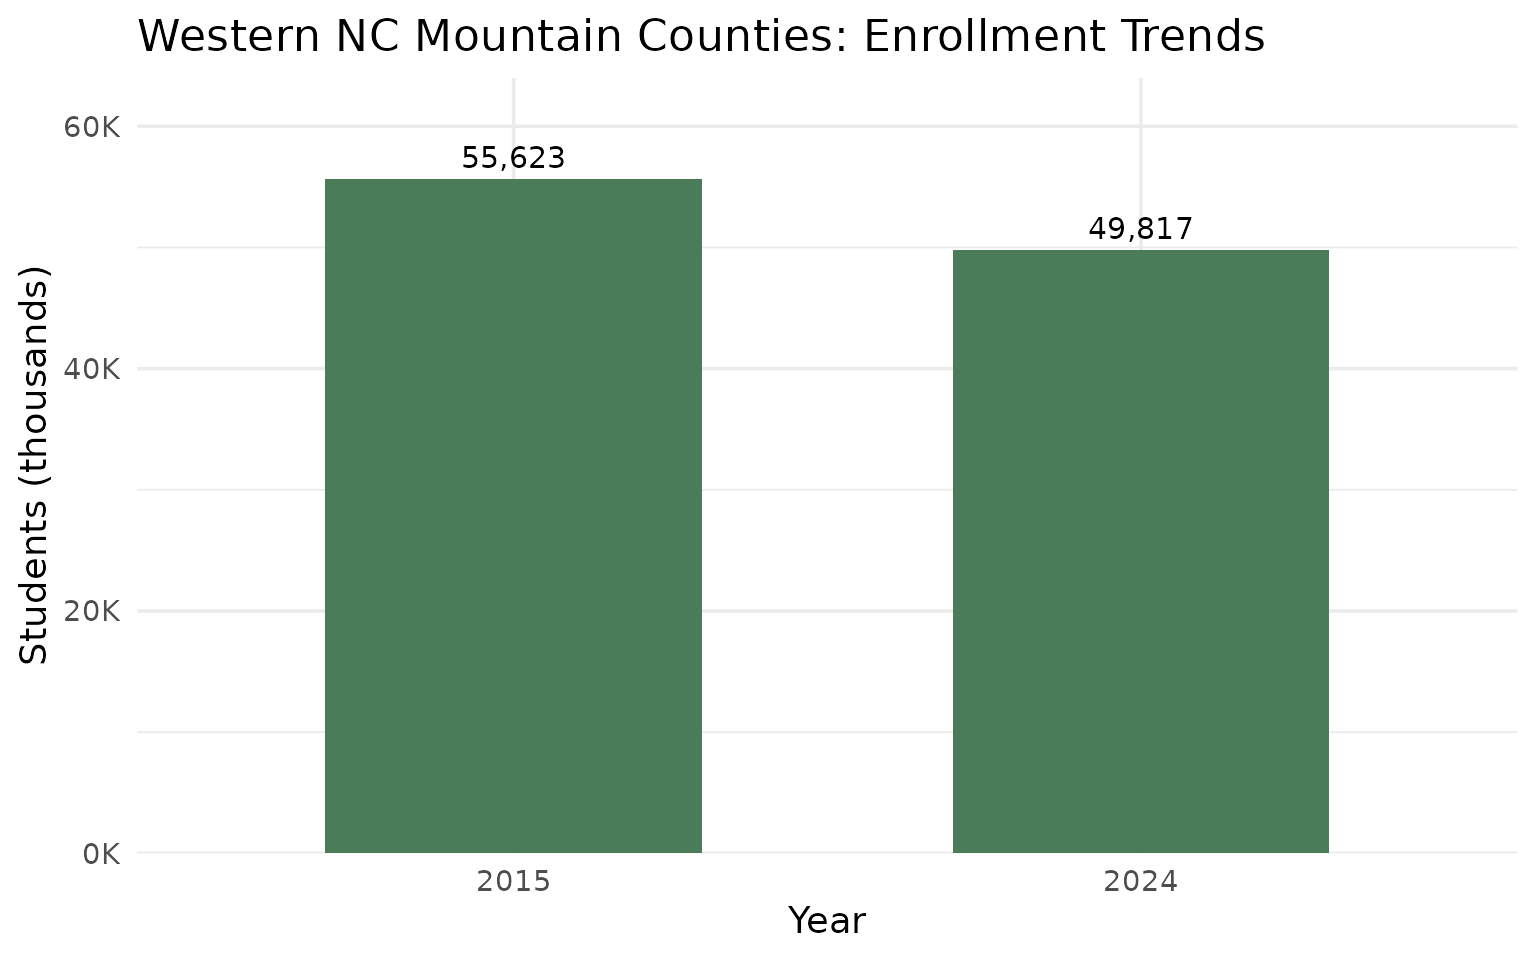
14. Special education holds steady at 13-14% of enrollment
NC’s special education population has been remarkably stable at around 13-14% of total enrollment since 2018, even as overall enrollment fluctuated with COVID.
enr_sped <- fetch_enr_multi(c(2018, 2019, 2020, 2021, 2024), use_cache = TRUE)

sped_trend <- enr_sped %>%
  filter(is_state, grade_level == "TOTAL",
         subgroup %in% c("total_enrollment", "special_ed")) %>%
  select(end_year, subgroup, n_students) %>%
  pivot_wider(names_from = subgroup, values_from = n_students) %>%
  mutate(
    pct_sped = round(special_ed / total_enrollment * 100, 1),
    sped_change = round((special_ed / first(special_ed) - 1) * 100, 1)
  )

stopifnot(nrow(sped_trend) > 0)
sped_trend
#> # A tibble: 5 x 5
#>   end_year total_enrollment special_ed pct_sped sped_change
#>      <dbl>            <dbl>      <dbl>    <dbl>       <dbl>
#> 1     2018          1521108     208352     13.7         0
#> 2     2019          1535687     211629     13.8         1.6
#> 3     2020          1525592     209750     13.7         0.7
#> 4     2021          1469401     204434     13.9        -1.9
#> 5     2024          1508194     202380     13.4        -2.9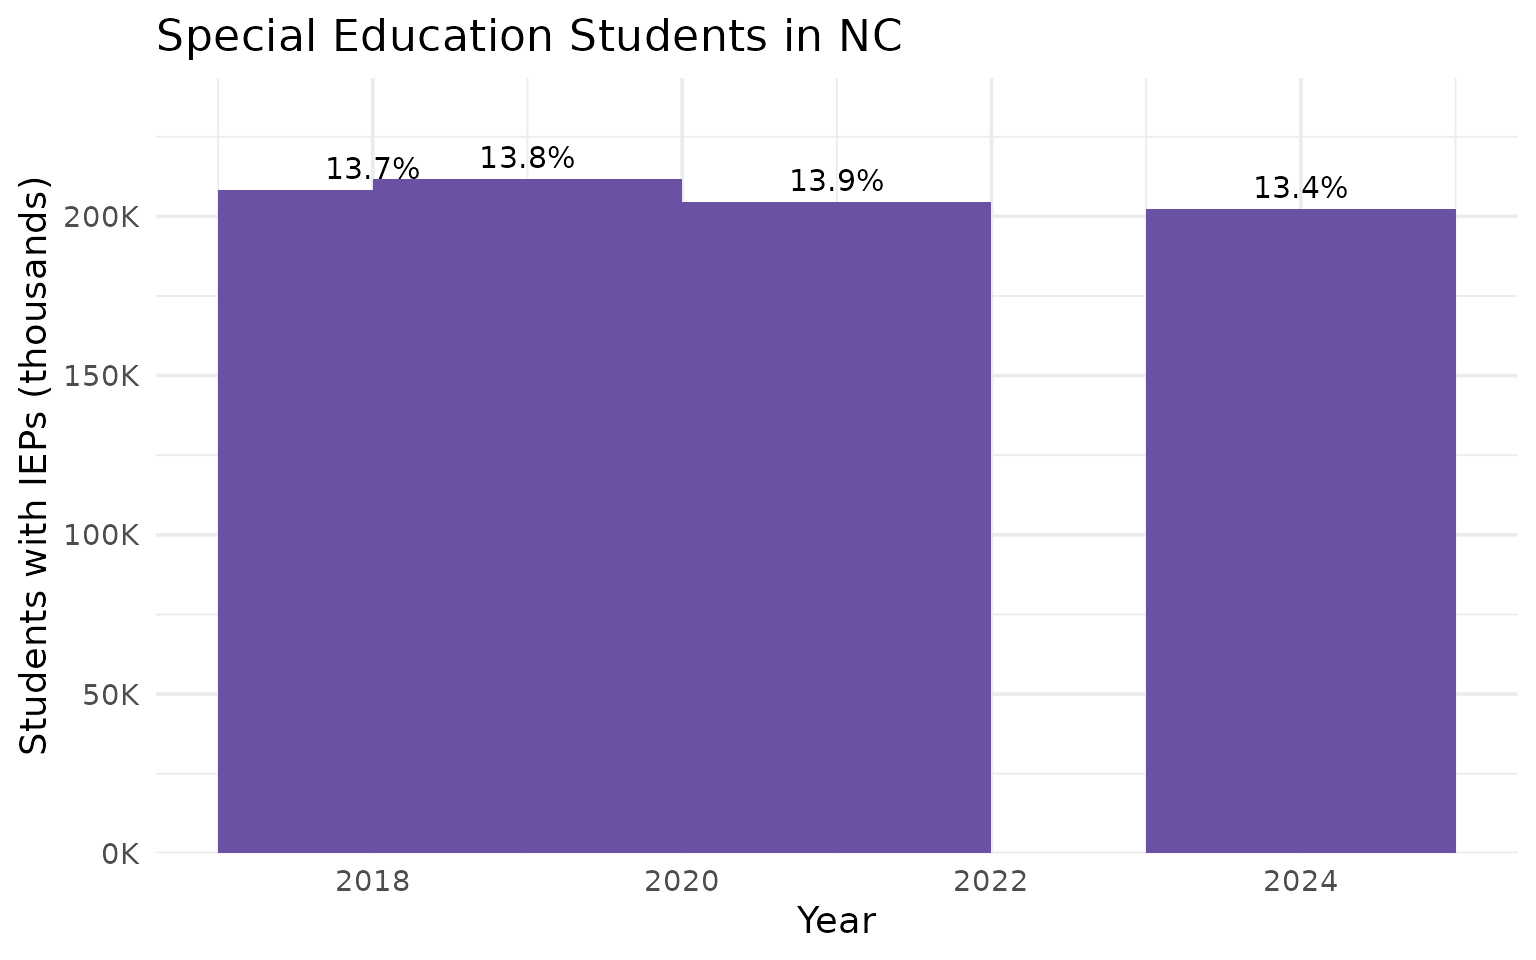
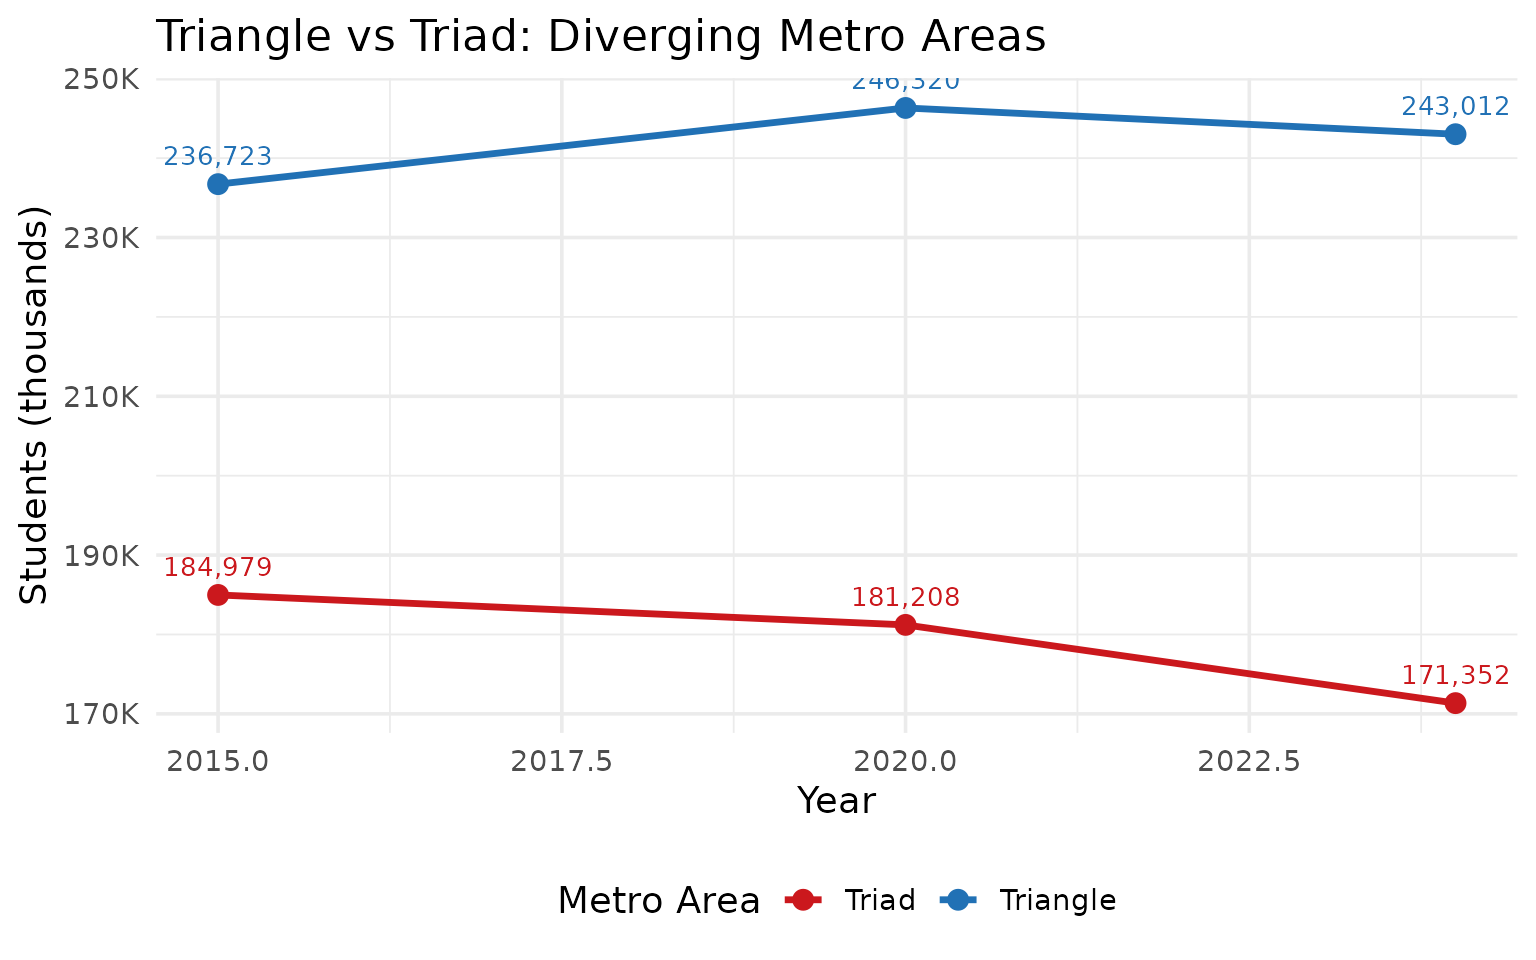
15. Triangle vs Triad: diverging metro areas
The Research Triangle (Wake, Durham, Orange, Johnston, Chatham) grew from 237K to 243K while the Piedmont Triad (Guilford, Forsyth, Davidson, Randolph, Alamance) shrank from 185K to 171K since 2015.
enr_metro <- fetch_enr_multi(c(2015, 2020, 2024), use_cache = TRUE)

triangle <- c("Wake", "Durham", "Orange", "Johnston", "Chatham")
triad <- c("Guilford", "Forsyth", "Davidson", "Randolph", "Alamance")

metro_data <- enr_metro %>%
  filter(is_district, subgroup == "total_enrollment", grade_level == "TOTAL") %>%
  mutate(region = case_when(
    grepl(paste(triangle, collapse = "|"), district_name) ~ "Triangle",
    grepl(paste(triad, collapse = "|"), district_name) ~ "Triad",
    TRUE ~ "Other"
  )) %>%
  filter(region %in% c("Triangle", "Triad")) %>%
  group_by(end_year, region) %>%
  summarize(total = sum(n_students, na.rm = TRUE), .groups = "drop")

stopifnot(nrow(metro_data) == 6)
metro_data
#> # A tibble: 6 x 3
#>   end_year region    total
#>      <dbl> <chr>     <dbl>
#> 1     2015 Triad    184979
#> 2     2015 Triangle 236723
#> 3     2020 Triad    181208
#> 4     2020 Triangle 246320
#> 5     2024 Triad    171352
#> 6     2024 Triangle 243012