1.4 million students. 580+ districts. 21 counties. 25+ years of data from the New Jersey Department of Education, in one clean R and Python interface.
Full documentation – all 15 stories with interactive charts, getting-started guide, and complete function reference.
Highlights
1. Charter enrollment grew 15% since 2020
New Jersey’s charter sector added 8,400+ students from 2020 to 2026, growing from 55,600 to 64,000 - and it kept growing in 2026 even as statewide enrollment fell.
library(njschooldata)
library(ggplot2)
library(dplyr)
library(scales)

years <- 2020:2026
enr_all <- purrr::map_df(years, ~{
  tryCatch(
    fetch_enr(.x, tidy = TRUE),
    error = function(e) {
      warning(paste("Year", .x, "failed:", conditionMessage(e)))
      NULL
    }
  )
})

charter_trend <- enr_all %>%
  filter(is_district, subgroup == "total_enrollment", grade_level == "TOTAL") %>%
  mutate(sector = ifelse(is_charter, "Charter", "Traditional")) %>%
  group_by(end_year, sector) %>%
  summarize(n_students = sum(n_students, na.rm = TRUE), .groups = "drop")

stopifnot(nrow(charter_trend) > 0)
charter_trend
#> # A tibble: 14 x 3
#>    end_year sector      n_students
#>       <dbl> <chr>            <dbl>
#>  1     2020 Charter         55604.
#>  2     2020 Traditional   1320225.
#>  3     2021 Charter         57480
#>  4     2021 Traditional   1304920
#>  5     2022 Charter         58776.
#>  6     2022 Traditional   1302140.
#>  7     2023 Charter         58568.
#>  8     2023 Traditional   1313352.
#>  9     2024 Charter         61295
#> 10     2024 Traditional   1318693
#> 11     2025 Charter         63810.
#> 12     2025 Traditional   1317372.
#> 13     2026 Charter         64037
#> 14     2026 Traditional   1293412.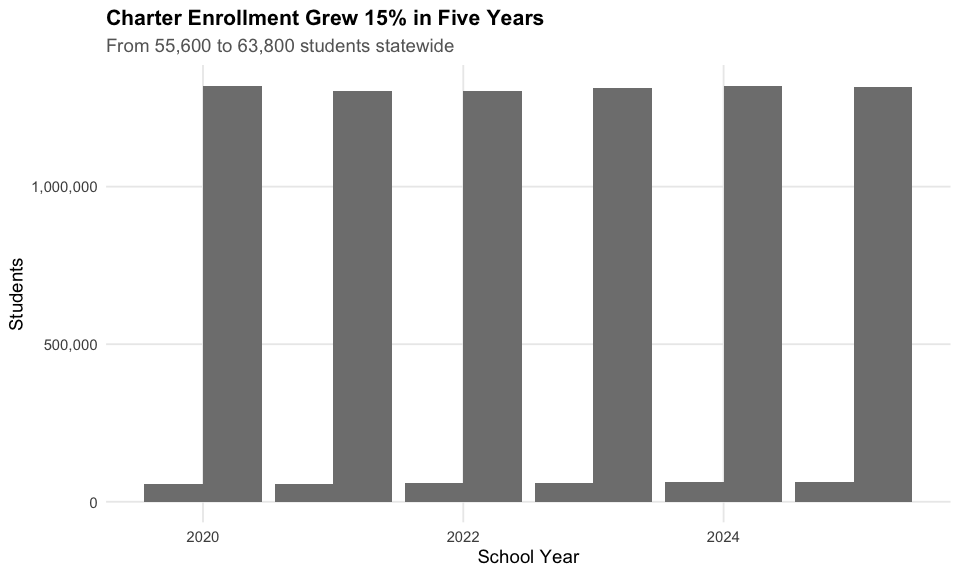
2. White students dropped below 37%
White students went from 42% to under 37% of NJ public school enrollment since 2020. NJ public schools are now decisively majority-minority.
# State-level summary aggregated from district totals for time-series consistency
state_summary <- enr_all %>%
  filter(is_district) %>%
  group_by(end_year, subgroup, grade_level) %>%
  summarize(n_students = sum(n_students, na.rm = TRUE), .groups = "drop")

state_totals <- state_summary %>%
  filter(subgroup == "total_enrollment") %>%
  select(end_year, grade_level, total = n_students)

state_summary <- state_summary %>%
  left_join(state_totals, by = c("end_year", "grade_level")) %>%
  mutate(pct = n_students / total)

demo <- state_summary %>%
  filter(subgroup %in% c("white", "hispanic", "black", "asian"),
         grade_level == "TOTAL") %>%
  mutate(subgroup = factor(subgroup, levels = c("white", "hispanic", "black", "asian")))

stopifnot(nrow(demo) > 0)
demo %>% select(end_year, subgroup, pct) %>%
  mutate(pct = round(pct * 100, 1)) %>%
  tidyr::pivot_wider(names_from = subgroup, values_from = pct)
#> # A tibble: 7 x 5
#>   end_year white hispanic black asian
#>      <dbl> <dbl>    <dbl> <dbl> <dbl>
#> 1     2020  42       30.3  14.6  10.3
#> 2     2021  40.6     31.1  14.9  10.4
#> 3     2022  39.6     32.1  14.8  10.3
#> 4     2023  38.5     33.2  14.6  10.3
#> 5     2024  37.6     34.1  14.4  10.3
#> 6     2025  36.7     35.0  14.3  10.3
#> 7     2026  36.5     35.2  14.1  10.4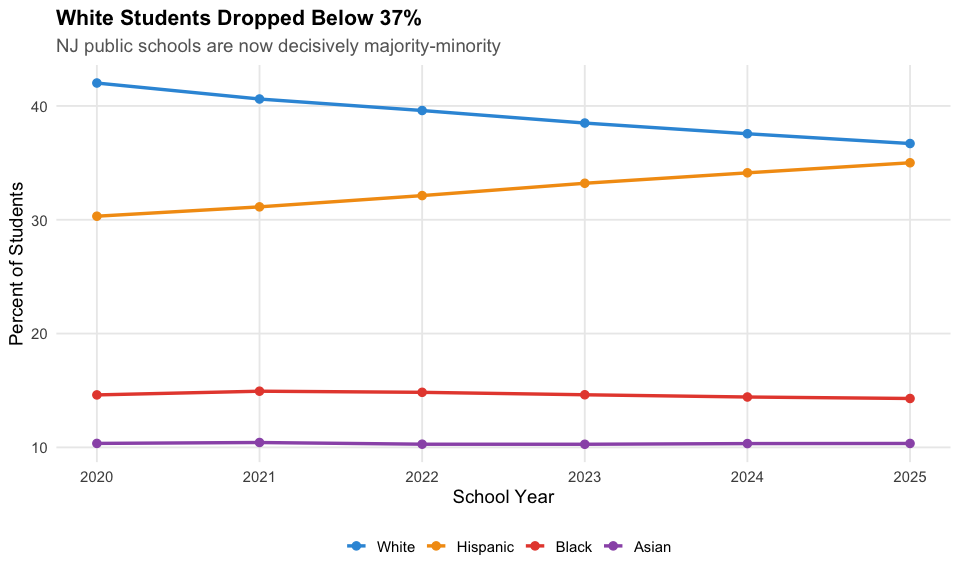
3. Kindergarten rebounded from COVID
New Jersey lost 9% of kindergartners during COVID. K enrollment recovered by 2024 but slipped again in 2026, while Pre-K kept surging past pre-pandemic levels.
k_trend <- state_summary %>%
  filter(subgroup == "total_enrollment",
         grade_level %in% c("PK", "K", "01", "06", "12")) %>%
  mutate(grade_label = case_when(
    grade_level == "PK" ~ "Pre-K",
    grade_level == "K" ~ "Kindergarten",
    grade_level == "01" ~ "Grade 1",
    grade_level == "06" ~ "Grade 6",
    grade_level == "12" ~ "Grade 12",
    TRUE ~ grade_level
  ))

stopifnot(nrow(k_trend) > 0)
k_trend %>%
  filter(grade_level %in% c("K", "PK")) %>%
  select(end_year, grade_label, n_students)
#> # A tibble: 14 x 3
#>    end_year grade_label  n_students
#>       <dbl> <chr>             <dbl>
#>  1     2020 Kindergarten      90818
#>  2     2020 Pre-K             45013
#>  3     2021 Kindergarten      82604
#>  4     2021 Pre-K             56396
#>  5     2022 Kindergarten      86202
#>  6     2022 Pre-K             65350
#>  7     2023 Kindergarten      85873
#>  8     2023 Pre-K             71615
#>  9     2024 Kindergarten      90783
#> 10     2024 Pre-K             83463
#> 11     2025 Kindergarten      89428
#> 12     2025 Pre-K             87231
#> 13     2026 Kindergarten      86554
#> 14     2026 Pre-K             88063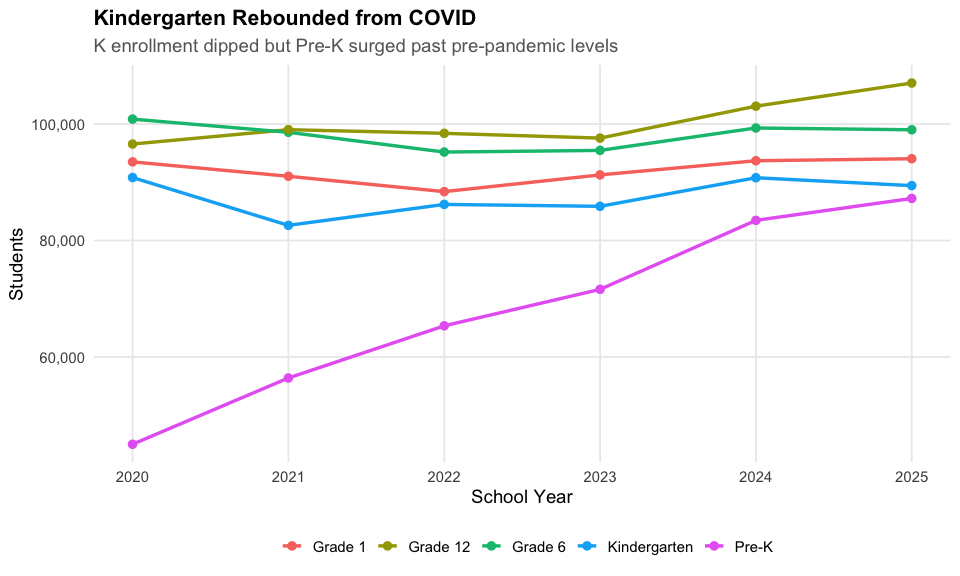
Data Taxonomy
| Category | Years | Function | Details |
|---|---|---|---|
| Enrollment | 2000-2026 | fetch_enr() |
State, county, district, school. Race, gender, FRPL, LEP, migrant |
| Assessments | 2004-2024 |
fetch_parcc() / fetch_njask() / fetch_njgpa()
|
NJSLA, PARCC, NJASK, HSPA, GEPA. ELA, Math, Science |
| Graduation | 2011-2024 |
fetch_grad_rate() / fetch_grad_count()
|
4-yr and 6-yr ACGR. District and school level |
| Directory | Current |
get_school_directory() / get_district_directory()
|
Names, IDs, addresses, school type |
| Per-Pupil Spending | – | – | Not yet available |
| Accountability | 2018+ |
fetch_essa_status() / fetch_essa_progress()
|
CSI/TSI lists, ESSA indicators |
| Chronic Absence | 2017-2024 |
fetch_absence() / fetch_chronic_absenteeism() / fetch_days_absent()
|
By grade, by demographic. Cross-state standard via fetch_absence()
|
| EL Progress | 2022-2024 | fetch_access() |
WIDA ACCESS for ELLs |
| Special Ed | 2024+ | fetch_sped() |
Classification rates by disability category |
| Discipline | Available |
fetch_disciplinary_removals() / fetch_violence_vandalism_hib()
|
Suspensions, expulsions, HIB incidents |
| Staff | Available |
fetch_staff_demographics() / fetch_teacher_experience()
|
Demographics, experience, ratios |
| College-Going | Available |
fetch_postsecondary() / fetch_sat_participation() / fetch_ap_participation()
|
Postsecondary enrollment, SAT, AP |
| Courses | Available |
fetch_math_course_enrollment() / fetch_cs_enrollment()
|
Math, science, CS, arts, world languages |
| CTE | Available |
fetch_cte_participation() / fetch_industry_credentials()
|
Career pathways, credentials, apprenticeships |
See the full data category taxonomy
Quick Start
R
# Install from GitHub
remotes::install_github("almartin82/njschooldata")
library(njschooldata)

# Enrollment data
enr_2026 <- fetch_enr(2026, tidy = TRUE)

# Assessment data
math_g4 <- fetch_parcc(2024, grade_or_subj = 4, subj = 'math')

# Graduation rates
grate <- fetch_grad_rate(2024)

# School directory
schools <- get_school_directory()Explore More
Full analysis with 15 stories:
- NJ Enrollment Insights – 15 stories covering charter growth, demographics, COVID recovery, poverty gaps, and more
- Getting Started – installation, data fetching, and tidy format guide
- Function reference
Data Notes
Source: New Jersey Department of Education – all data comes directly from NJ DOE, not federal sources.
Available years: Enrollment data from 2000-2026. Tidy format (2020+) provides consistent structure with district, charter, and school-level records. Assessments from 2004-2024 span four different testing systems (GEPA, NJASK, PARCC, NJSLA).
Suppression rules: NJ DOE suppresses counts below 10 in some data types. Enrollment data uses half-day weighting for programs like pre-K, which can produce non-integer counts.
Census Day: NJ enrollment counts are based on October 15 enrollment (ASSA reporting).
Known caveats: - 2020+ enrollment data includes state-level rows but the vignette aggregates from district-level for time-series consistency - Charter schools appear as separate “districts” in the data - Pre-2020 and post-2020 data formats differ significantly
Deeper Dive
4. New Jersey educates 1.4 million students
New Jersey has one of the largest public school systems in the country. Enrollment recovered from the COVID dip to a 2025 peak, then fell about 1.7% in 2026 - the first real decline in years.
state_total <- state_summary %>%
  filter(subgroup == "total_enrollment", grade_level == "TOTAL")

stopifnot(nrow(state_total) > 0)
state_total
#> # A tibble: 7 x 6
#>   end_year subgroup         grade_level n_students   total   pct
#>      <dbl> <chr>            <chr>            <dbl>   <dbl> <dbl>
#> 1     2020 total_enrollment TOTAL         1375828. 1375828.    1
#> 2     2021 total_enrollment TOTAL         1362400  1362400     1
#> 3     2022 total_enrollment TOTAL         1360916  1360916     1
#> 4     2023 total_enrollment TOTAL         1371921  1371921     1
#> 5     2024 total_enrollment TOTAL         1379988  1379988     1
#> 6     2025 total_enrollment TOTAL         1381182  1381182     1
#> 7     2026 total_enrollment TOTAL         1357450. 1357450.    1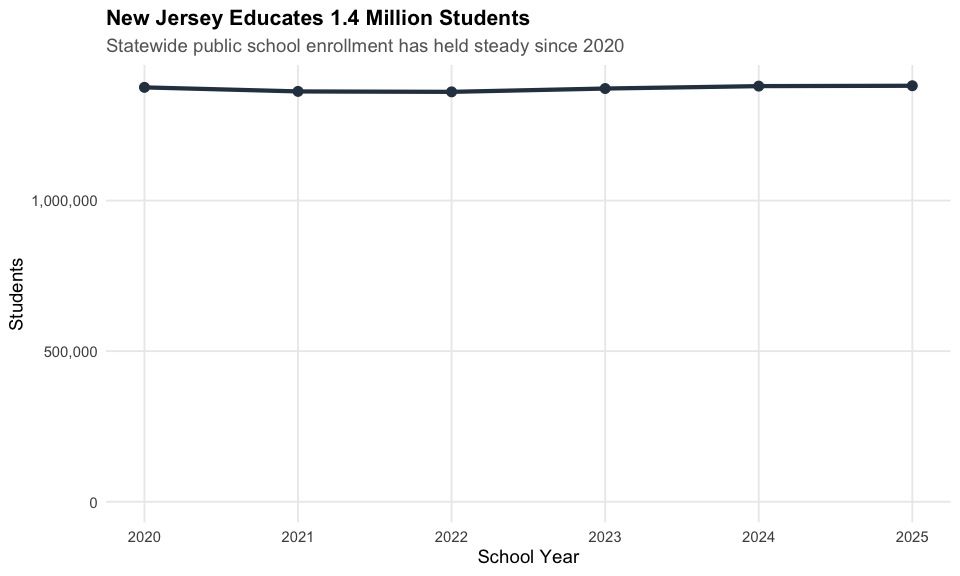
5. Hispanic students hit 35% and rising
Hispanic enrollment surged from 30% to 35% of all NJ students since 2020, one of the fastest demographic shifts in state history.
hispanic <- state_summary %>%
  filter(subgroup == "hispanic", grade_level == "TOTAL")

stopifnot(nrow(hispanic) > 0)
hispanic %>% select(end_year, n_students, pct)
#> # A tibble: 7 x 3
#>   end_year n_students   pct
#>      <dbl>      <dbl> <dbl>
#> 1     2020    417042. 0.303
#> 2     2021    424170. 0.311
#> 3     2022    437187  0.321
#> 4     2023    455576. 0.332
#> 5     2024    470906  0.341
#> 6     2025    483504. 0.350
#> 7     2026    477187  0.352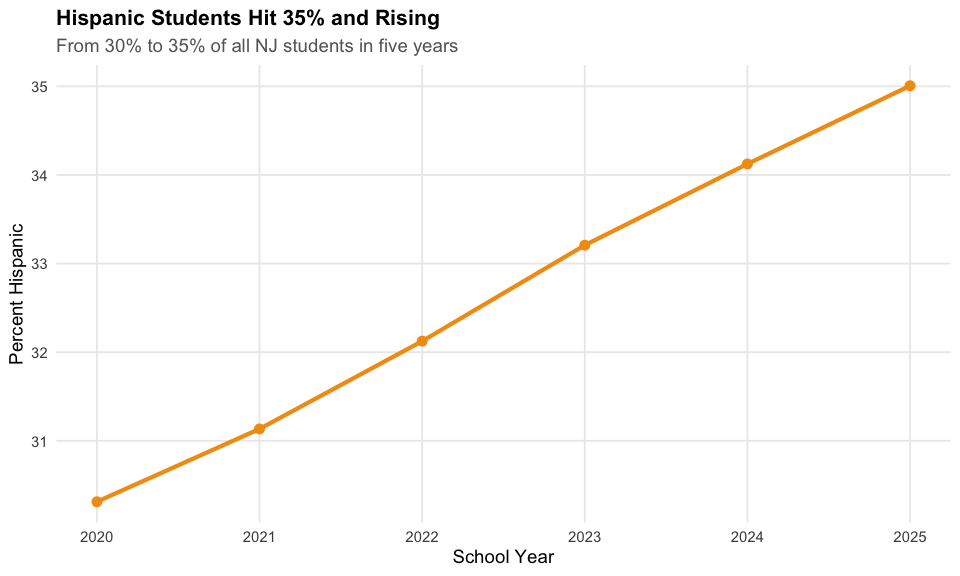
6. The Big Three: Newark, Jersey City, and Paterson
New Jersey’s three largest traditional districts educate over 90,000 students combined - nearly 7% of the state.
big_three_names <- c("Newark Public School District",
                     "Jersey City Public Schools",
                     "Paterson Public School District")
big_three_trend <- enr_all %>%
  filter(is_district, !is_charter,
         district_name %in% big_three_names,
         subgroup == "total_enrollment", grade_level == "TOTAL")

stopifnot(nrow(big_three_trend) > 0)
big_three_trend %>% select(end_year, district_name, n_students)
#> # A tibble: 18 x 3
#>    end_year district_name                   n_students
#>       <dbl> <chr>                                <dbl>
#>  1     2021 Newark Public School District        40085
#>  2     2021 Jersey City Public Schools           26541
#>  3     2021 Paterson Public School District      25657
#>  4     2022 Newark Public School District        40607
#>  5     2022 Jersey City Public Schools           26890
#>  6     2022 Paterson Public School District      24495
#>  7     2023 Newark Public School District        41430
#>  8     2023 Jersey City Public Schools           26418
#>  9     2023 Paterson Public School District      26067
#> 10     2024 Newark Public School District        42600
#> 11     2024 Jersey City Public Schools           26023
#> 12     2024 Paterson Public School District      24090
#> 13     2025 Newark Public School District        43980
#> 14     2025 Jersey City Public Schools           25692
#> 15     2025 Paterson Public School District      23609
#> 16     2026 Newark Public School District        43216
#> 17     2026 Jersey City Public Schools           25307
#> 18     2026 Paterson Public School District      21849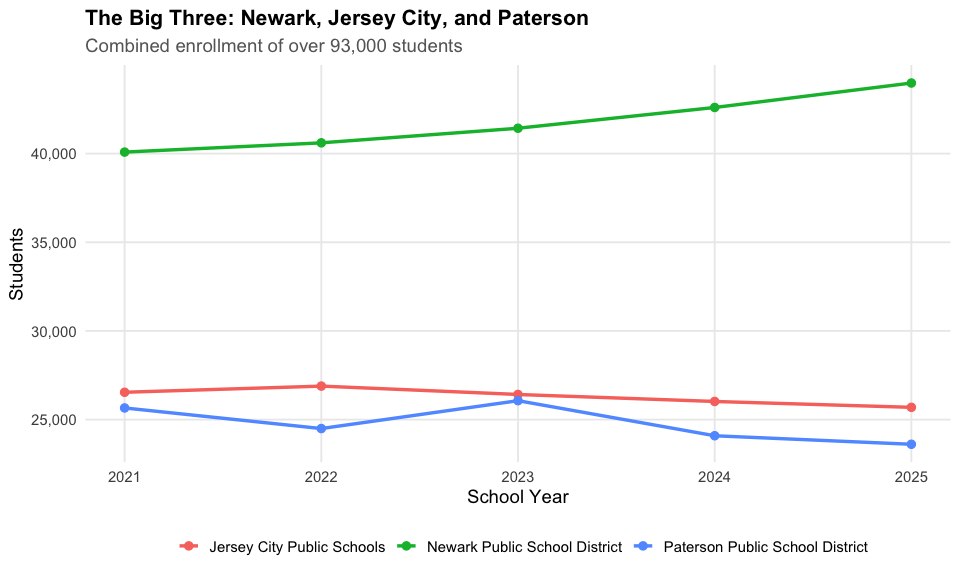
7. Free/reduced lunch ranges from 98% to under 5%
Urban districts like Passaic City (92%) have nearly all students on free/reduced lunch while affluent suburbs like Millburn (under 2%) have almost none - a stark measure of NJ’s wealth divide.
enr_current <- fetch_enr(2026, tidy = TRUE)

frl <- enr_current %>%
  filter(is_district, !is_charter,
         subgroup == "free_reduced_lunch", grade_level == "TOTAL",
         !is.na(pct), n_students >= 100) %>%
  arrange(desc(pct)) %>%
  head(15) %>%
  mutate(district_label = reorder(district_name, pct))

stopifnot(nrow(frl) > 0)
frl %>% select(district_name, n_students, pct)
#> # A tibble: 15 x 3
#>    district_name                                             n_students   pct
#>    <chr>                                                          <dbl> <dbl>
#>  1 Kipp: Cooper Norcross, A New Jersey Nonprofit Corporation      2132. 0.98
#>  2 Mastery Schools Of Camden, Inc.                                2788. 0.95
#>  3 Camden Prep, Inc.                                              1425. 0.937
#>  4 Passaic City School District                                  10132. 0.918
#>  5 Lakewood Township School District                              3381. 0.898
#>  6 Woodlynne School District                                       343  0.875
#>  7 Union City School District                                    10409. 0.867
#>  8 Seaside Heights School District                                 127. 0.847
#>  9 Atlantic City School District                                  5104. 0.839
#> 10 New Brunswick School District                                  6929. 0.838
#> 11 Wildwood City School District                                   629. 0.831
#> 12 Elizabeth Public Schools                                      22034. 0.825
#> 13 West New York School District                                  6070. 0.821
#> 14 Long Branch Public School District                             4069. 0.819
#> 15 Bridgeton City School District                                 5013. 0.799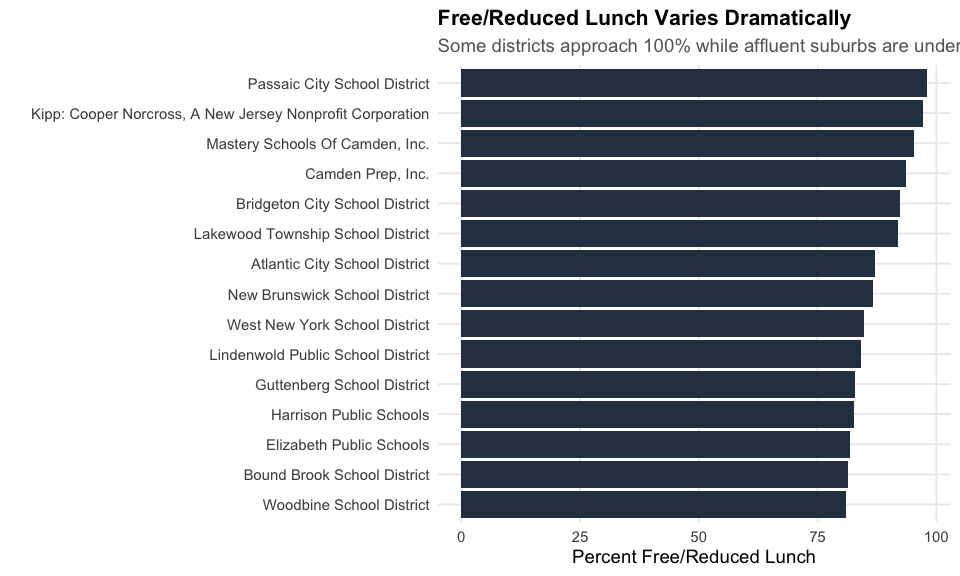
8. English learners approach 45% in some districts
ELL students make up nearly 45% in Lakewood and Plainfield but under 1% in most suburban districts - a concentration driven by immigration patterns.
ell <- enr_current %>%
  filter(is_district, !is_charter,
         subgroup == "lep", grade_level == "TOTAL",
         !is.na(pct), n_students >= 50) %>%
  arrange(desc(pct)) %>%
  head(15) %>%
  mutate(district_label = reorder(district_name, pct))

stopifnot(nrow(ell) > 0)
ell %>% select(district_name, n_students, pct)
#> # A tibble: 15 x 3
#>    district_name                           n_students   pct
#>    <chr>                                        <dbl> <dbl>
#>  1 Lakewood Township School District            1691. 0.449
#>  2 Plainfield Public School District            4153. 0.436
#>  3 Dover Public School District                 1375. 0.434
#>  4 Irvington Public School District             3315. 0.421
#>  5 Elizabeth Public Schools                    11057. 0.414
#>  6 New Brunswick School District                3365. 0.407
#>  7 Paterson Public School District              8849. 0.405
#>  8 Trenton Public School District               5795. 0.403
#>  9 Red Bank Borough Public School District       453. 0.396
#> 10 Union City School District                   4694. 0.391
#> 11 Perth Amboy Public School District           3820. 0.383
#> 12 Passaic City School District                 4084. 0.37
#> 13 Bridgeton City School District               2309. 0.368
#> 14 Bound Brook School District                   650. 0.343
#> 15 Palisades Park School District                560. 0.331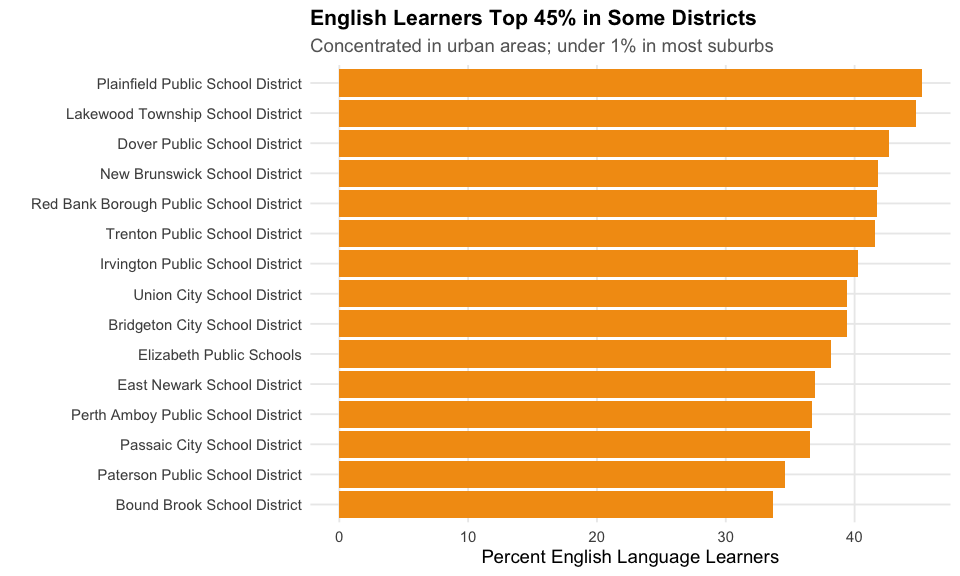
9. Top 10 districts serve 15% of all students
Just 10 out of nearly 580 districts educate about 1 in 7 NJ students. Newark alone has 43,000.
top_10 <- enr_current %>%
  filter(is_district, !is_charter,
         subgroup == "total_enrollment", grade_level == "TOTAL") %>%
  arrange(desc(n_students)) %>%
  head(10) %>%
  mutate(district_label = reorder(district_name, n_students))

stopifnot(nrow(top_10) > 0)
top_10 %>% select(district_name, n_students)
#> # A tibble: 10 x 2
#>    district_name                            n_students
#>    <chr>                                         <dbl>
#>  1 Newark Public School District                43216
#>  2 Elizabeth Public Schools                     26708
#>  3 Jersey City Public Schools                   25307
#>  4 Paterson Public School District              21849
#>  5 Edison Township School District              16191
#>  6 Trenton Public School District               14380.
#>  7 Toms River Regional School District          13925
#>  8 Woodbridge Township School District          13425
#>  9 Hamilton Township Public School District     12112
#> 10 Union City School District                   12006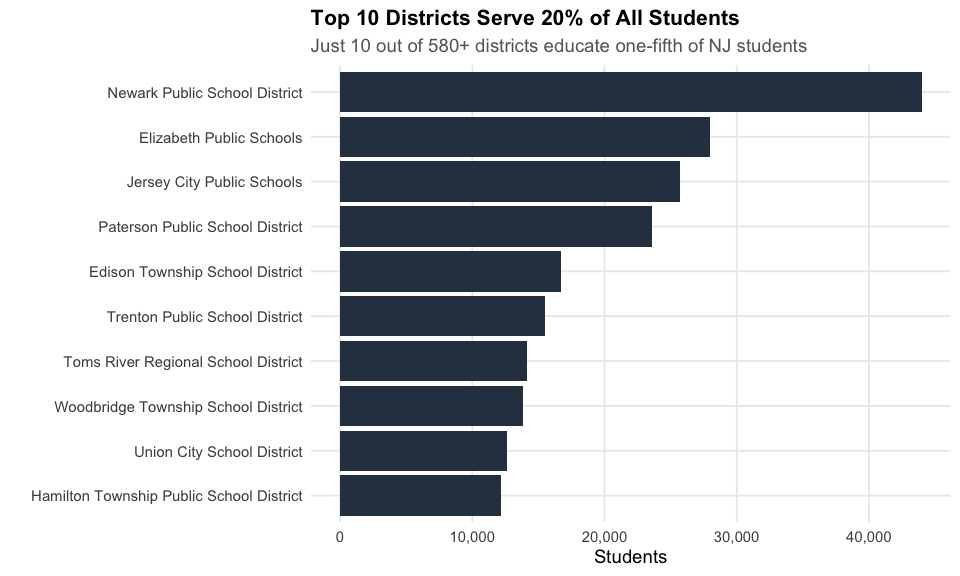
10. Multiracial students: fastest-growing category
Multiracial students grew 46% since 2020 - from 2.4% to 3.5% of enrollment - making it the fastest-growing racial category in NJ.
multi <- state_summary %>%
  filter(subgroup == "multiracial", grade_level == "TOTAL")

stopifnot(nrow(multi) > 0)
multi %>% select(end_year, n_students, pct)
#> # A tibble: 7 x 3
#>   end_year n_students    pct
#>      <dbl>      <dbl>  <dbl>
#> 1     2020     32622  0.0237
#> 2     2021     34518  0.0253
#> 3     2022     37474  0.0275
#> 4     2023     40934. 0.0298
#> 5     2024     43436. 0.0315
#> 6     2025     45246. 0.0327
#> 7     2026     47160  0.0347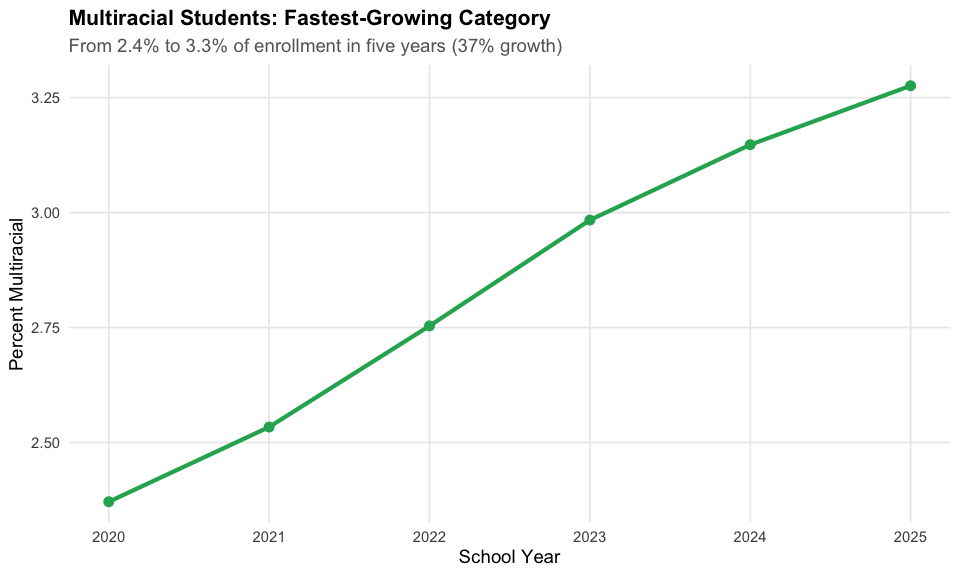
11. Pre-K nearly doubled since 2020
NJ’s Pre-K enrollment surged from 45,000 to 88,000 since 2020 - nearly doubling, fueled by the state’s expanding universal pre-K program.
prek <- state_summary %>%
  filter(subgroup == "total_enrollment", grade_level == "PK")

stopifnot(nrow(prek) > 0)
prek %>% select(end_year, n_students)
#> # A tibble: 7 x 2
#>   end_year n_students
#>      <dbl>      <dbl>
#> 1     2020      45013
#> 2     2021      56396
#> 3     2022      65350
#> 4     2023      71615
#> 5     2024      83463
#> 6     2025      87231
#> 7     2026      88063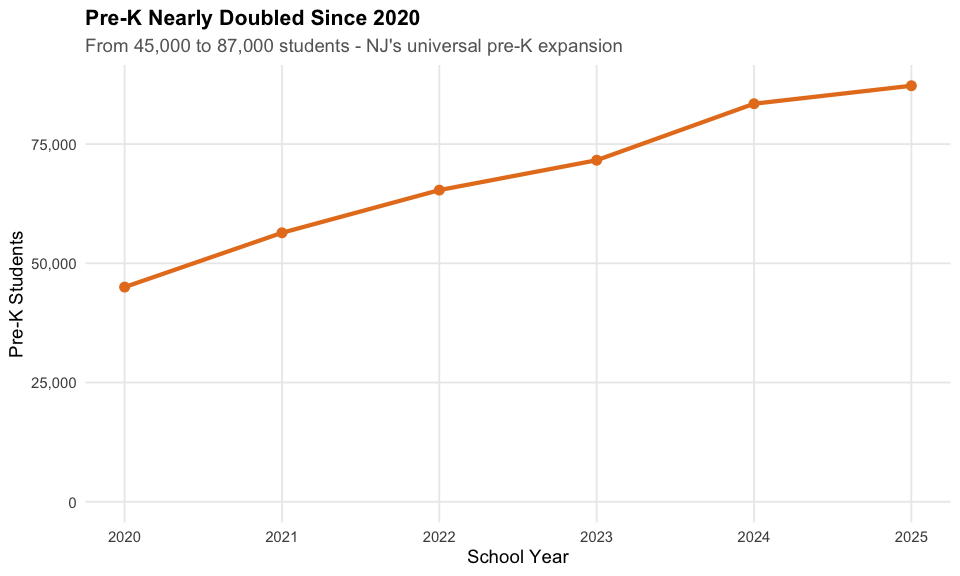
12. Bergen County has more students than several US states
With 130,000+ students, Bergen County alone has a larger public school system than entire states like Wyoming, Vermont, and North Dakota.
county_enr <- enr_current %>%
  filter(is_district, subgroup == "total_enrollment", grade_level == "TOTAL") %>%
  group_by(county_name) %>%
  summarize(n_students = sum(n_students, na.rm = TRUE),
            n_districts = n(), .groups = "drop") %>%
  filter(county_name != "Charters") %>%
  arrange(desc(n_students)) %>%
  head(15) %>%
  mutate(county_label = reorder(county_name, n_students))

stopifnot(nrow(county_enr) > 0)
county_enr
#> # A tibble: 15 x 4
#>    county_name n_students n_districts county_label
#>    <chr>            <dbl>       <int> <fct>
#>  1 Bergen        130172.          76 Bergen
#>  2 Essex         125813           23 Essex
#>  3 Middlesex     121810.          25 Middlesex
#>  4 Union          95696.          23 Union
#>  5 Monmouth       87674           51 Monmouth
#>  6 Hudson         80614           13 Hudson
#>  7 Camden         77633           39 Camden
#>  8 Passaic        73151           20 Passaic
#>  9 Morris         72082           40 Morris
#> 10 Burlington     68970           39 Burlington
#> 11 Ocean          63832.          28 Ocean
#> 12 Mercer         58960           12 Mercer
#> 13 Somerset       48696.          19 Somerset
#> 14 Gloucester     46076.          28 Gloucester
#> 15 Atlantic       40586           24 Atlantic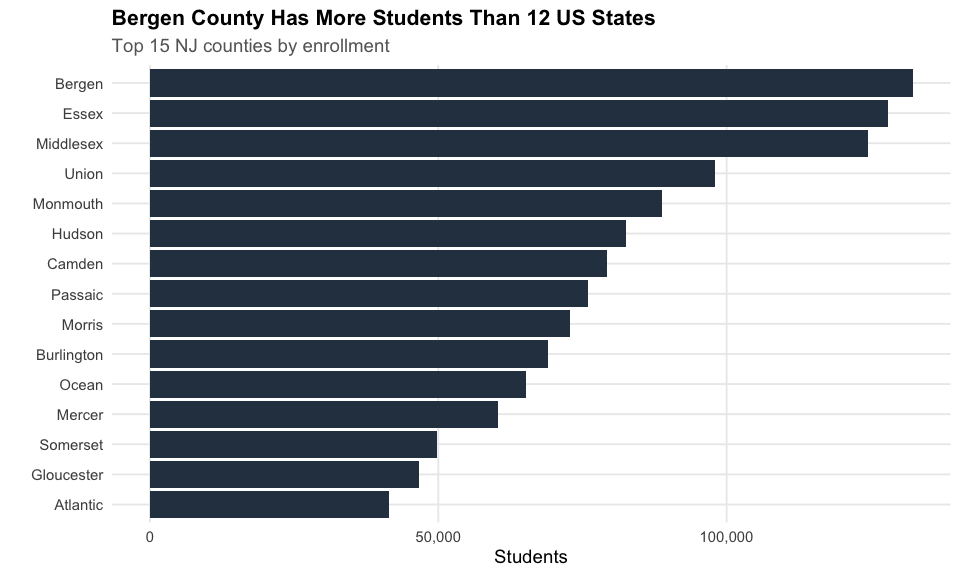
13. Most NJ districts are tiny
Half of NJ’s 580 districts have fewer than 1,200 students. The median district is smaller than a single large high school.
dist_sizes <- enr_current %>%
  filter(is_district, !is_charter,
         subgroup == "total_enrollment", grade_level == "TOTAL")

stopifnot(nrow(dist_sizes) > 0)
cat("Districts:", nrow(dist_sizes), "\n")
#> Districts: 579
cat("Median:", median(dist_sizes$n_students, na.rm = TRUE), "\n")
#> Median: 1162
cat("Under 1000:", sum(dist_sizes$n_students < 1000, na.rm = TRUE), "\n")
#> Under 1000: 266
cat("Over 10000:", sum(dist_sizes$n_students > 10000, na.rm = TRUE), "\n")
#> Over 10000: 14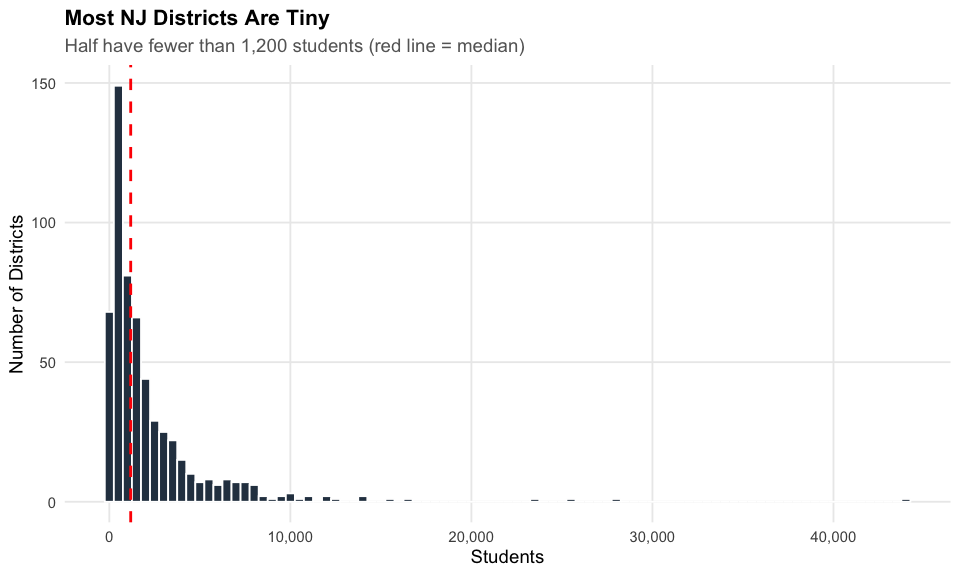
14. NJ’s enrollment pyramid shows the pre-K boom
The 2026 grade-level distribution reveals the pre-K surge: PK enrollment (88K) has now surpassed Kindergarten (87K), reflecting NJ’s universal pre-K push.
grade_enr <- state_summary %>%
  filter(end_year == 2026, subgroup == "total_enrollment",
         grade_level != "TOTAL", !is.na(grade_level)) %>%
  mutate(grade_label = case_when(
    grade_level == "PK" ~ "Pre-K",
    grade_level == "K" ~ "K",
    TRUE ~ paste("Grade", grade_level)
  ),
  grade_order = case_when(
    grade_level == "PK" ~ 0,
    grade_level == "K" ~ 1,
    TRUE ~ as.numeric(grade_level) + 1
  )) %>%
  arrange(grade_order) %>%
  mutate(grade_label = factor(grade_label, levels = grade_label))

stopifnot(nrow(grade_enr) > 0)
grade_enr %>% select(grade_label, n_students)
#> # A tibble: 14 x 2
#>    grade_label n_students
#>    <fct>            <dbl>
#>  1 Pre-K            88063
#>  2 K                86554
#>  3 Grade 01         91396
#>  4 Grade 02         93705
#>  5 Grade 03         94599
#>  6 Grade 04         97367
#>  7 Grade 05         96650
#>  8 Grade 06         97968
#>  9 Grade 07         98315
#> 10 Grade 08         99814
#> 11 Grade 09        102207
#> 12 Grade 10        102068.
#> 13 Grade 11        102865
#> 14 Grade 12        105879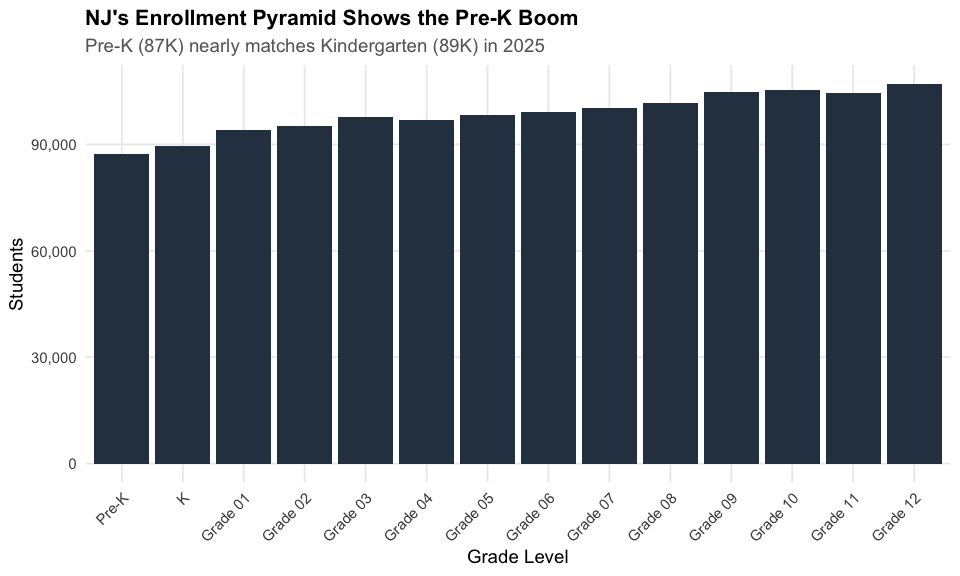
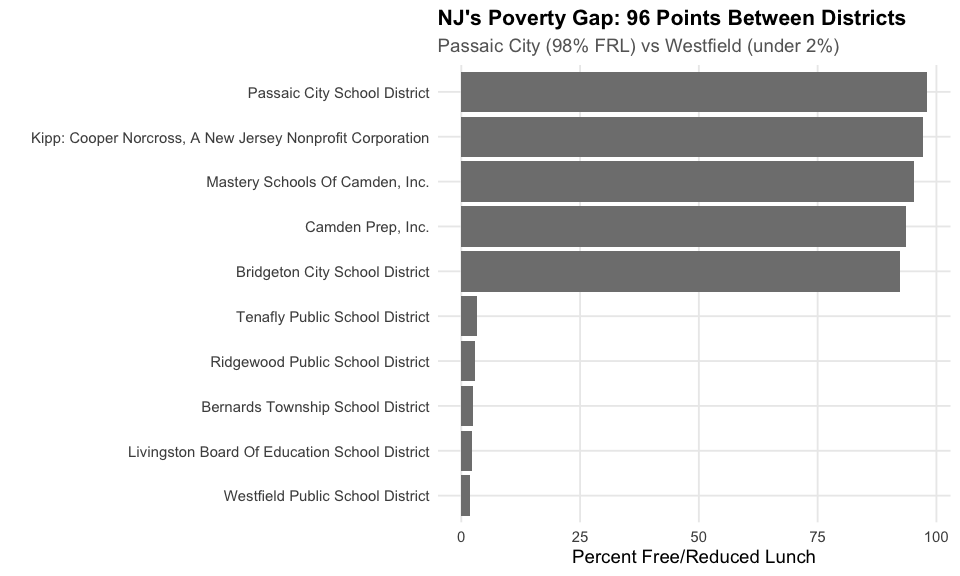
15. NJ’s poverty gap: 96 points between districts
The highest-poverty NJ districts have 98% of students on free/reduced lunch. Affluent Westfield has under 2%. This 96-point gap captures NJ’s extreme wealth inequality.
frl_all <- enr_current %>%
  filter(is_district, !is_charter,
         subgroup == "free_reduced_lunch", grade_level == "TOTAL",
         !is.na(pct), n_students >= 100) %>%
  arrange(desc(pct))

top_5 <- frl_all %>% head(5) %>% mutate(group = "Highest FRL")
bottom_5 <- frl_all %>% tail(5) %>% mutate(group = "Lowest FRL")
frl_extremes <- bind_rows(top_5, bottom_5) %>%
  mutate(district_label = reorder(district_name, pct))

stopifnot(nrow(frl_extremes) > 0)
frl_extremes %>% select(district_name, n_students, pct, group)
#> # A tibble: 10 x 4
#>    district_name                                             n_students   pct group
#>    <chr>                                                          <dbl> <dbl> <chr>
#>  1 Kipp: Cooper Norcross, A New Jersey Nonprofit Corporation      2132. 0.98  Highest FRL
#>  2 Mastery Schools Of Camden, Inc.                                2788. 0.95  Highest FRL
#>  3 Camden Prep, Inc.                                              1425. 0.937 Highest FRL
#>  4 Passaic City School District                                  10132. 0.918 Highest FRL
#>  5 Lakewood Township School District                              3381. 0.898 Highest FRL
#>  6 Pequannock Township School District                             100. 0.05  Lowest FRL
#>  7 Scotch Plains-Fanwood School District                           269. 0.047 Lowest FRL
#>  8 Bernards Township School District                               131. 0.029 Lowest FRL
#>  9 Ridgewood Public School District                                129. 0.024 Lowest FRL
#> 10 Livingston Board Of Education School District                   121. 0.019 Lowest FRL