15 Insights from Nevada School Enrollment Data
Source:vignettes/enrollment_hooks.Rmd
enrollment_hooks.Rmd
library(nvschooldata)
library(dplyr)
library(tidyr)
library(ggplot2)

theme_set(theme_minimal(base_size = 14))
This vignette explores Nevada’s public school enrollment data, surfacing key trends and demographic patterns across the available years (2021-2026). Nevada’s data includes 17 county-based school districts, Carson City, and 51 charter school operators under the State Public Charter School Authority (SPCSA).
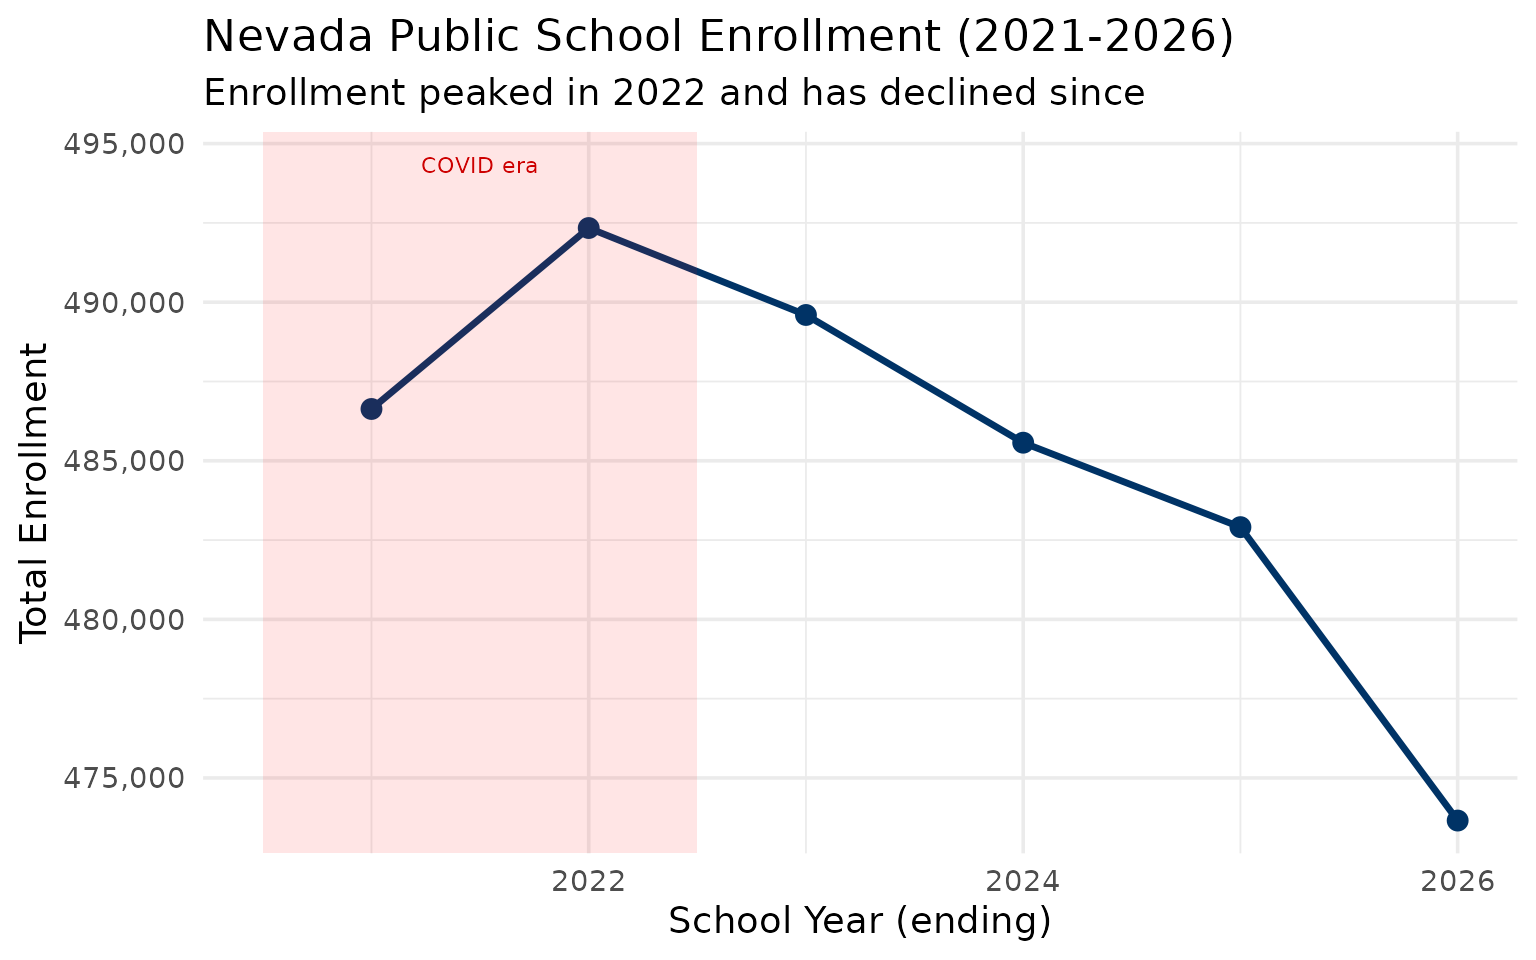
1. Nevada lost nearly 13,000 students between 2021 and 2026
Nevada was one of America’s fastest-growing states for decades, but school enrollment has declined since 2022. The state shed 18,681 students from its 2022 peak to 2026.
enr <- fetch_enr_multi(2021:2026, use_cache = TRUE)

state_totals <- enr |>
  filter(is_district, subgroup == "total_enrollment", grade_level == "TOTAL") |>
  group_by(end_year) |>
  summarize(n_students = sum(n_students, na.rm = TRUE), .groups = "drop") |>
  mutate(change = n_students - lag(n_students),
         pct_change = round(change / lag(n_students) * 100, 2))

stopifnot(nrow(state_totals) > 0)
state_totals
#> # A tibble: 6 × 4
#>   end_year n_students change pct_change
#>      <int>      <dbl>  <dbl>      <dbl>
#> 1     2021     486633     NA      NA
#> 2     2022     492338   5705       1.17
#> 3     2023     489597  -2741      -0.56
#> 4     2024     485570  -4027      -0.82
#> 5     2025     482908  -2662      -0.55
#> 6     2026     473657  -9251      -1.92
ggplot(state_totals, aes(x = end_year, y = n_students)) +
  geom_line(linewidth = 1.2, color = "#003366") +
  geom_point(size = 3, color = "#003366") +
  annotate("rect", xmin = 2020.5, xmax = 2022.5, ymin = -Inf, ymax = Inf,
           alpha = 0.1, fill = "red") +
  annotate("text", x = 2021.5, y = max(state_totals$n_students) + 2000,
           label = "COVID era", size = 3, color = "red3") +
  scale_y_continuous(labels = scales::comma) +
  labs(
    title = "Nevada Public School Enrollment (2021-2026)",
    subtitle = "Enrollment peaked in 2022 and has declined since",
    x = "School Year (ending)",
    y = "Total Enrollment"
  )
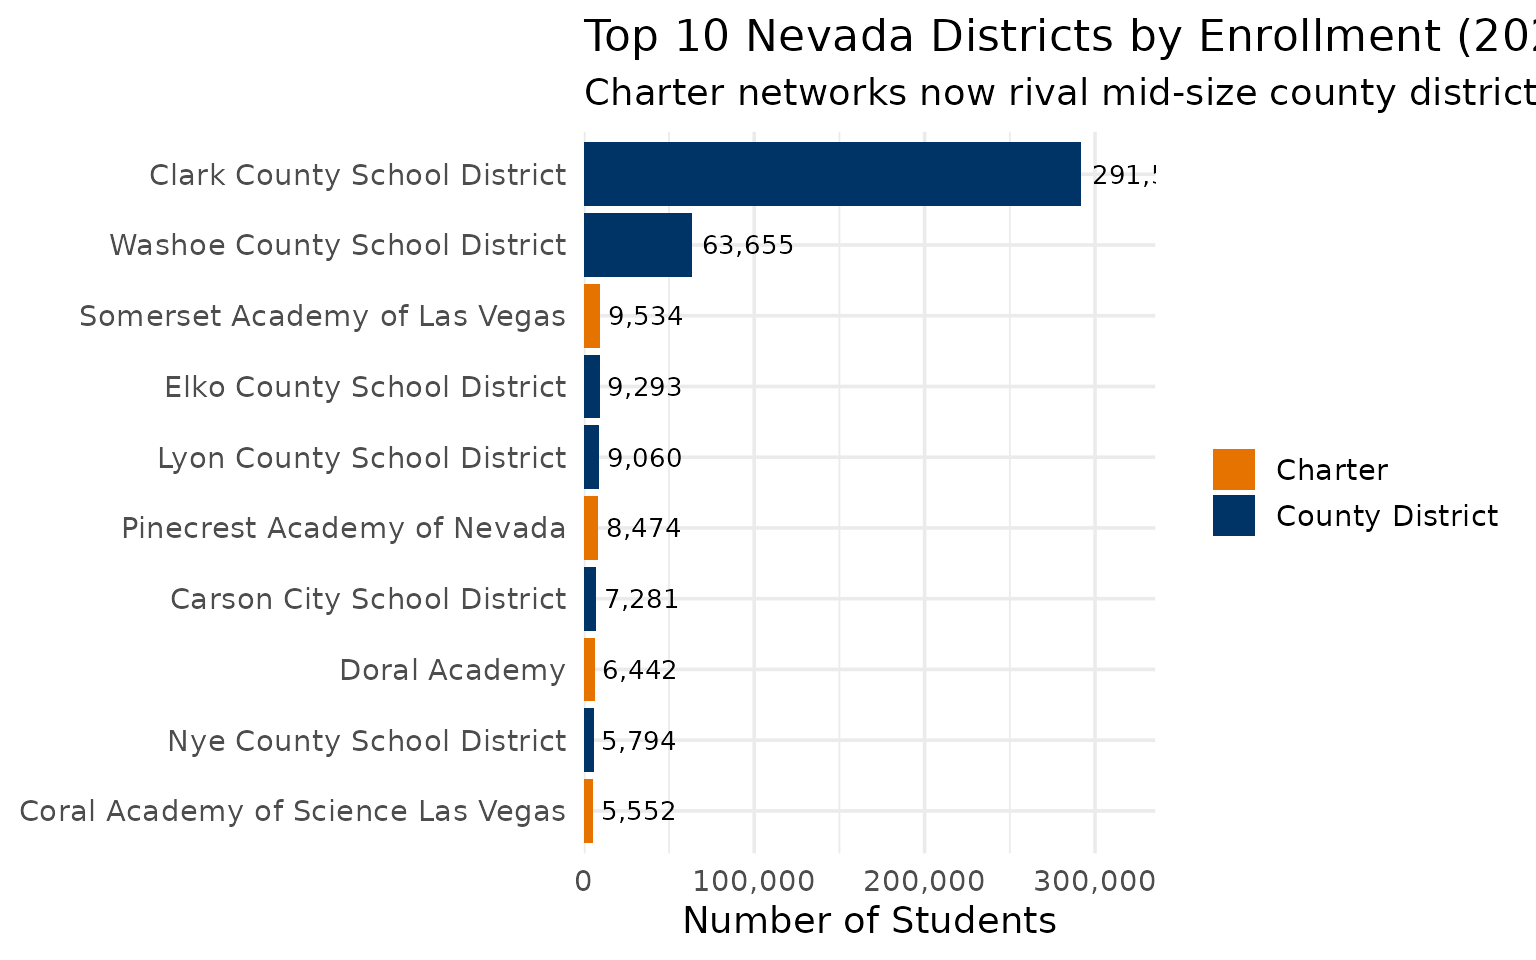
2. Charter schools crack the top 10 in Nevada
Clark County dominates, but three charter networks (Somerset, Pinecrest, Doral) now enroll more students than most county school districts. Somerset Academy alone enrolls more than 14 of the 17 county districts.
enr_2026 <- fetch_enr(2026, use_cache = TRUE)

top_districts <- enr_2026 |>
  filter(is_district, subgroup == "total_enrollment", grade_level == "TOTAL") |>
  arrange(desc(n_students)) |>
  head(10) |>
  select(district_name, n_students, is_charter)

stopifnot(nrow(top_districts) == 10)
top_districts
#>                         district_name n_students is_charter
#> 1        Clark County School District     291587      FALSE
#> 2       Washoe County School District      63655      FALSE
#> 3       Somerset Academy of Las Vegas       9534       TRUE
#> 4         Elko County School District       9293      FALSE
#> 5         Lyon County School District       9060      FALSE
#> 6         Pinecrest Academy of Nevada       8474       TRUE
#> 7         Carson City School District       7281      FALSE
#> 8                       Doral Academy       6442       TRUE
#> 9          Nye County School District       5794      FALSE
#> 10 Coral Academy of Science Las Vegas       5552       TRUE
top_districts |>
  mutate(district_name = forcats::fct_reorder(district_name, n_students),
         sector = ifelse(is_charter, "Charter", "County District")) |>
  ggplot(aes(x = n_students, y = district_name, fill = sector)) +
  geom_col() +
  geom_text(aes(label = scales::comma(n_students)), hjust = -0.1, size = 3.5) +
  scale_x_continuous(labels = scales::comma, expand = expansion(mult = c(0, 0.15))) +
  scale_fill_manual(values = c("Charter" = "#E67300", "County District" = "#003366")) +
  labs(
    title = "Top 10 Nevada Districts by Enrollment (2026)",
    subtitle = "Charter networks now rival mid-size county districts",
    x = "Number of Students",
    y = NULL,
    fill = NULL
  )
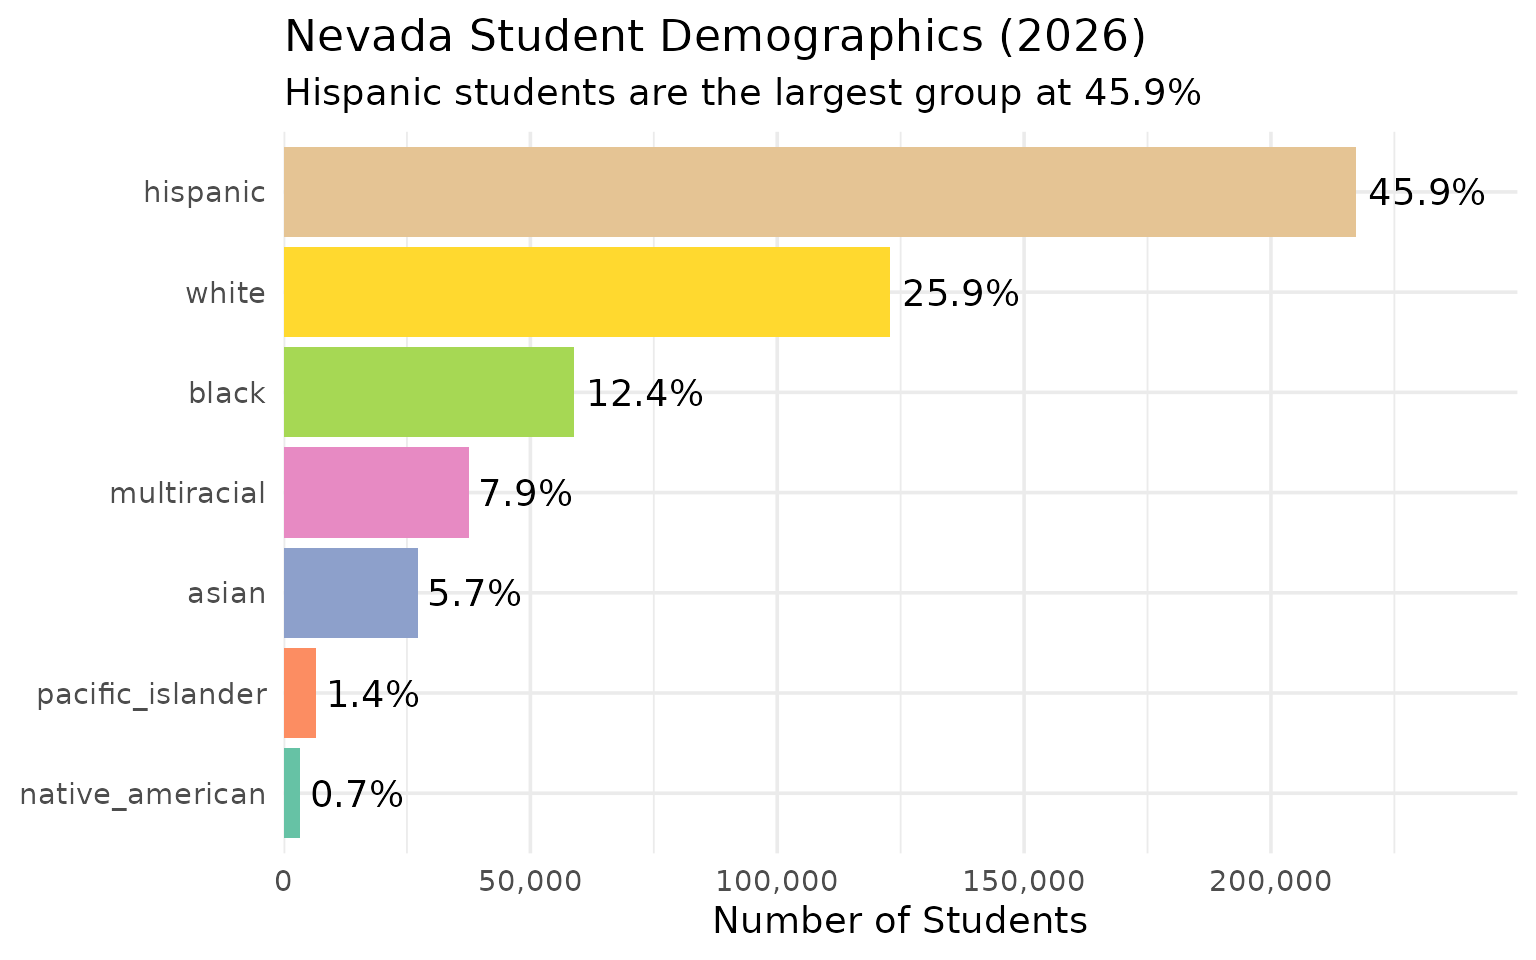
3. Hispanic students are 46% of Nevada enrollment, down slightly from 47% in 2021
Hispanic students are the largest demographic group in Nevada public schools at 45.9%, followed by white students at 25.9%. Hispanic share dipped from 46.8% in 2021 to 45.9% in 2026, a modest decrease even as Hispanic students remain the largest group.
demographics <- enr_2026 |>
  filter(is_district, grade_level == "TOTAL",
         subgroup %in% c("white", "black", "hispanic", "asian",
                         "native_american", "multiracial", "pacific_islander")) |>
  group_by(subgroup) |>
  summarize(n_students = sum(n_students, na.rm = TRUE), .groups = "drop") |>
  mutate(pct = round(n_students / sum(n_students) * 100, 1)) |>
  arrange(desc(n_students))

stopifnot(nrow(demographics) == 7)
demographics
#> # A tibble: 7 × 3
#>   subgroup         n_students   pct
#>   <chr>                 <dbl> <dbl>
#> 1 hispanic             217320  45.9
#> 2 white                122852  25.9
#> 3 black                 58830  12.4
#> 4 multiracial           37516   7.9
#> 5 asian                 27170   5.7
#> 6 pacific_islander       6622   1.4
#> 7 native_american        3347   0.7
demographics |>
  mutate(subgroup = forcats::fct_reorder(subgroup, n_students)) |>
  ggplot(aes(x = n_students, y = subgroup, fill = subgroup)) +
  geom_col(show.legend = FALSE) +
  geom_text(aes(label = paste0(pct, "%")), hjust = -0.1) +
  scale_x_continuous(labels = scales::comma, expand = expansion(mult = c(0, 0.15))) +
  scale_fill_brewer(palette = "Set2") +
  labs(
    title = "Nevada Student Demographics (2026)",
    subtitle = "Hispanic students are the largest group at 45.9%",
    x = "Number of Students",
    y = NULL
  )
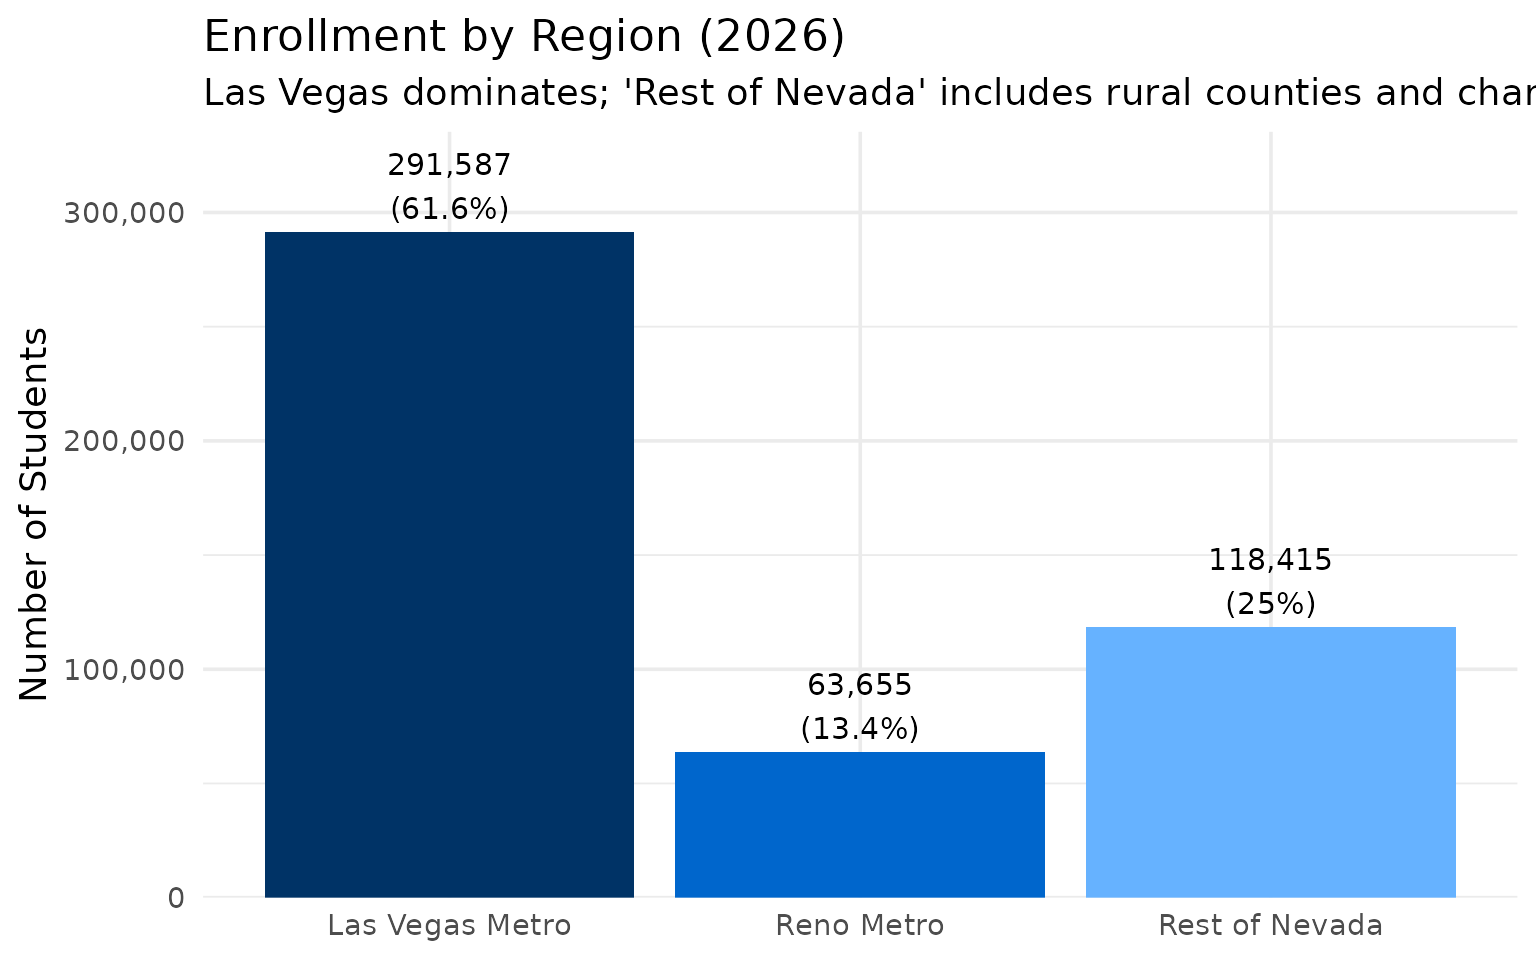
4. Las Vegas Metro has 61.6% of all Nevada students
Beyond Las Vegas and Reno, the remaining 68 entities (15 rural county districts plus charter schools) account for 25% of enrollment.
regional <- enr_2026 |>
  filter(is_district, subgroup == "total_enrollment", grade_level == "TOTAL") |>
  mutate(region = case_when(
    grepl("Clark", district_name) ~ "Las Vegas Metro",
    grepl("Washoe", district_name) ~ "Reno Metro",
    TRUE ~ "Rest of Nevada"
  )) |>
  group_by(region) |>
  summarize(
    n_entities = n_distinct(district_name),
    total_enrollment = sum(n_students, na.rm = TRUE),
    .groups = "drop"
  ) |>
  mutate(pct = round(total_enrollment / sum(total_enrollment) * 100, 1))

stopifnot(nrow(regional) == 3)
regional
#> # A tibble: 3 × 4
#>   region          n_entities total_enrollment   pct
#>   <chr>                <int>            <dbl> <dbl>
#> 1 Las Vegas Metro          1           291587  61.6
#> 2 Reno Metro               1            63655  13.4
#> 3 Rest of Nevada          68           118415  25
regional |>
  mutate(region = factor(region, levels = c("Las Vegas Metro", "Reno Metro", "Rest of Nevada"))) |>
  ggplot(aes(x = region, y = total_enrollment, fill = region)) +
  geom_col(show.legend = FALSE) +
  geom_text(aes(label = paste0(scales::comma(total_enrollment), "\n(", pct, "%)")),
            vjust = -0.2, size = 4) +
  scale_y_continuous(labels = scales::comma, expand = expansion(mult = c(0, 0.15))) +
  scale_fill_manual(values = c("Las Vegas Metro" = "#003366", "Reno Metro" = "#0066CC", "Rest of Nevada" = "#66B2FF")) +
  labs(
    title = "Enrollment by Region (2026)",
    subtitle = "Las Vegas dominates; 'Rest of Nevada' includes rural counties and charters",
    x = NULL,
    y = "Number of Students"
  )
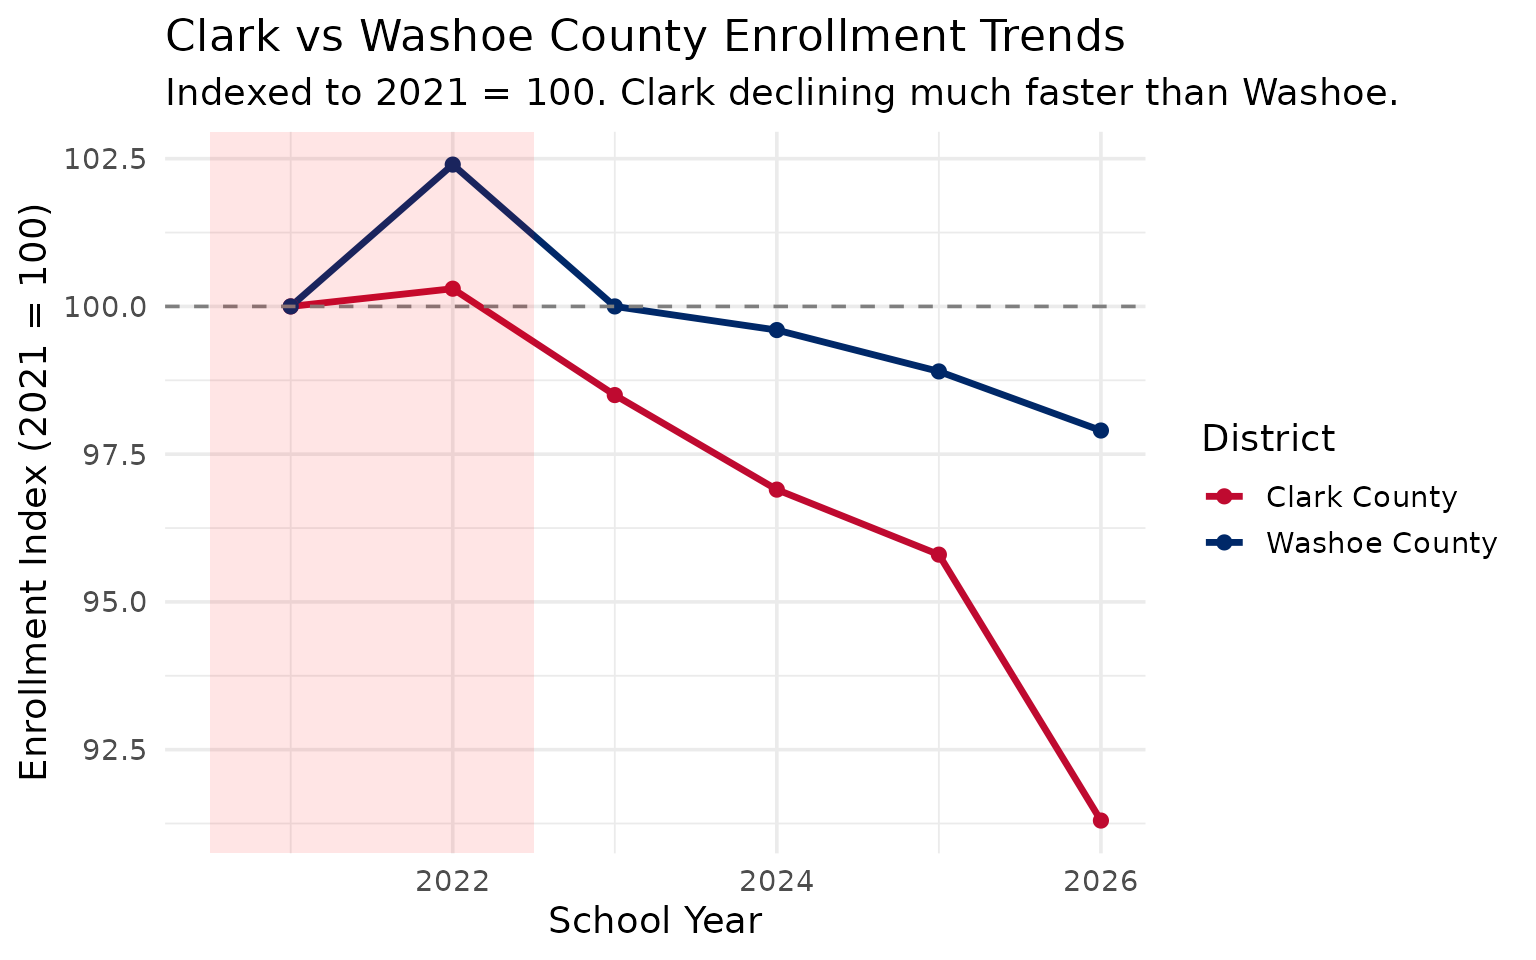
5. Clark County lost 27,706 students since 2021 while Washoe held steady
Clark County (Las Vegas) and Washoe County (Reno) are Nevada’s two urban anchors. Clark dropped 8.7% from 2021 to 2026 while Washoe only dropped 2.1%.
growth_data <- enr |>
  filter(is_district, subgroup == "total_enrollment", grade_level == "TOTAL",
         grepl("Clark|Washoe", district_name)) |>
  mutate(county = case_when(
    grepl("Clark", district_name) ~ "Clark County",
    grepl("Washoe", district_name) ~ "Washoe County"
  )) |>
  group_by(county, end_year) |>
  summarize(n_students = sum(n_students, na.rm = TRUE), .groups = "drop") |>
  group_by(county) |>
  mutate(index = round(n_students / first(n_students) * 100, 1)) |>
  ungroup()

stopifnot(nrow(growth_data) > 0)
growth_data
#> # A tibble: 12 × 4
#>    county        end_year n_students index
#>    <chr>            <int>      <dbl> <dbl>
#>  1 Clark County      2021     319293 100
#>  2 Clark County      2022     320245 100.
#>  3 Clark County      2023     314372  98.5
#>  4 Clark County      2024     309397  96.9
#>  5 Clark County      2025     306038  95.8
#>  6 Clark County      2026     291587  91.3
#>  7 Washoe County     2021      64988 100
#>  8 Washoe County     2022      66541 102.
#>  9 Washoe County     2023      64990 100
#> 10 Washoe County     2024      64755  99.6
#> 11 Washoe County     2025      64244  98.9
#> 12 Washoe County     2026      63655  97.9
ggplot(growth_data, aes(x = end_year, y = index, color = county)) +
  geom_line(linewidth = 1.2) +
  geom_point(size = 2) +
  geom_hline(yintercept = 100, linetype = "dashed", color = "gray50") +
  annotate("rect", xmin = 2020.5, xmax = 2022.5, ymin = -Inf, ymax = Inf,
           alpha = 0.1, fill = "red") +
  scale_color_manual(values = c("Clark County" = "#BF0A30", "Washoe County" = "#002868")) +
  labs(
    title = "Clark vs Washoe County Enrollment Trends",
    subtitle = "Indexed to 2021 = 100. Clark declining much faster than Washoe.",
    x = "School Year",
    y = "Enrollment Index (2021 = 100)",
    color = "District"
  )
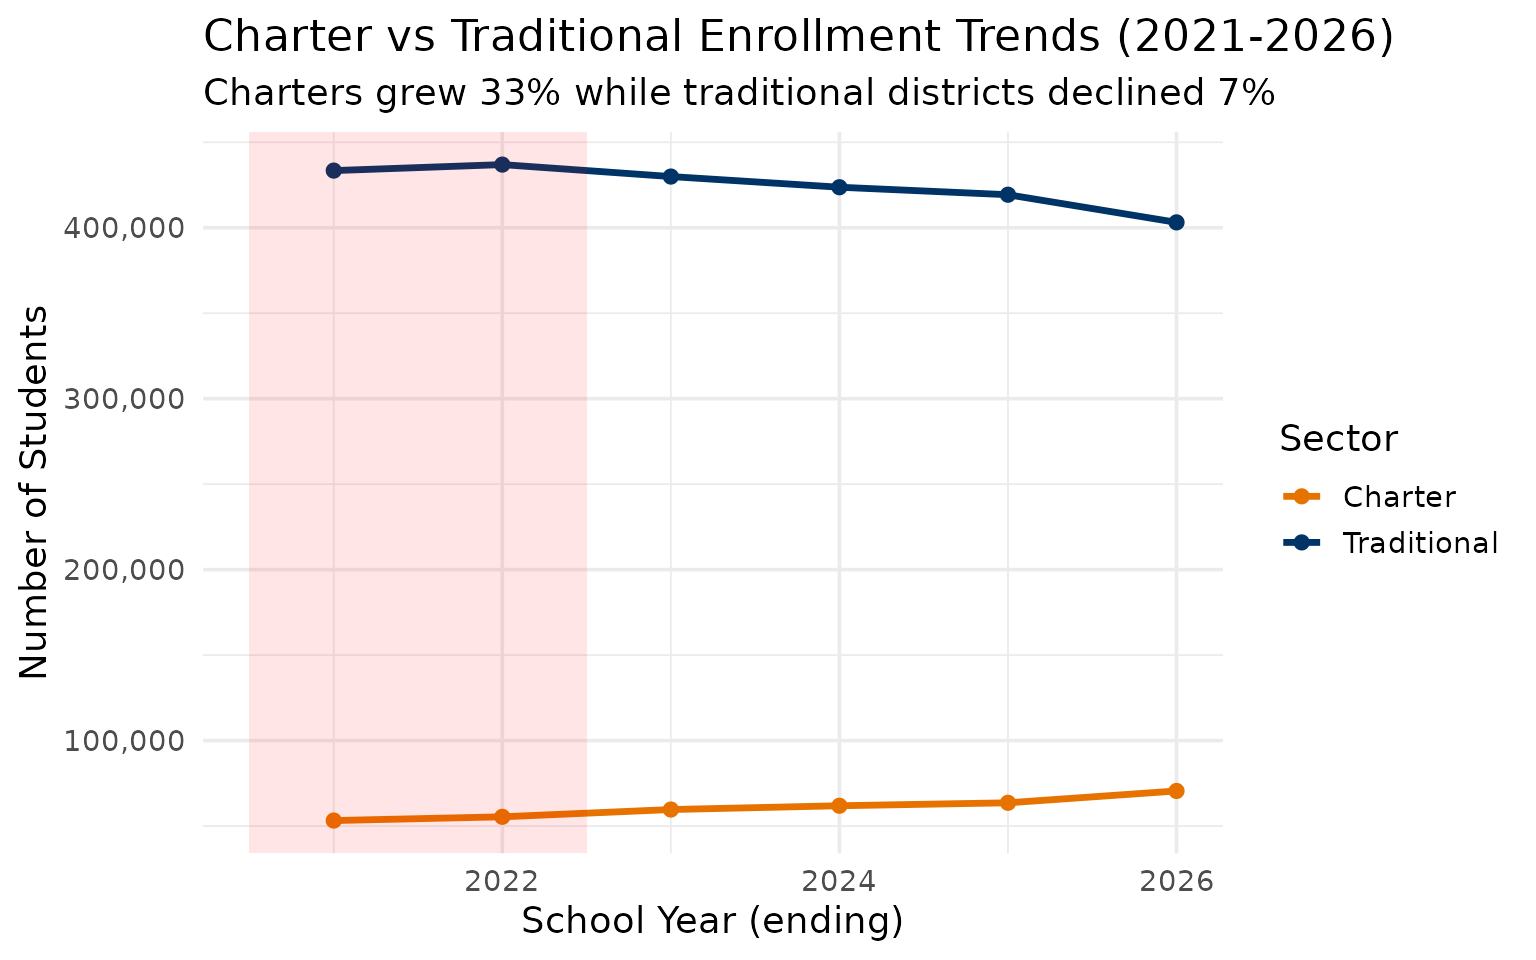
6. Charter enrollment surged 33% while traditional districts lost 30,000 students
The State Public Charter School Authority (SPCSA) oversees Nevada’s charter sector. Charters grew from 53,223 students in 2021 to 70,534 in 2026 – a 33% increase – while traditional districts lost 30,287 students in the same period.
charter_trend <- enr |>
  filter(is_district, subgroup == "total_enrollment", grade_level == "TOTAL") |>
  group_by(end_year, is_charter) |>
  summarize(students = sum(n_students, na.rm = TRUE),
            n_districts = n(), .groups = "drop") |>
  mutate(sector = ifelse(is_charter, "Charter", "Traditional"))

stopifnot(nrow(charter_trend) > 0)
charter_trend |> select(end_year, sector, students, n_districts)
#> # A tibble: 12 × 4
#>    end_year sector      students n_districts
#>       <int> <chr>          <dbl>       <int>
#>  1     2021 Traditional   433410          19
#>  2     2021 Charter        53223          37
#>  3     2022 Traditional   436923          19
#>  4     2022 Charter        55415          38
#>  5     2023 Traditional   429927          19
#>  6     2023 Charter        59670          43
#>  7     2024 Traditional   423687          19
#>  8     2024 Charter        61883          44
#>  9     2025 Traditional   419299          19
#> 10     2025 Charter        63609          44
#> 11     2026 Traditional   403123          19
#> 12     2026 Charter        70534          51
ggplot(charter_trend, aes(x = end_year, y = students, color = sector)) +
  geom_line(linewidth = 1.2) +
  geom_point(size = 2) +
  annotate("rect", xmin = 2020.5, xmax = 2022.5, ymin = -Inf, ymax = Inf,
           alpha = 0.1, fill = "red") +
  scale_y_continuous(labels = scales::comma) +
  scale_color_manual(values = c("Charter" = "#E67300", "Traditional" = "#003366")) +
  labs(
    title = "Charter vs Traditional Enrollment Trends (2021-2026)",
    subtitle = "Charters grew 33% while traditional districts declined 7%",
    x = "School Year (ending)",
    y = "Number of Students",
    color = "Sector"
  )
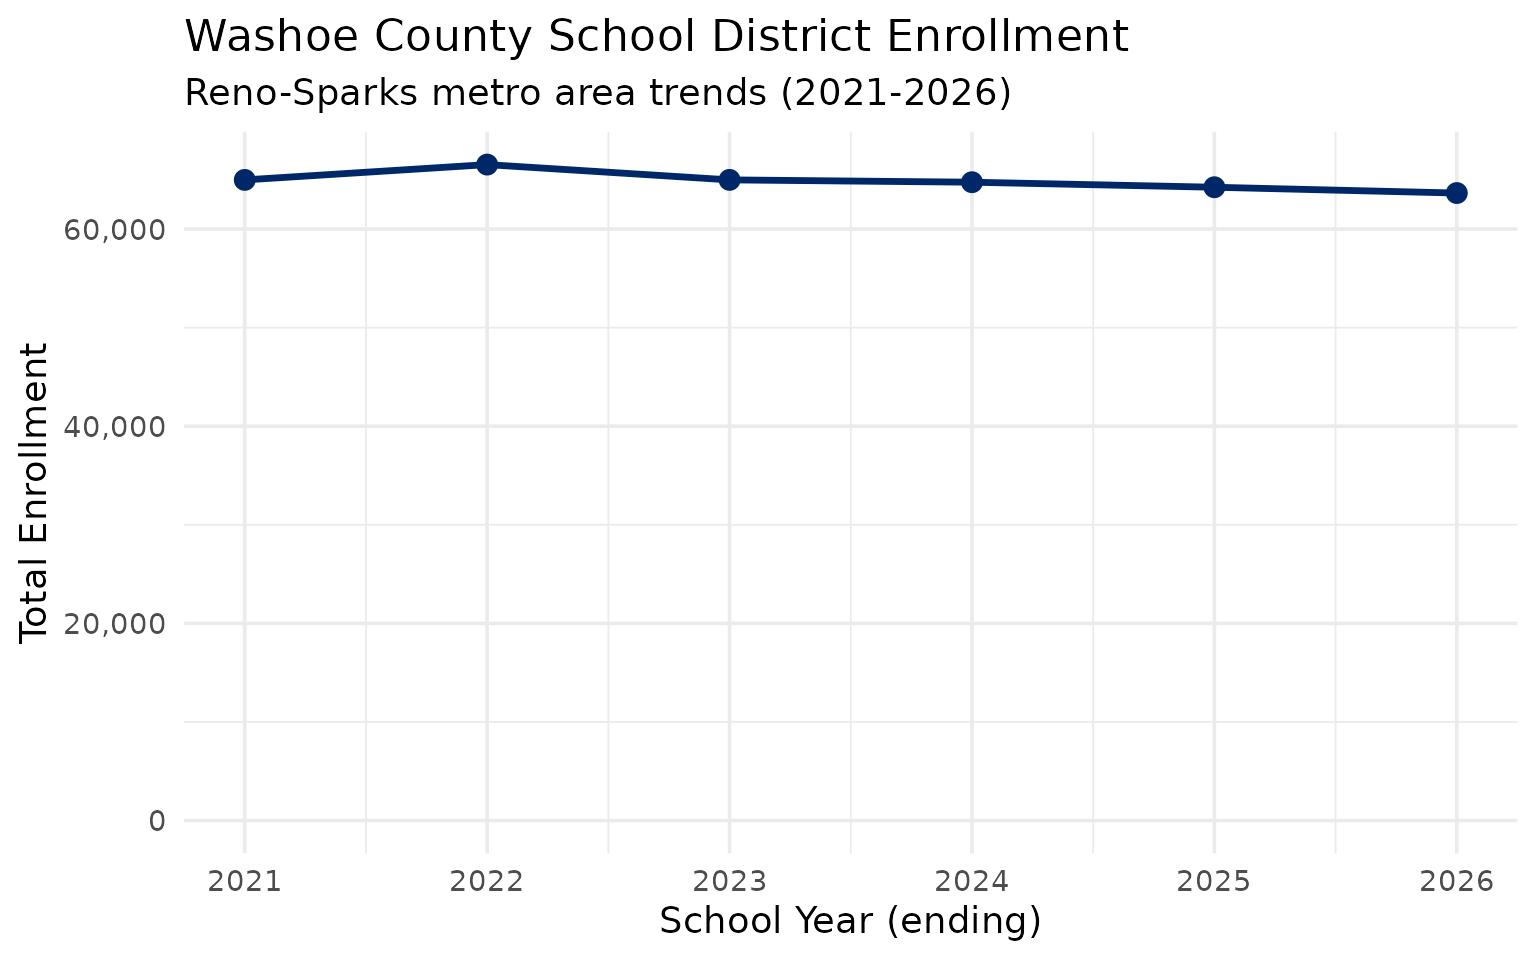
7. Washoe County lost 1,333 students over 5 years
Washoe County (Reno-Sparks) is Nevada’s second-largest district. It peaked at 66,541 in 2022 before declining.
washoe_data <- enr |>
  filter(is_district, subgroup == "total_enrollment", grade_level == "TOTAL",
         grepl("Washoe", district_name)) |>
  group_by(end_year) |>
  summarize(n_students = sum(n_students, na.rm = TRUE), .groups = "drop") |>
  mutate(change = n_students - lag(n_students),
         pct_change = round(change / lag(n_students) * 100, 2))

stopifnot(nrow(washoe_data) > 0)
washoe_data
#> # A tibble: 6 × 4
#>   end_year n_students change pct_change
#>      <int>      <dbl>  <dbl>      <dbl>
#> 1     2021      64988     NA      NA
#> 2     2022      66541   1553       2.39
#> 3     2023      64990  -1551      -2.33
#> 4     2024      64755   -235      -0.36
#> 5     2025      64244   -511      -0.79
#> 6     2026      63655   -589      -0.92
ggplot(washoe_data, aes(x = end_year, y = n_students)) +
  geom_line(linewidth = 1.2, color = "#002868") +
  geom_point(size = 3, color = "#002868") +
  scale_y_continuous(labels = scales::comma, limits = c(0, NA)) +
  labs(
    title = "Washoe County School District Enrollment",
    subtitle = "Reno-Sparks metro area trends (2021-2026)",
    x = "School Year (ending)",
    y = "Total Enrollment"
  )
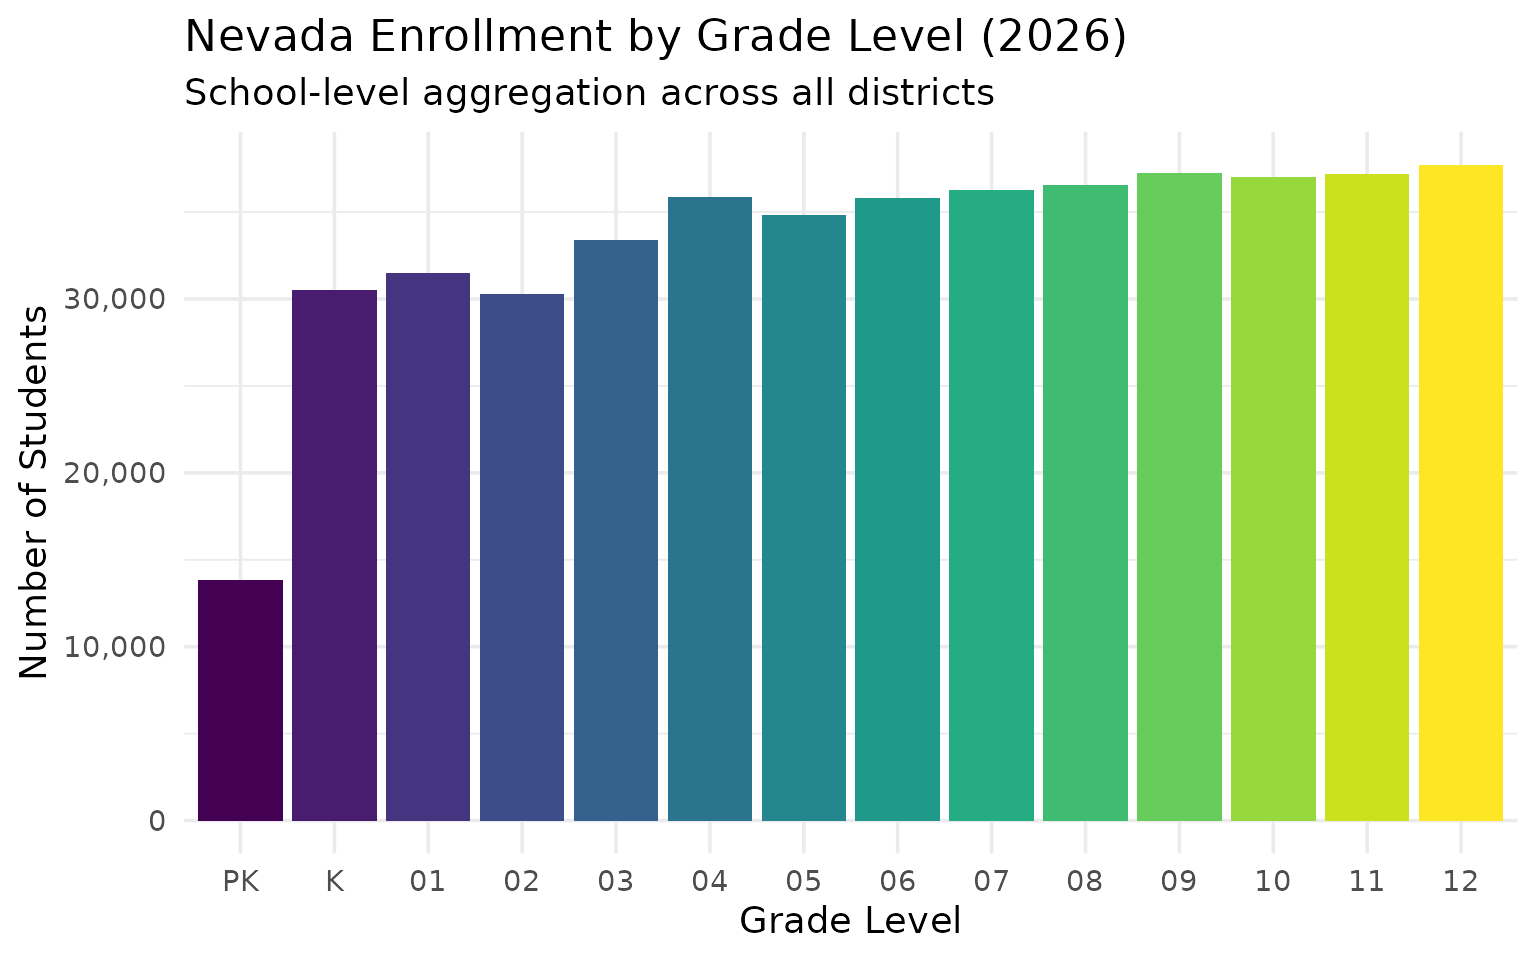
8. 12th grade has the most students; PK has the fewest
Tracking enrollment by grade reveals a classic pattern: PK is small (13,852), enrollment jumps at K (30,490), and peaks at 12th grade (37,730). Grade-level data is available at the school level.
grade_data <- enr_2026 |>
  filter(is_school, subgroup == "total_enrollment",
         !grade_level %in% c("TOTAL", "UG", "AD")) |>
  group_by(grade_level) |>
  summarize(n_students = sum(n_students, na.rm = TRUE), .groups = "drop") |>
  mutate(grade_level = factor(grade_level, levels = c("PK", "K", sprintf("%02d", 1:12)))) |>
  filter(!is.na(grade_level))

stopifnot(nrow(grade_data) > 0)
grade_data
#> # A tibble: 14 × 2
#>    grade_level n_students
#>    <fct>            <dbl>
#>  1 01               31486
#>  2 02               30265
#>  3 03               33417
#>  4 04               35890
#>  5 05               34847
#>  6 06               35814
#>  7 07               36276
#>  8 08               36577
#>  9 09               37251
#> 10 10               37010
#> 11 11               37217
#> 12 12               37730
#> 13 K                30490
#> 14 PK               13852
ggplot(grade_data, aes(x = grade_level, y = n_students, fill = grade_level)) +
  geom_col(show.legend = FALSE) +
  scale_y_continuous(labels = scales::comma) +
  scale_fill_viridis_d(option = "viridis") +
  labs(
    title = "Nevada Enrollment by Grade Level (2026)",
    subtitle = "School-level aggregation across all districts",
    x = "Grade Level",
    y = "Number of Students"
  )
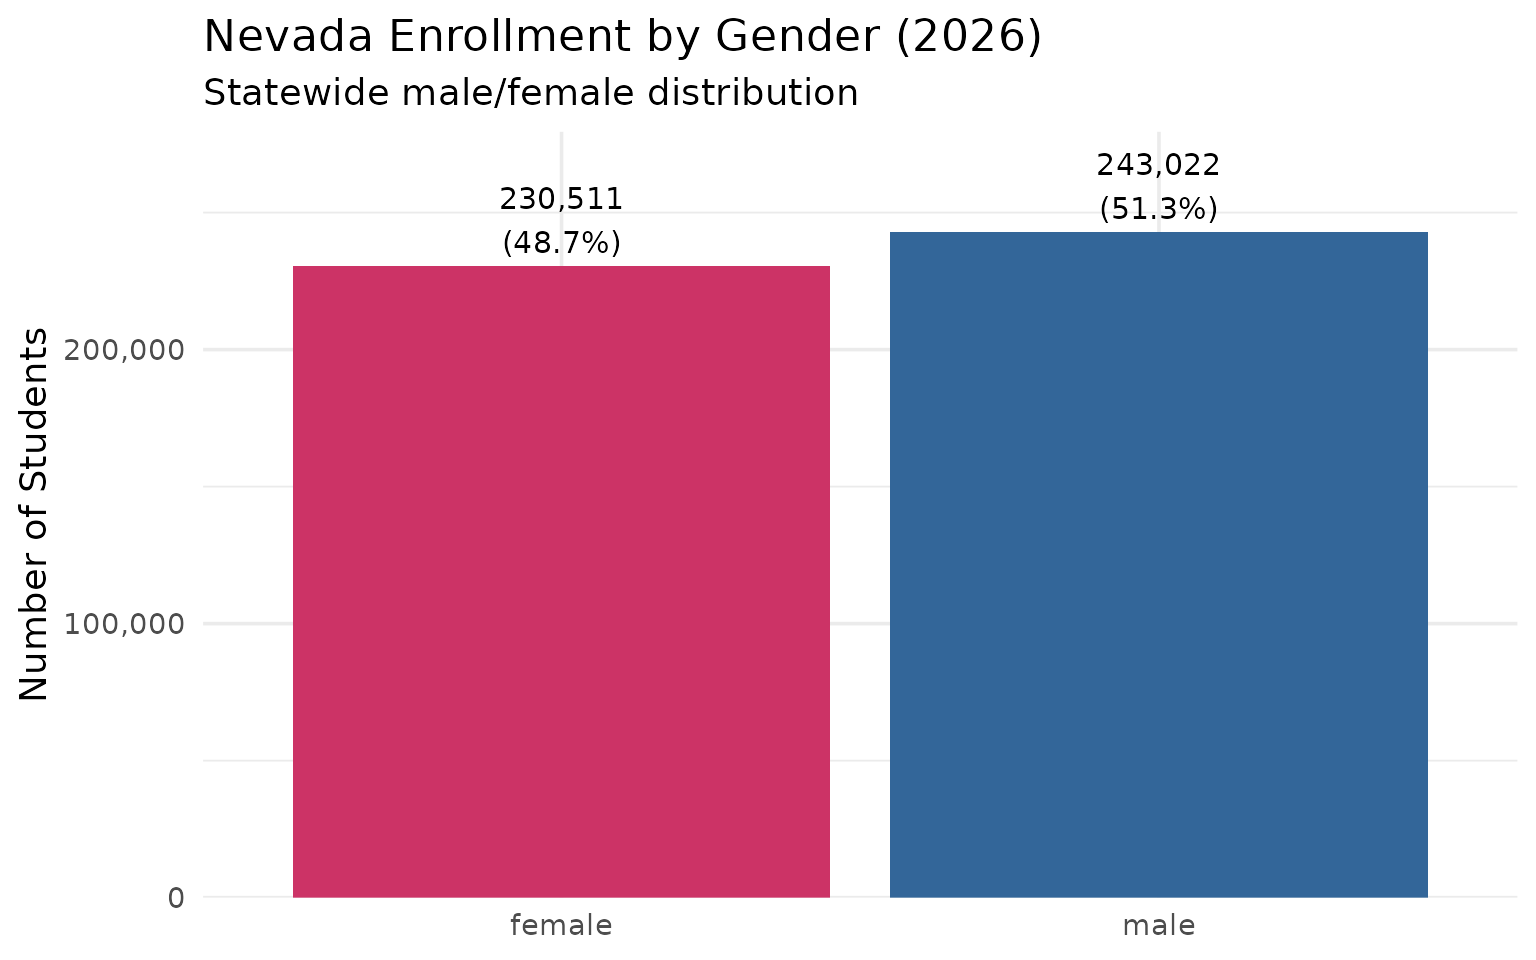
9. Boys outnumber girls 51.3% to 48.7% statewide
The gender split across Nevada schools is close to even, with a slight male skew consistent with national patterns.
gender_data <- enr_2026 |>
  filter(is_district, grade_level == "TOTAL",
         subgroup %in% c("male", "female")) |>
  group_by(subgroup) |>
  summarize(n_students = sum(n_students, na.rm = TRUE), .groups = "drop") |>
  mutate(pct = round(n_students / sum(n_students) * 100, 1))

stopifnot(nrow(gender_data) == 2)
gender_data
#> # A tibble: 2 × 3
#>   subgroup n_students   pct
#>   <chr>         <dbl> <dbl>
#> 1 female       230511  48.7
#> 2 male         243022  51.3
ggplot(gender_data, aes(x = subgroup, y = n_students, fill = subgroup)) +
  geom_col(show.legend = FALSE) +
  geom_text(aes(label = paste0(scales::comma(n_students), "\n(", pct, "%)")),
            vjust = -0.2, size = 4) +
  scale_y_continuous(labels = scales::comma, expand = expansion(mult = c(0, 0.15))) +
  scale_fill_manual(values = c("female" = "#CC3366", "male" = "#336699")) +
  labs(
    title = "Nevada Enrollment by Gender (2026)",
    subtitle = "Statewide male/female distribution",
    x = NULL,
    y = "Number of Students"
  )
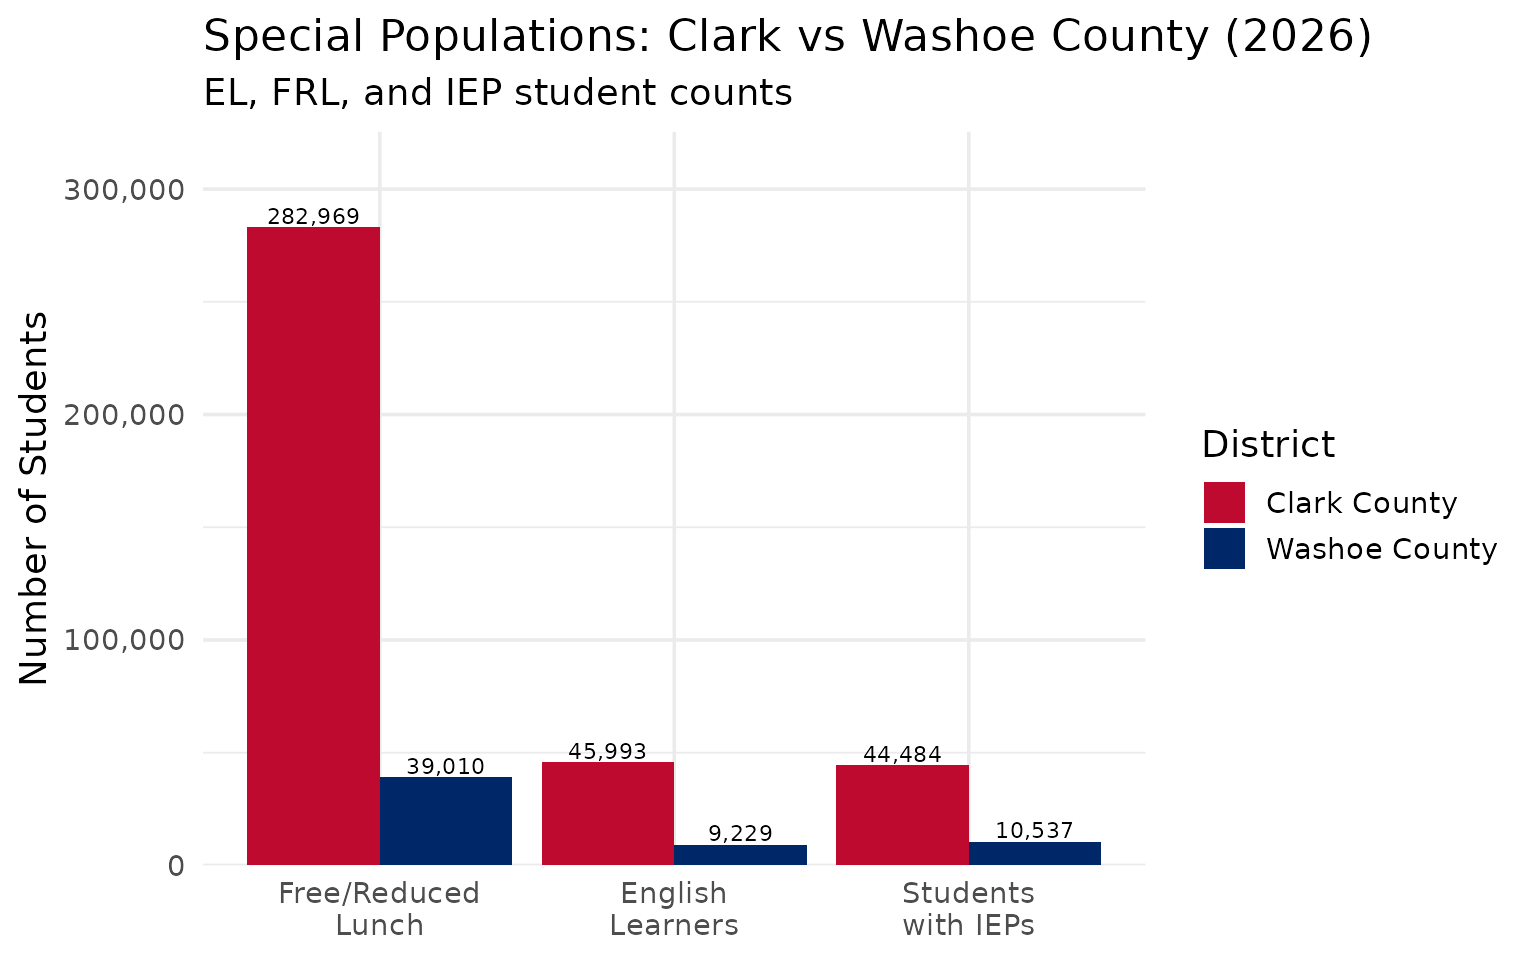
10. Clark County has 5x more EL students than Washoe but similar FRL rates
English Learners, students with IEPs, and Free/Reduced Lunch eligible students represent key populations for educational policy. Clark County has ~46,000 EL students vs Washoe’s ~9,200.
special_pops <- enr_2026 |>
  filter(is_district, grade_level == "TOTAL",
         subgroup %in% c("free_reduced_lunch", "special_ed", "lep"),
         grepl("Clark|Washoe", district_name)) |>
  mutate(county = ifelse(grepl("Clark", district_name), "Clark County", "Washoe County")) |>
  group_by(county, subgroup) |>
  summarize(n_students = sum(n_students, na.rm = TRUE), .groups = "drop")

stopifnot(nrow(special_pops) == 6)
special_pops
#> # A tibble: 6 × 3
#>   county        subgroup           n_students
#>   <chr>         <chr>                   <dbl>
#> 1 Clark County  free_reduced_lunch     282969
#> 2 Clark County  lep                     45993
#> 3 Clark County  special_ed              44484
#> 4 Washoe County free_reduced_lunch      39010
#> 5 Washoe County lep                      9229
#> 6 Washoe County special_ed              10537
ggplot(special_pops, aes(x = subgroup, y = n_students, fill = county)) +
  geom_col(position = "dodge") +
  geom_text(aes(label = scales::comma(n_students)),
            position = position_dodge(width = 0.9), vjust = -0.2, size = 3) +
  scale_y_continuous(labels = scales::comma, expand = expansion(mult = c(0, 0.15))) +
  scale_fill_manual(values = c("Clark County" = "#BF0A30", "Washoe County" = "#002868")) +
  scale_x_discrete(labels = c("lep" = "English\nLearners", "free_reduced_lunch" = "Free/Reduced\nLunch", "special_ed" = "Students\nwith IEPs")) +
  labs(
    title = "Special Populations: Clark vs Washoe County (2026)",
    subtitle = "EL, FRL, and IEP student counts",
    x = NULL,
    y = "Number of Students",
    fill = "District"
  )
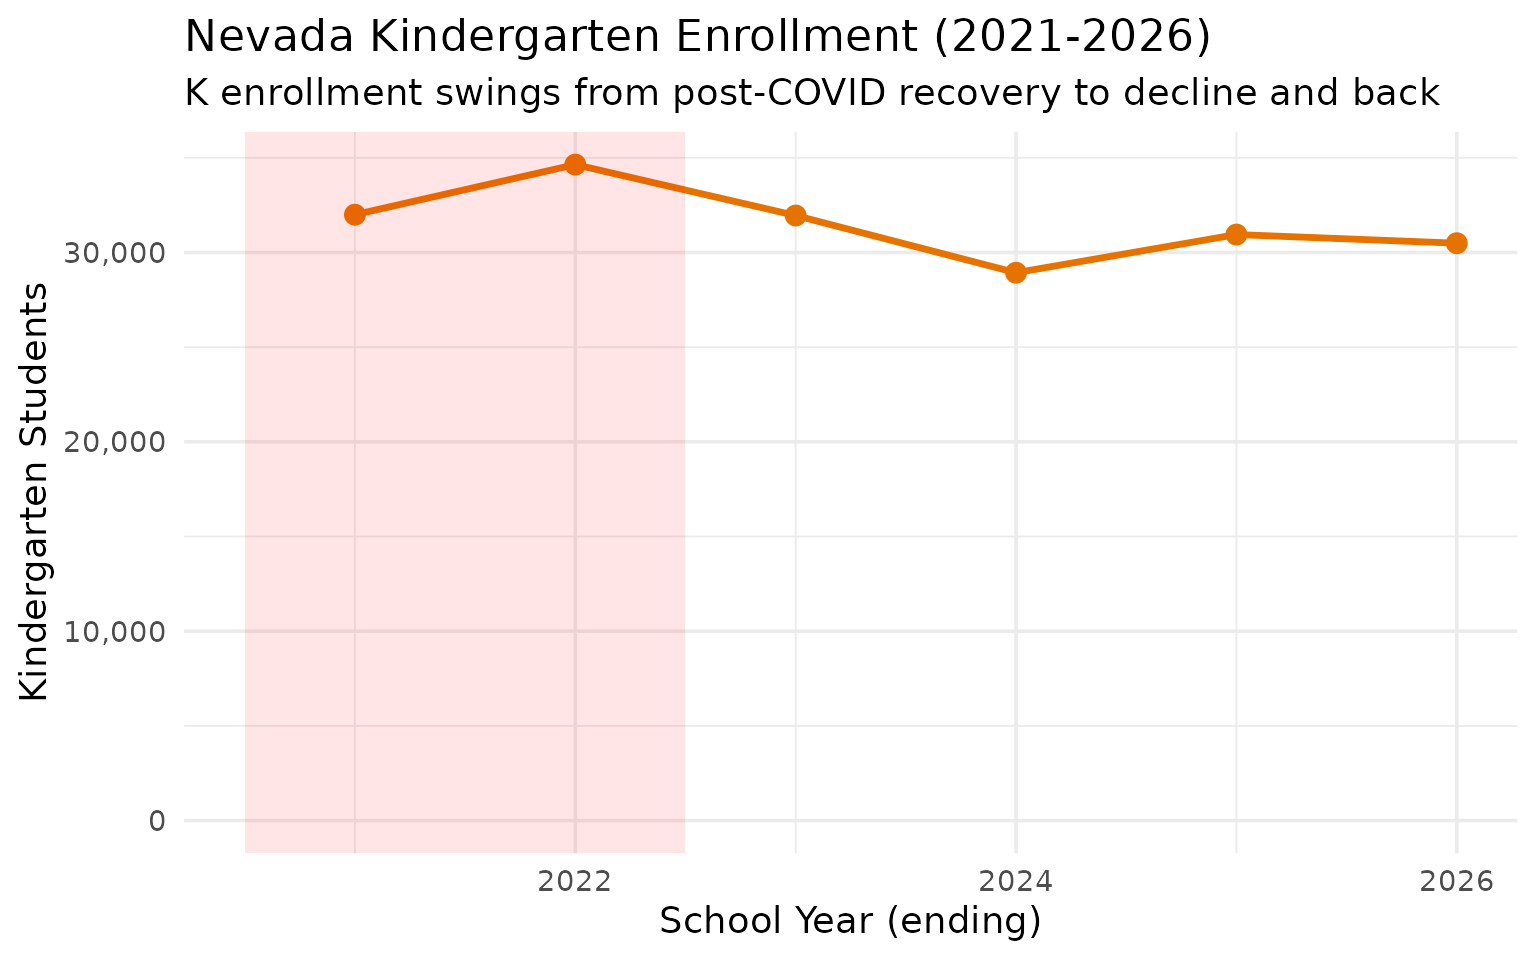
11. Kindergarten enrollment swung wildly: up 8% in 2022, down 9% in 2024
Kindergarten enrollment is a leading indicator of future trends. Nevada K enrollment hit 34,641 in 2022 then crashed to 28,931 in 2024 before recovering to 30,490 in 2026. Grade-level data is available at the school level.
k_data <- enr |>
  filter(is_school, subgroup == "total_enrollment", grade_level == "K") |>
  group_by(end_year) |>
  summarize(k_students = sum(n_students, na.rm = TRUE), .groups = "drop") |>
  mutate(change = k_students - lag(k_students),
         pct_change = round(change / lag(k_students) * 100, 2))

stopifnot(nrow(k_data) > 0)
k_data
#> # A tibble: 6 × 4
#>   end_year k_students change pct_change
#>      <int>      <dbl>  <dbl>      <dbl>
#> 1     2021      31995     NA      NA
#> 2     2022      34641   2646       8.27
#> 3     2023      31951  -2690      -7.77
#> 4     2024      28931  -3020      -9.45
#> 5     2025      30947   2016       6.97
#> 6     2026      30490   -457      -1.48
ggplot(k_data, aes(x = end_year, y = k_students)) +
  geom_line(linewidth = 1.2, color = "#E67300") +
  geom_point(size = 3, color = "#E67300") +
  annotate("rect", xmin = 2020.5, xmax = 2022.5, ymin = -Inf, ymax = Inf,
           alpha = 0.1, fill = "red") +
  scale_y_continuous(labels = scales::comma, limits = c(0, NA)) +
  labs(
    title = "Nevada Kindergarten Enrollment (2021-2026)",
    subtitle = "K enrollment swings from post-COVID recovery to decline and back",
    x = "School Year (ending)",
    y = "Kindergarten Students"
  )
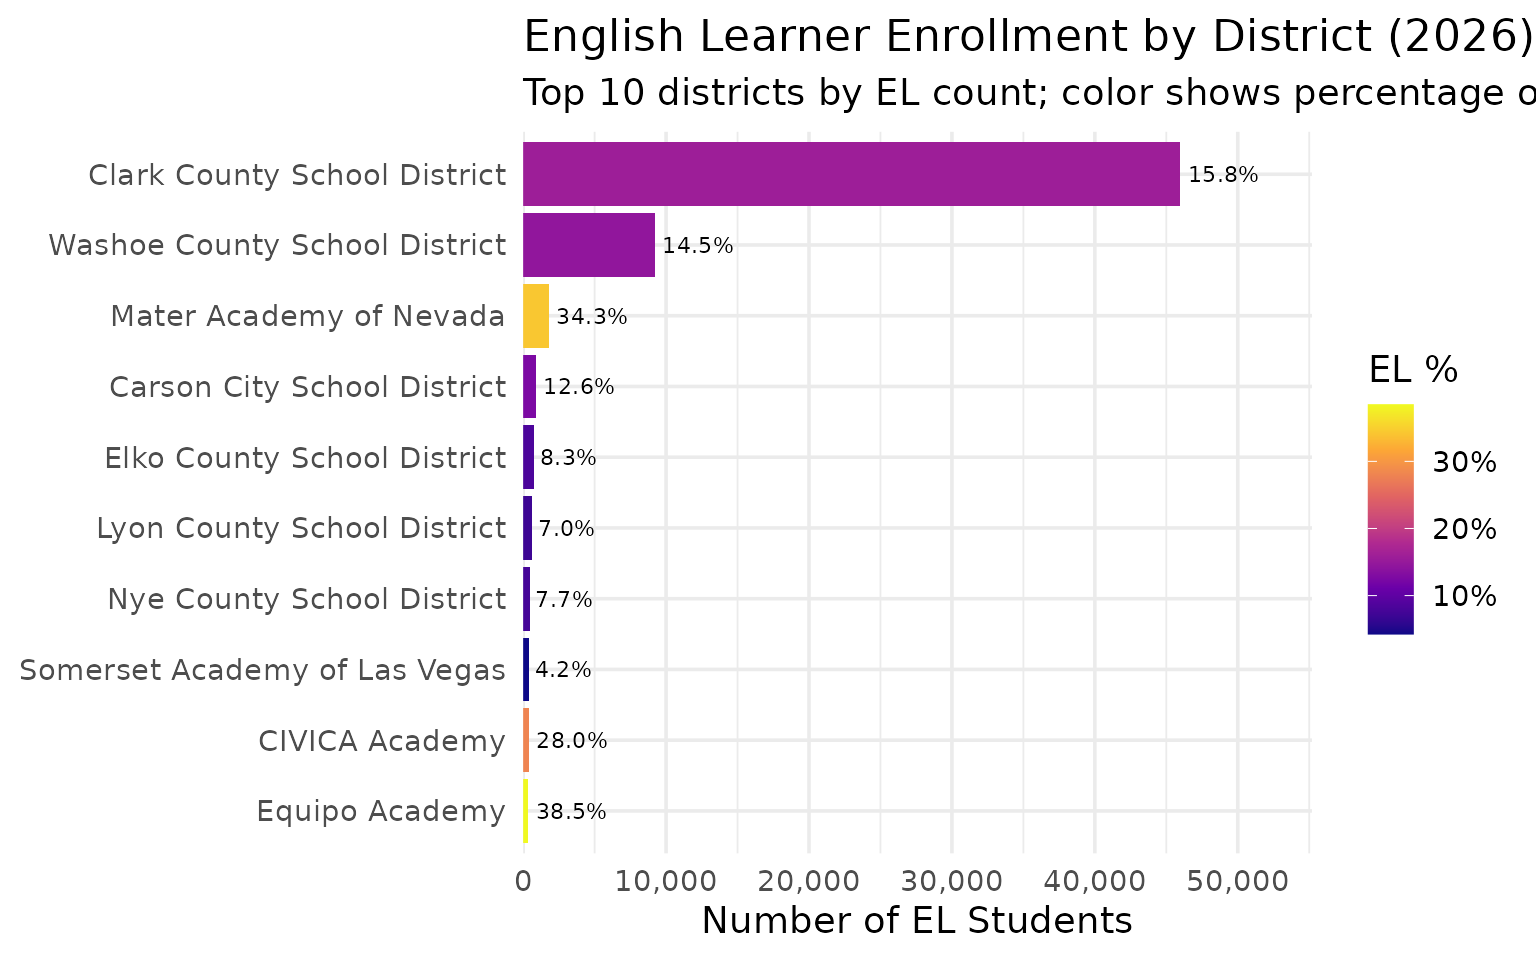
12. Futuro Academy has the highest EL concentration at 41%
English Learner populations vary dramatically. Clark County leads in absolute numbers (45,993), but several charter schools have much higher EL concentrations. Futuro Academy leads at 41.1% EL students, followed by Equipo Academy at 38.5%.
el_data <- enr_2026 |>
  filter(is_district, grade_level == "TOTAL", subgroup == "lep") |>
  arrange(desc(n_students)) |>
  head(10) |>
  select(district_name, n_students, pct)

stopifnot(nrow(el_data) == 10)
el_data
#>                    district_name n_students        pct
#> 1   Clark County School District      45993 0.15773337
#> 2  Washoe County School District       9229 0.14498468
#> 3        Mater Academy of Nevada       1816 0.34283557
#> 4    Carson City School District        916 0.12580689
#> 5    Elko County School District        774 0.08328850
#> 6    Lyon County School District        637 0.07030905
#> 7     Nye County School District        449 0.07749396
#> 8  Somerset Academy of Las Vegas        405 0.04247955
#> 9                 CIVICA Academy        403 0.28044537
#> 10                Equipo Academy        365 0.38461538
el_data |>
  mutate(district_name = forcats::fct_reorder(district_name, n_students)) |>
  ggplot(aes(x = n_students, y = district_name, fill = pct)) +
  geom_col() +
  geom_text(aes(label = scales::percent(pct, accuracy = 0.1)), hjust = -0.1, size = 3) +
  scale_x_continuous(labels = scales::comma, expand = expansion(mult = c(0, 0.2))) +
  scale_fill_viridis_c(option = "plasma", labels = scales::percent) +
  labs(
    title = "English Learner Enrollment by District (2026)",
    subtitle = "Top 10 districts by EL count; color shows percentage of total enrollment",
    x = "Number of EL Students",
    y = NULL,
    fill = "EL %"
  )
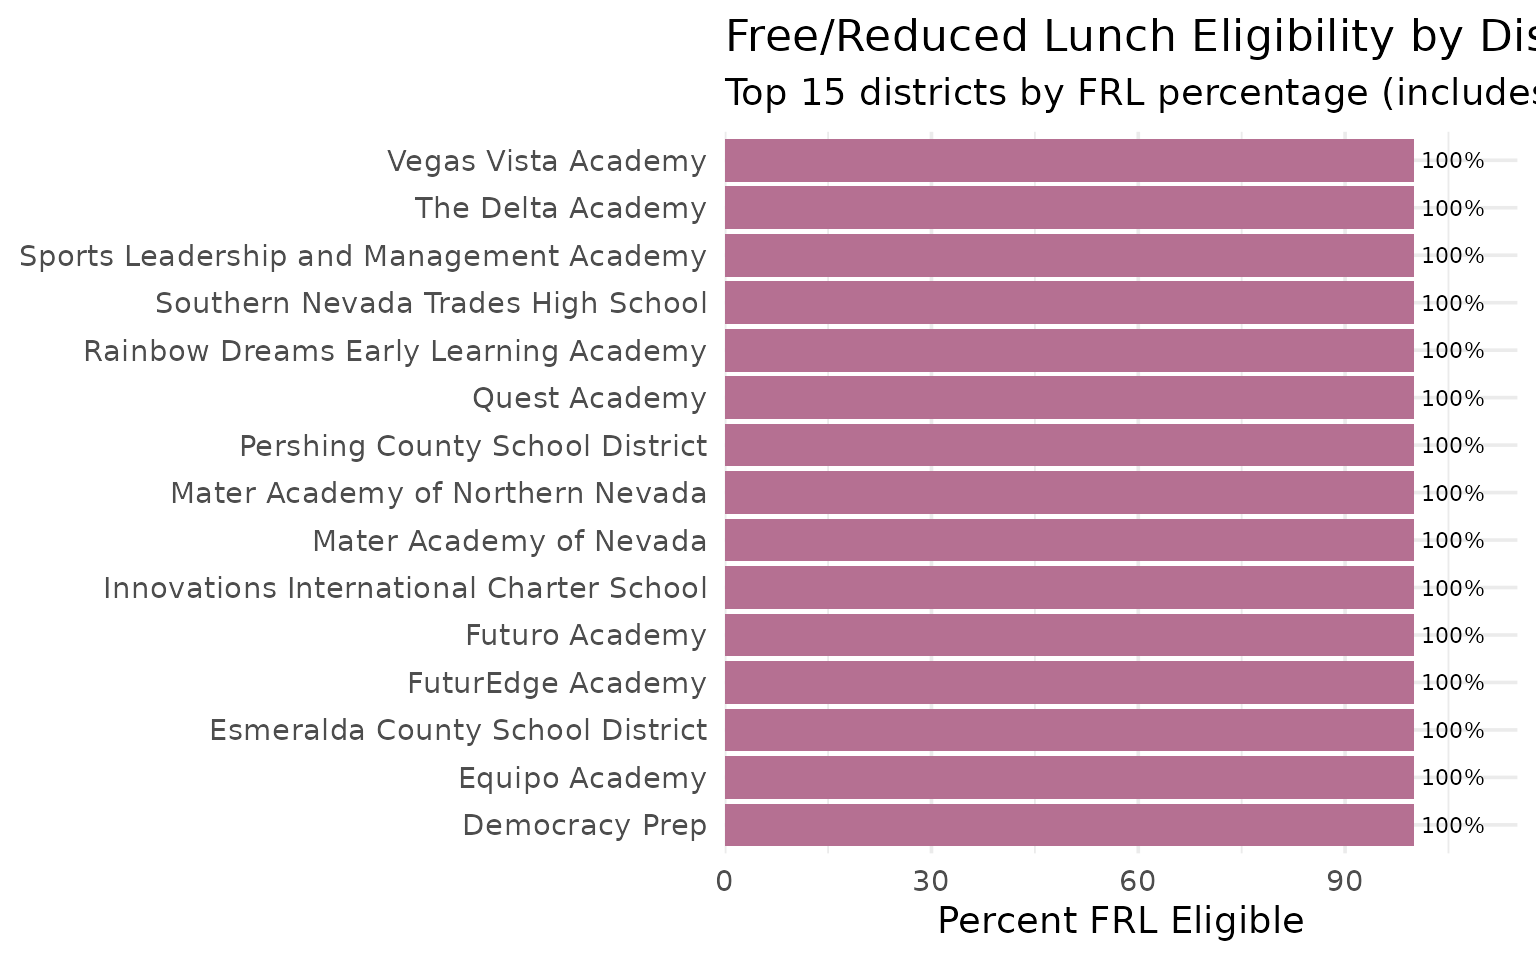
13. Fifteen districts report 100% FRL eligibility
FRL eligibility is a proxy for economic disadvantage. Many charter schools report 100% FRL, along with two rural counties (Esmeralda and Pershing). The variation across districts is enormous.
frl_data <- enr_2026 |>
  filter(is_district, grade_level == "TOTAL", subgroup == "free_reduced_lunch") |>
  mutate(pct_display = round(pct * 100, 1)) |>
  arrange(desc(pct)) |>
  head(15) |>
  select(district_name, n_students, pct_display)

stopifnot(nrow(frl_data) > 0)
frl_data
#>                               district_name n_students pct_display
#> 1          Esmeralda County School District         69         100
#> 2           Pershing County School District        647         100
#> 3                            Futuro Academy        484         100
#> 4          Mater Academy of Northern Nevada        514         100
#> 5                            Democracy Prep        927         100
#> 6  Sports Leadership and Management Academy       1988         100
#> 7                            Equipo Academy        949         100
#> 8                   Mater Academy of Nevada       5297         100
#> 9     Rainbow Dreams Early Learning Academy        229         100
#> 10                        The Delta Academy       1315         100
#> 11 Innovations International Charter School        619         100
#> 12                            Quest Academy        415         100
#> 13                        FuturEdge Academy        318         100
#> 14       Southern Nevada Trades High School        250         100
#> 15                      Vegas Vista Academy        270         100
frl_data |>
  mutate(district_name = forcats::fct_reorder(district_name, pct_display)) |>
  ggplot(aes(x = pct_display, y = district_name, fill = pct_display)) +
  geom_col() +
  geom_text(aes(label = paste0(round(pct_display, 1), "%")), hjust = -0.1, size = 3) +
  scale_x_continuous(expand = expansion(mult = c(0, 0.15))) +
  scale_fill_gradient(low = "#66B2FF", high = "#BF0A30", guide = "none") +
  labs(
    title = "Free/Reduced Lunch Eligibility by District (2026)",
    subtitle = "Top 15 districts by FRL percentage (includes charter schools)",
    x = "Percent FRL Eligible",
    y = NULL
  )
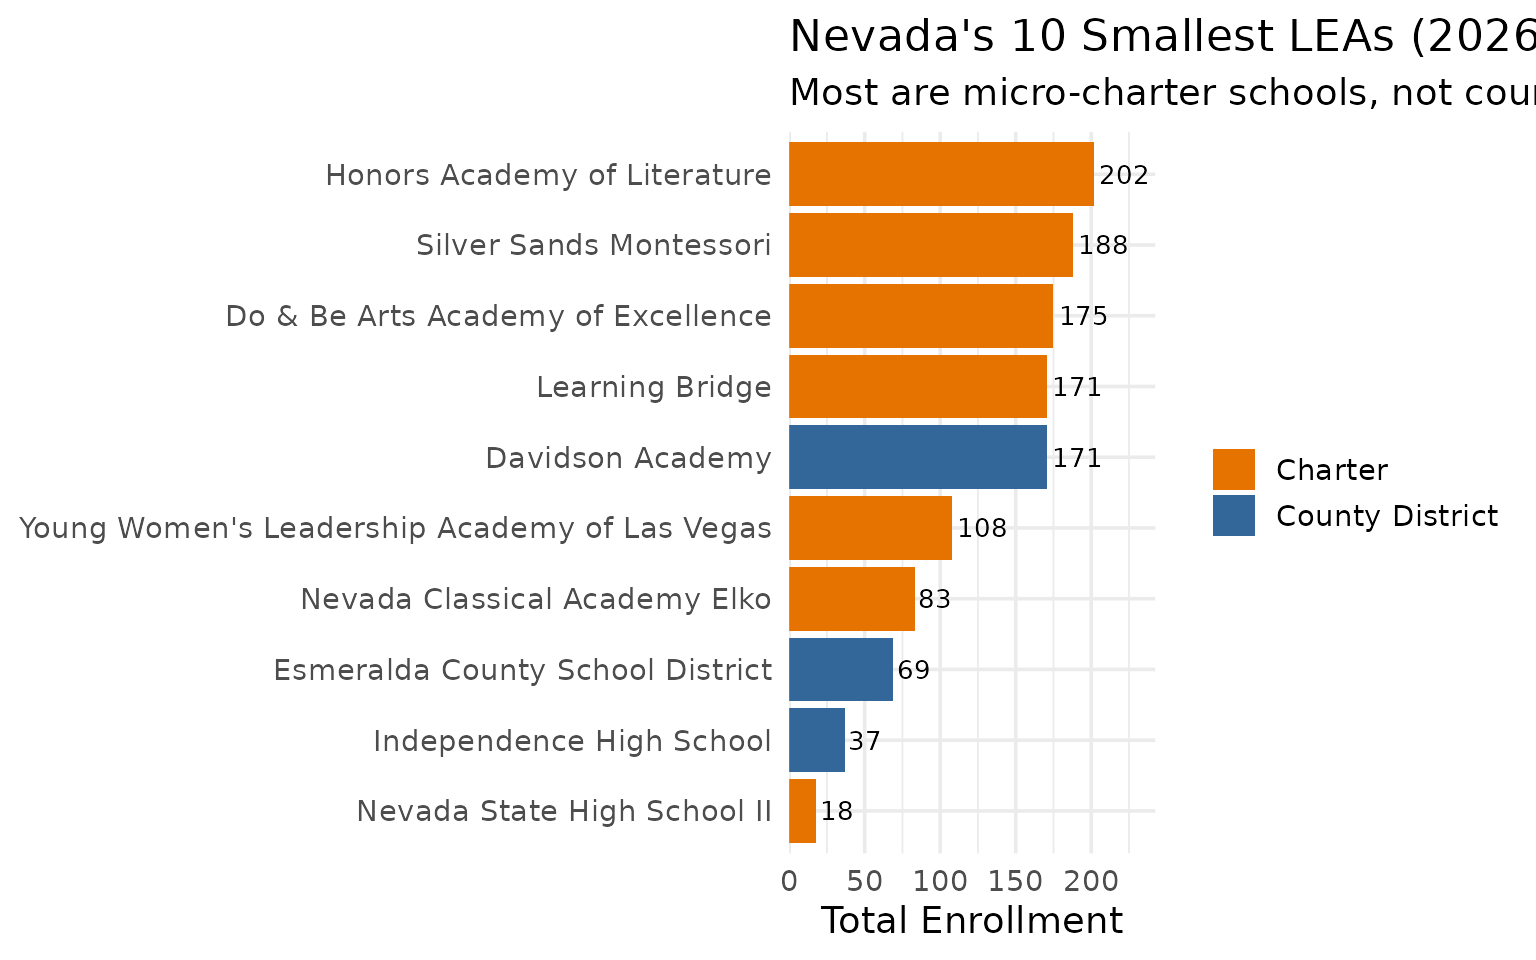
14. Nevada’s smallest LEAs are charter schools, not counties
While Esmeralda County (69 students) is the smallest county district, Nevada’s smallest LEAs are micro-charters. Nevada State High School II has just 18 students.
smallest <- enr_2026 |>
  filter(is_district, subgroup == "total_enrollment", grade_level == "TOTAL") |>
  arrange(n_students) |>
  head(10) |>
  select(district_name, n_students, is_charter)

stopifnot(nrow(smallest) == 10)
smallest
#>                                    district_name n_students is_charter
#> 1                    Nevada State High School II         18       TRUE
#> 2                       Independence High School         37      FALSE
#> 3               Esmeralda County School District         69      FALSE
#> 4                  Nevada Classical Academy Elko         83       TRUE
#> 5  Young Women's Leadership Academy of Las Vegas        108       TRUE
#> 6                                Learning Bridge        171       TRUE
#> 7                               Davidson Academy        171      FALSE
#> 8             Do & Be Arts Academy of Excellence        175       TRUE
#> 9                        Silver Sands Montessori        188       TRUE
#> 10                  Honors Academy of Literature        202       TRUE
smallest |>
  mutate(district_name = forcats::fct_reorder(district_name, n_students),
         sector = ifelse(is_charter, "Charter", "County District")) |>
  ggplot(aes(x = n_students, y = district_name, fill = sector)) +
  geom_col() +
  geom_text(aes(label = scales::comma(n_students)), hjust = -0.1, size = 3.5) +
  scale_x_continuous(expand = expansion(mult = c(0, 0.2))) +
  scale_fill_manual(values = c("Charter" = "#E67300", "County District" = "#336699")) +
  labs(
    title = "Nevada's 10 Smallest LEAs (2026)",
    subtitle = "Most are micro-charter schools, not county districts",
    x = "Total Enrollment",
    y = NULL,
    fill = NULL
  )
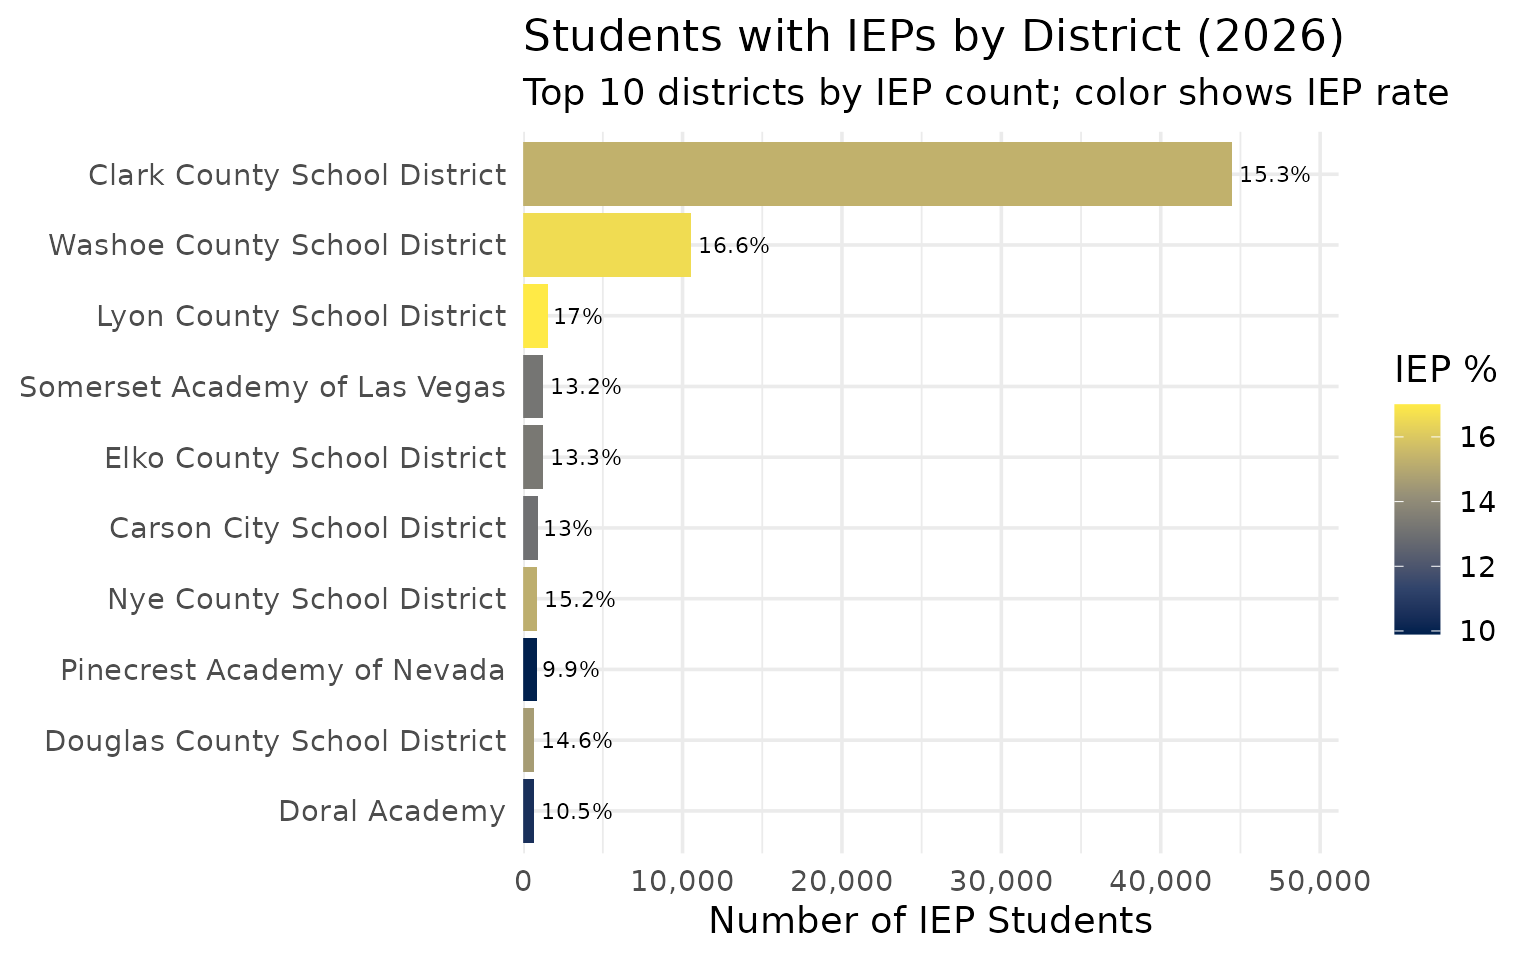
15. Lyon County has the highest IEP rate among large districts at 17%
Students with IEPs require specialized services. Clark County has the most IEP students by count (44,484), but Lyon County has the highest rate among sizable districts at 17%.
iep_data <- enr_2026 |>
  filter(is_district, grade_level == "TOTAL", subgroup == "special_ed") |>
  mutate(pct_display = round(pct * 100, 1)) |>
  arrange(desc(n_students)) |>
  head(10) |>
  select(district_name, n_students, pct_display)

stopifnot(nrow(iep_data) == 10)
iep_data
#>                     district_name n_students pct_display
#> 1    Clark County School District      44484        15.3
#> 2   Washoe County School District      10537        16.6
#> 3     Lyon County School District       1541        17.0
#> 4   Somerset Academy of Las Vegas       1258        13.2
#> 5     Elko County School District       1238        13.3
#> 6     Carson City School District        943        13.0
#> 7      Nye County School District        882        15.2
#> 8     Pinecrest Academy of Nevada        840         9.9
#> 9  Douglas County School District        692        14.6
#> 10                  Doral Academy        674        10.5
iep_data |>
  mutate(district_name = forcats::fct_reorder(district_name, n_students)) |>
  ggplot(aes(x = n_students, y = district_name, fill = pct_display)) +
  geom_col() +
  geom_text(aes(label = paste0(round(pct_display, 1), "%")), hjust = -0.1, size = 3) +
  scale_x_continuous(labels = scales::comma, expand = expansion(mult = c(0, 0.15))) +
  scale_fill_viridis_c(option = "cividis") +
  labs(
    title = "Students with IEPs by District (2026)",
    subtitle = "Top 10 districts by IEP count; color shows IEP rate",
    x = "Number of IEP Students",
    y = NULL,
    fill = "IEP %"
  )
Summary
Nevada’s school enrollment data reveals: - Declining enrollment: The state lost 13,000 students from 2021 to 2026 - Clark County losses: The Las Vegas metro lost 27,706 students (8.7%) in 5 years - Charter boom: SPCSA schools grew 33%, adding 17,311 students since 2021 - Demographic shift: Hispanic students are 45.9% of enrollment, down from 46.8% in 2021 - Urban concentration: 75% of students are in Las Vegas or Reno metro areas - Economic need: Many charter schools and rural counties report near-100% FRL - K volatility: Kindergarten enrollment swung from +8% to -9% year-over-year
These patterns shape school funding debates and facility planning across the Silver State.
Data sourced from the Nevada Department of Education Enrollment Data.
Session Info
sessionInfo()
#> R version 4.5.2 (2025-10-31)
#> Platform: x86_64-pc-linux-gnu
#> Running under: Ubuntu 24.04.3 LTS
#>
#> Matrix products: default
#> BLAS:   /usr/lib/x86_64-linux-gnu/openblas-pthread/libblas.so.3
#> LAPACK: /usr/lib/x86_64-linux-gnu/openblas-pthread/libopenblasp-r0.3.26.so;  LAPACK version 3.12.0
#>
#> locale:
#>  [1] LC_CTYPE=C.UTF-8       LC_NUMERIC=C           LC_TIME=C.UTF-8
#>  [4] LC_COLLATE=C.UTF-8     LC_MONETARY=C.UTF-8    LC_MESSAGES=C.UTF-8
#>  [7] LC_PAPER=C.UTF-8       LC_NAME=C              LC_ADDRESS=C
#> [10] LC_TELEPHONE=C         LC_MEASUREMENT=C.UTF-8 LC_IDENTIFICATION=C
#>
#> time zone: UTC
#> tzcode source: system (glibc)
#>
#> attached base packages:
#> [1] stats     graphics  grDevices utils     datasets  methods   base
#>
#> other attached packages:
#> [1] ggplot2_4.0.2      tidyr_1.3.2        dplyr_1.2.0        nvschooldata_0.1.0
#>
#> loaded via a namespace (and not attached):
#>  [1] gtable_0.3.6       jsonlite_2.0.0     compiler_4.5.2     tidyselect_1.2.1
#>  [5] jquerylib_0.1.4    systemfonts_1.3.2  scales_1.4.0       textshaping_1.0.5
#>  [9] readxl_1.4.5       yaml_2.3.12        fastmap_1.2.0      R6_2.6.1
#> [13] labeling_0.4.3     generics_0.1.4     knitr_1.51         forcats_1.0.1
#> [17] tibble_3.3.1       desc_1.4.3         downloader_0.4.1   bslib_0.10.0
#> [21] pillar_1.11.1      RColorBrewer_1.1-3 rlang_1.1.7        utf8_1.2.6
#> [25] cachem_1.1.0       xfun_0.56          S7_0.2.1           fs_1.6.7
#> [29] sass_0.4.10        viridisLite_0.4.3  cli_3.6.5          withr_3.0.2
#> [33] pkgdown_2.2.0      magrittr_2.0.4     digest_0.6.39      grid_4.5.2
#> [37] rappdirs_0.3.4     lifecycle_1.0.5    vctrs_0.7.1        evaluate_1.0.5
#> [41] glue_1.8.0         cellranger_1.1.0   farver_2.1.2       codetools_0.2-20
#> [45] ragg_1.5.1         rmarkdown_2.30     purrr_1.2.1        tools_4.5.2
#> [49] pkgconfig_2.0.3    htmltools_0.5.9