Fetch and analyze Vermont school enrollment data from VT AOE in R or Python. 21 years of data (2004-2024) for every school, supervisory union, and the state via the Vermont Education Dashboard.
Part of the njschooldata family.
Full documentation — all 15 stories with interactive charts, getting-started guide, and complete function reference.
Highlights
library(vtschooldata)
library(dplyr)
library(tidyr)
library(ggplot2)
theme_set(theme_minimal(base_size = 14))

enr_2024 <- fetch_enr(2024, use_cache = TRUE)
1. Vermont Lost 14% of Its Students Since 2004
The Green Mountain State has seen steady enrollment decline over two decades. Vermont now educates fewer than 80,000 students, down 14% from over 92,000 in 2004 – a loss of more than 13,000 students.
enr <- fetch_enr_multi(c(2004, 2008, 2012, 2016, 2020, 2024), use_cache = TRUE)

statewide <- enr |>
  filter(is_state, subgroup == "total_enrollment", grade_level == "TOTAL") |>
  select(end_year, n_students)

stopifnot(nrow(statewide) > 0)
statewide
#> end_year n_students
#> 1 2004 92334
#> 2 2008 87777
#> 3 2012 82014
#> 4 2016 78472
#> 5 2020 83503
#> 6 2024 79288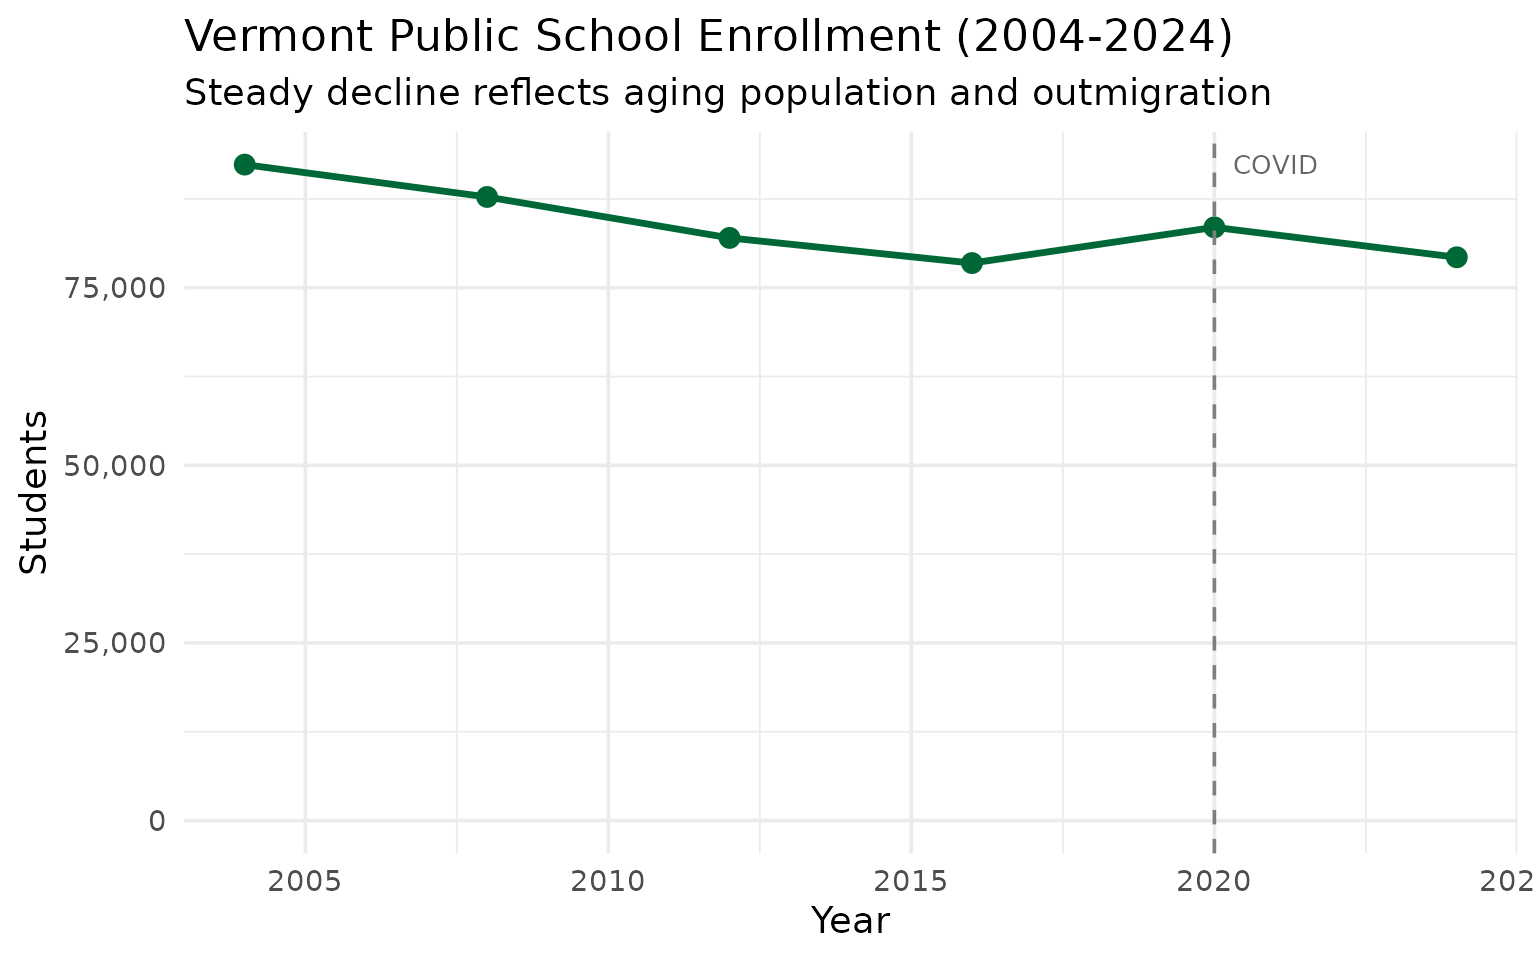
2. Kindergarten Dropped 11% From 2019 to 2021
Vermont’s kindergarten enrollment dropped 11% from 2019 to 2021, as families delayed school entry during the pandemic. That smaller cohort is now moving through the elementary grades.
k_trend <- fetch_enr_multi(2017:2024, use_cache = TRUE)

k_enrollment <- k_trend |>
  filter(is_state, subgroup == "total_enrollment", grade_level == "K") |>
  select(end_year, n_students)

stopifnot(nrow(k_enrollment) > 0)
k_enrollment
#> end_year n_students
#> 1 2017 5786
#> 2 2018 5975
#> 3 2019 5826
#> 4 2020 5879
#> 5 2021 5157
#> 6 2022 5699
#> 7 2023 5404
#> 8 2024 5191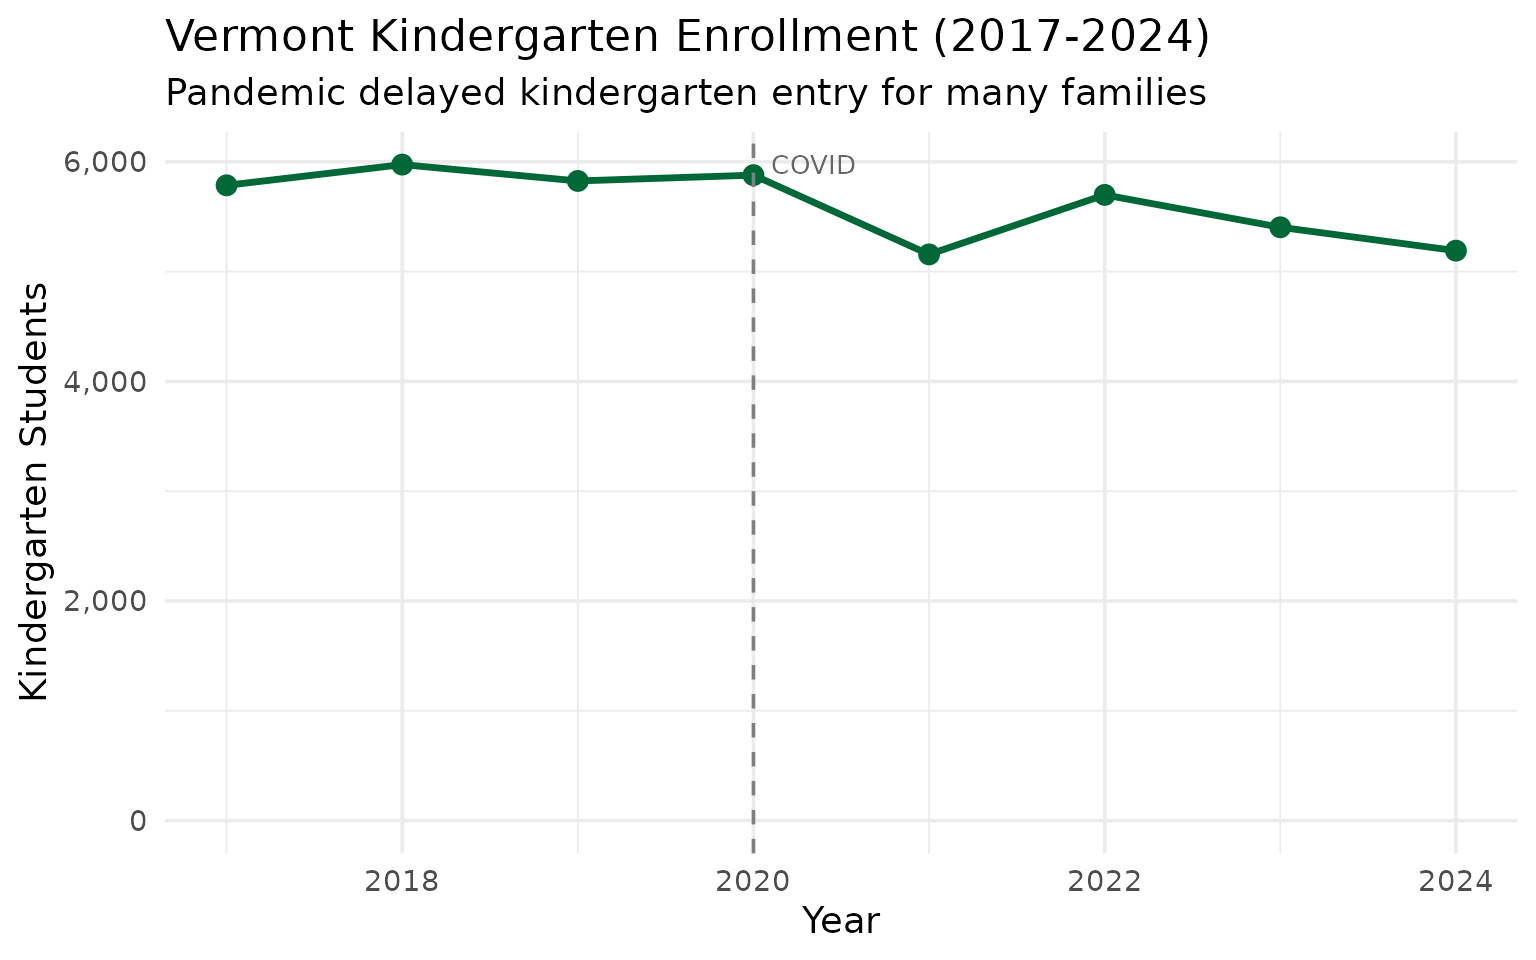
3. The Tiniest Schools in America
Vermont is home to some of the smallest public schools in the nation. Dozens of schools enroll fewer than 100 students, and some serve only a handful of children.
tiny_schools <- enr_2024 |>
  filter(is_campus, subgroup == "total_enrollment", grade_level == "TOTAL") |>
  filter(n_students > 0, n_students < 100) |>
  mutate(size_bin = cut(n_students, breaks = c(0, 25, 50, 75, 100),
                        labels = c("1-25", "26-50", "51-75", "76-99"))) |>
  count(size_bin)

stopifnot(nrow(tiny_schools) > 0)
tiny_schools
#> size_bin n
#> 1 1-25 3
#> 2 26-50 10
#> 3 51-75 21
#> 4 76-99 25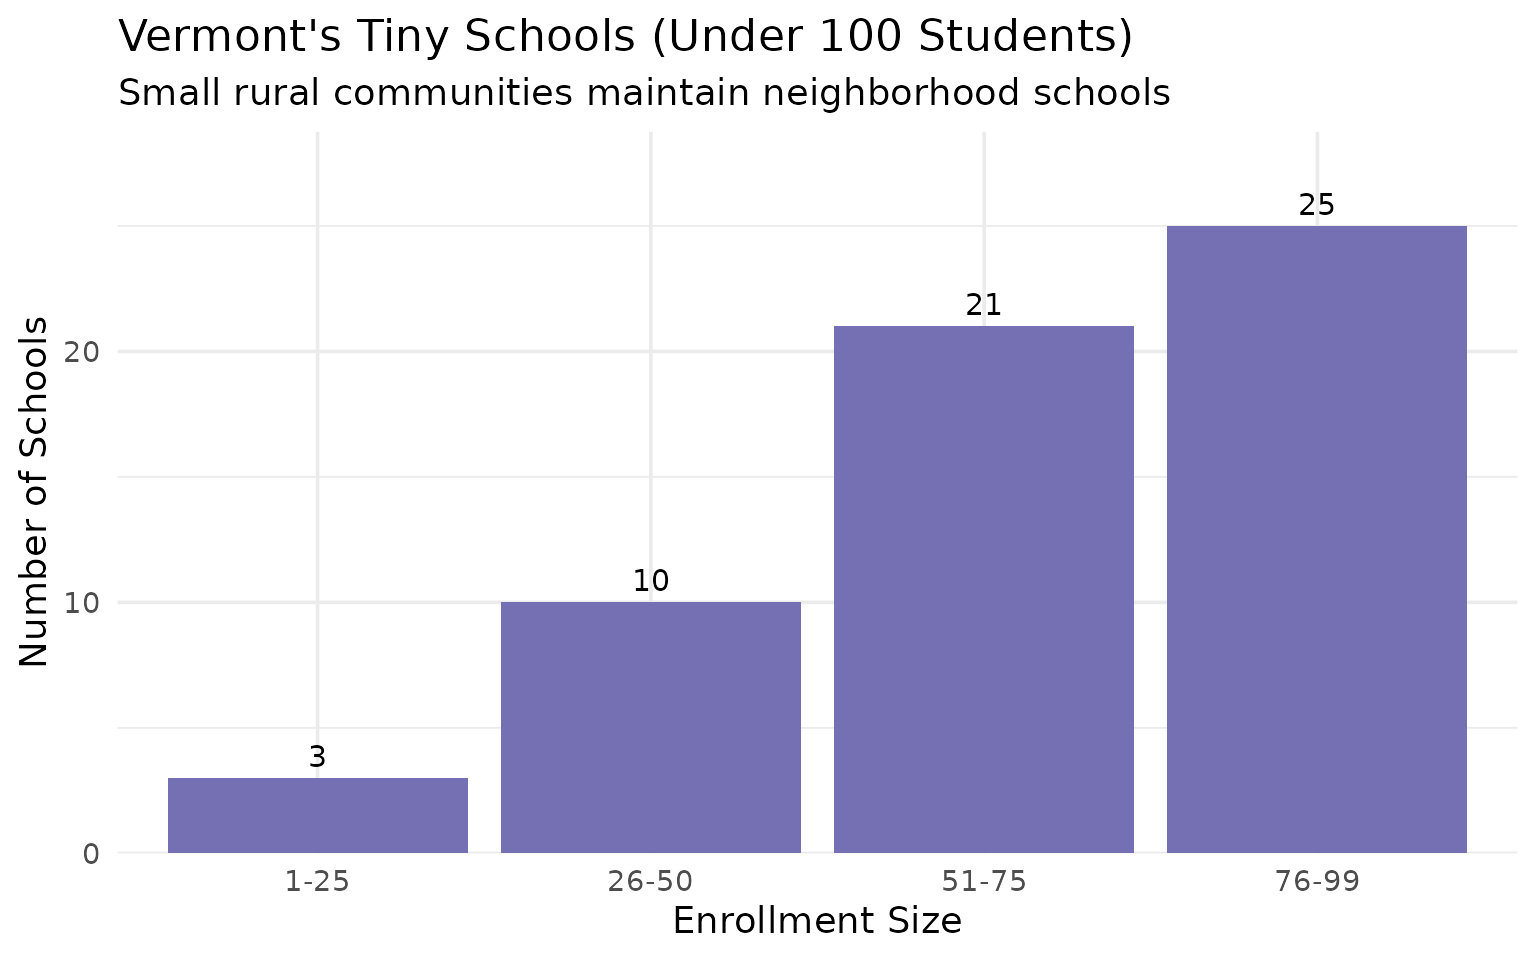
Data Taxonomy
| Category | Years | Function | Details |
|---|---|---|---|
| Enrollment | 2004-2024 |
fetch_enr() / fetch_enr_multi()
|
State, district, school. Total enrollment by grade |
| Assessments | — | — | — |
| Graduation | — | — | — |
| Directory | 2001-2022 | fetch_directory() |
School names, addresses, coordinates, principals, superintendents |
| Per-Pupil Spending | — | — | — |
| Accountability | — | — | — |
| Chronic Absence | — | — | — |
| EL Progress | — | — | — |
| Special Ed | — | — | — |
See DATA-CATEGORY-TAXONOMY.md for what each category covers.
Quick Start
R
# install.packages("devtools")
devtools::install_github("almartin82/vtschooldata")

library(vtschooldata)
library(dplyr)

# Get 2024 enrollment data (2023-24 school year)
enr <- fetch_enr(2024, use_cache = TRUE)

# Statewide total
enr |>
  filter(is_state, subgroup == "total_enrollment", grade_level == "TOTAL") |>
  pull(n_students)
#> 79288

# Top 5 supervisory unions (aggregated from campus data)
enr |>
  filter(is_campus, subgroup == "total_enrollment", grade_level == "TOTAL") |>
  group_by(district_name) |>
  summarize(n_students = sum(n_students, na.rm = TRUE)) |>
  arrange(desc(n_students)) |>
  head(5)
Python
import pyvtschooldata as vt

# Fetch 2024 data (2023-24 school year)
enr = vt.fetch_enr(2024)

# Statewide total
total = enr[(enr['is_state']) & (enr['grade_level'] == 'TOTAL')]['n_students'].sum()
print(f"{total:,} students")
#> 79,288 students

# Get multiple years
enr_multi = vt.fetch_enr_multi([2020, 2021, 2022, 2023, 2024])

# Check available years
years = vt.get_available_years()
print(f"Data available: {years['min_year']}-{years['max_year']}")
#> Data available: 2004-2024
Explore More
- Full documentation — all 15 stories with interactive charts
- Enrollment trends vignette — 15 stories
- Function reference
Data Notes
Data Source: Vermont Agency of Education via the Vermont Education Dashboard
Available Years: 2004-2024 (21 years)
Census Day: Vermont enrollment counts are taken on the first school day in October (typically the first Monday).
Suppression Rules: Small cells (<11 students) may be suppressed to protect student privacy.
Known Issues: - 2017-18 data has quality issues with significantly lower counts - 2018 and 2020 data lack district_name for campuses, limiting cross-year district comparisons - District names changed format between years (e.g., “BURLINGTON SD” vs “BURLINGTON SUPERVISORY DISTRICT”) - Kindergarten may be split into full-time/part-time in some years
Coverage: ~82,000 students across ~300 schools and 52 supervisory unions.
Deeper Dive
4. Burlington Leads a Small State
Vermont organizes schools into Supervisory Unions (SUs) and Supervisory Districts (SDs). Burlington is among the largest, but even the biggest districts are small by national standards.
Note: Vermont data reports at the school (campus) level. To see supervisory union totals, we aggregate campus data by district name.
enr_2024 <- fetch_enr(2024, use_cache = TRUE)

# Aggregate campus data to get district totals
top_districts <- enr_2024 |>
  filter(is_campus, subgroup == "total_enrollment", grade_level == "TOTAL") |>
  group_by(district_name) |>
  summarize(n_students = sum(n_students, na.rm = TRUE), .groups = "drop") |>
  arrange(desc(n_students)) |>
  head(10)

stopifnot(nrow(top_districts) > 0)
top_districts
#> # A tibble: 10 x 2
#> district_name n_students
#> <chr> <dbl>
#> 1 CHAMPLAIN VALLEY SUPERVISORY DISTRICT 4150
#> 2 ESSEX-WESTFORD SUPERVISORY DISTRICT 3703
#> 3 BURLINGTON SUPERVISORY DISTRICT 3506
#> 4 SOUTHWEST VERMONT SUPERVISORY UNION 3166
#> 5 SOUTH BURLINGTON SUPERVISORY DISTRICT 2693
#> 6 MAPLE RUN SUPERVISORY DISTRICT 2608
#> 7 NORTH COUNTRY SUPERVISORY UNION 2598
#> 8 MOUNT MANSFIELD UNIFIED UNION SCHOOL DISTRICT 2591
#> 9 WINDHAM SOUTHEAST SUPERVISORY UNION 2495
#> 10 COLCHESTER SUPERVISORY DISTRICT 2417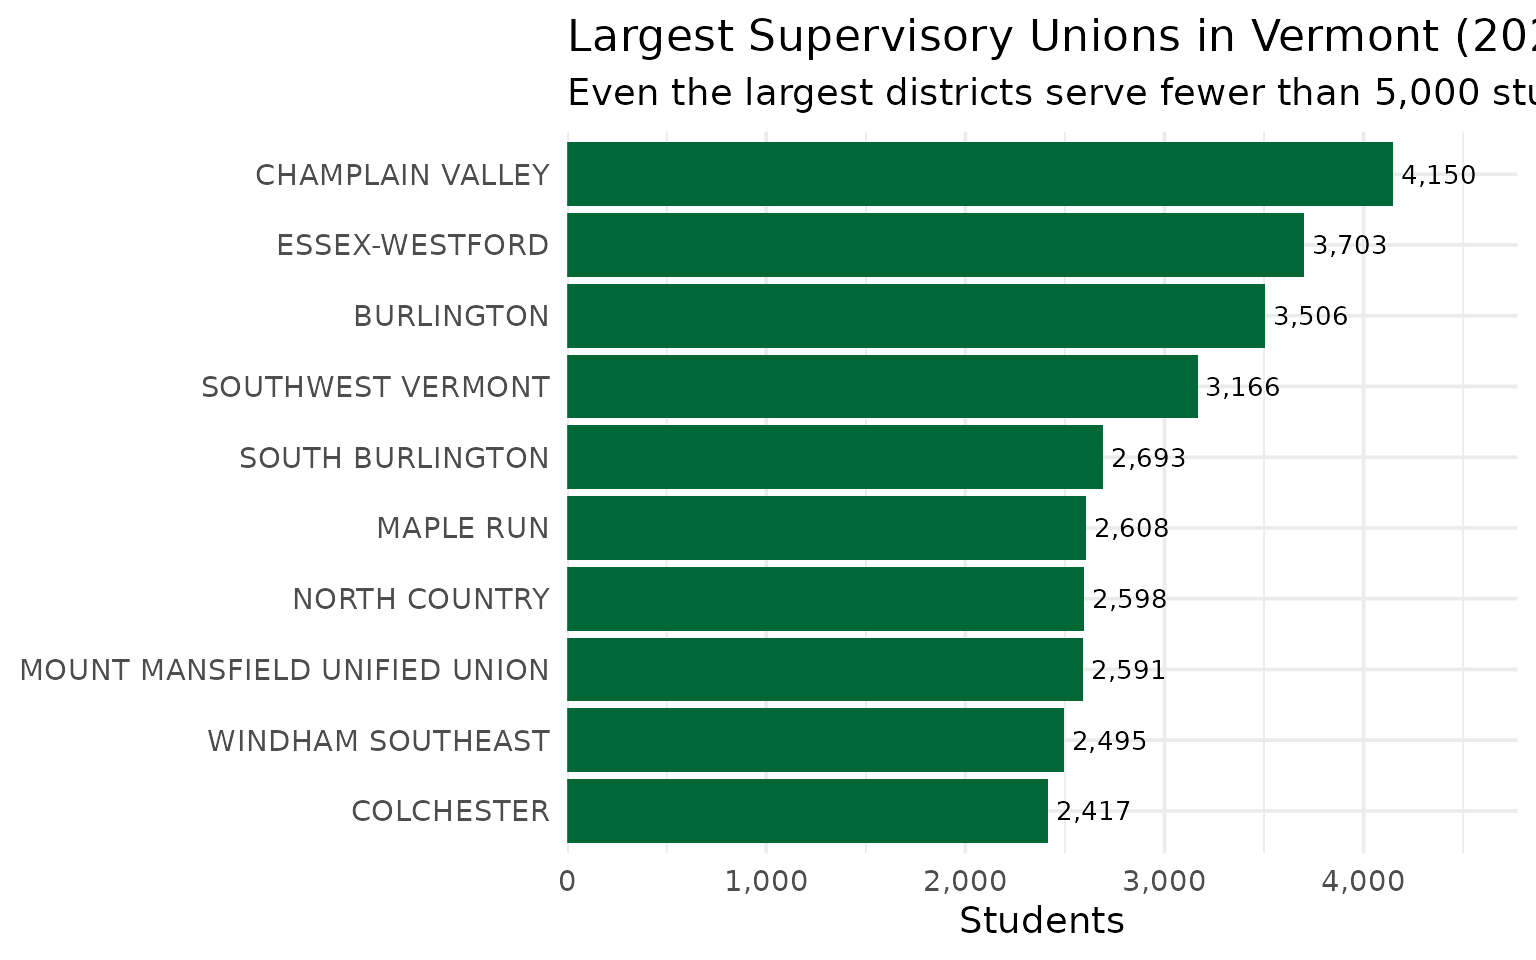
5. Elementary Grades Dominate Vermont Schools
Vermont’s grade distribution shows where students are concentrated. The K-5 grades represent the largest share of enrollment, with Pre-K accounting for a notable 10% of all students.
# Vermont data focuses on grade levels rather than demographic subgroups
grade_levels <- c("PK", "K", "01", "02", "03", "04", "05",
                  "06", "07", "08", "09", "10", "11", "12")
grade_dist <- enr_2024 |>
  filter(is_state, subgroup == "total_enrollment",
         grade_level %in% grade_levels) |>
  mutate(level = case_when(
    grade_level == "PK" ~ "Pre-K",
    grade_level %in% c("K", "01", "02", "03", "04", "05") ~ "Elementary",
    grade_level %in% c("06", "07", "08") ~ "Middle",
    TRUE ~ "High School"
  )) |>
  group_by(level) |>
  summarize(n_students = sum(n_students, na.rm = TRUE), .groups = "drop") |>
  mutate(pct = n_students / sum(n_students) * 100)

stopifnot(nrow(grade_dist) > 0)
grade_dist
#> # A tibble: 4 x 3
#> level n_students pct
#> <chr> <dbl> <dbl>
#> 1 Elementary 33036 41.7
#> 2 High School 21250 26.8
#> 3 Middle 16849 21.3
#> 4 Pre-K 8108 10.2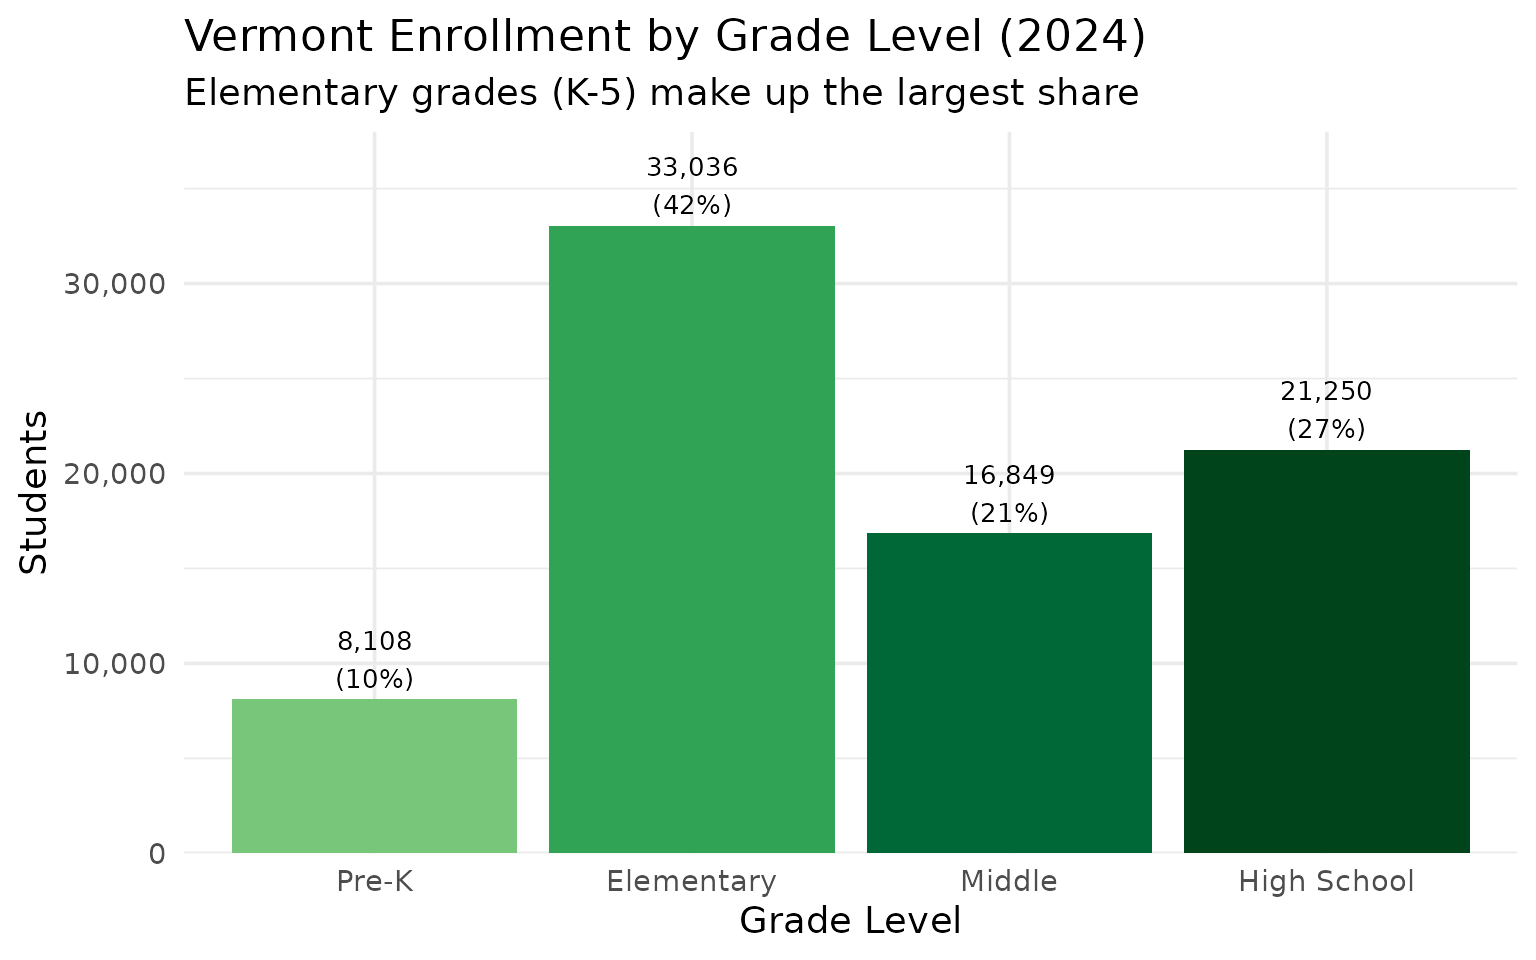
6. Top SUs Hold Steady From 2022 to 2024
Vermont’s largest Supervisory Unions show modest enrollment changes over recent years. District name formats changed across years, so we normalize names by stripping suffixes to compare 2022 and 2024.
library(tidyr)

# Strip SU/SD suffixes for cross-year matching (names changed between years)
strip_suffix <- function(x) {
  x |>
    gsub(" SUPERVISORY UNION$| SUPERVISORY DISTRICT$| SCHOOL DISTRICT$", "", x = _) |>
    gsub(" SU$| SD$", "", x = _) |>
    gsub("-", " ", x = _) |>
    trimws()
}

enr_regional <- fetch_enr_multi(c(2022, 2024), use_cache = TRUE)

# Aggregate to district level using normalized names
district_totals <- enr_regional |>
  filter(is_campus, subgroup == "total_enrollment", grade_level == "TOTAL") |>
  mutate(district_short = strip_suffix(district_name)) |>
  group_by(end_year, district_short) |>
  summarize(n_students = sum(n_students, na.rm = TRUE), .groups = "drop")

# Identify the largest SUs in 2024
top_sus <- district_totals |>
  filter(end_year == 2024) |>
  arrange(desc(n_students)) |>
  head(6) |>
  pull(district_short)

regional_top <- district_totals |>
  filter(district_short %in% top_sus)

stopifnot(nrow(regional_top) > 0)
regional_top |>
  pivot_wider(names_from = end_year, values_from = n_students)
#> # A tibble: 6 x 3
#> district_short `2022` `2024`
#> <chr> <dbl> <dbl>
#> 1 BURLINGTON 3486 3506
#> 2 CHAMPLAIN VALLEY 4215 4150
#> 3 ESSEX WESTFORD 3810 3703
#> 4 MAPLE RUN 2632 2608
#> 5 SOUTH BURLINGTON 2702 2693
#> 6 SOUTHWEST VERMONT 3277 3166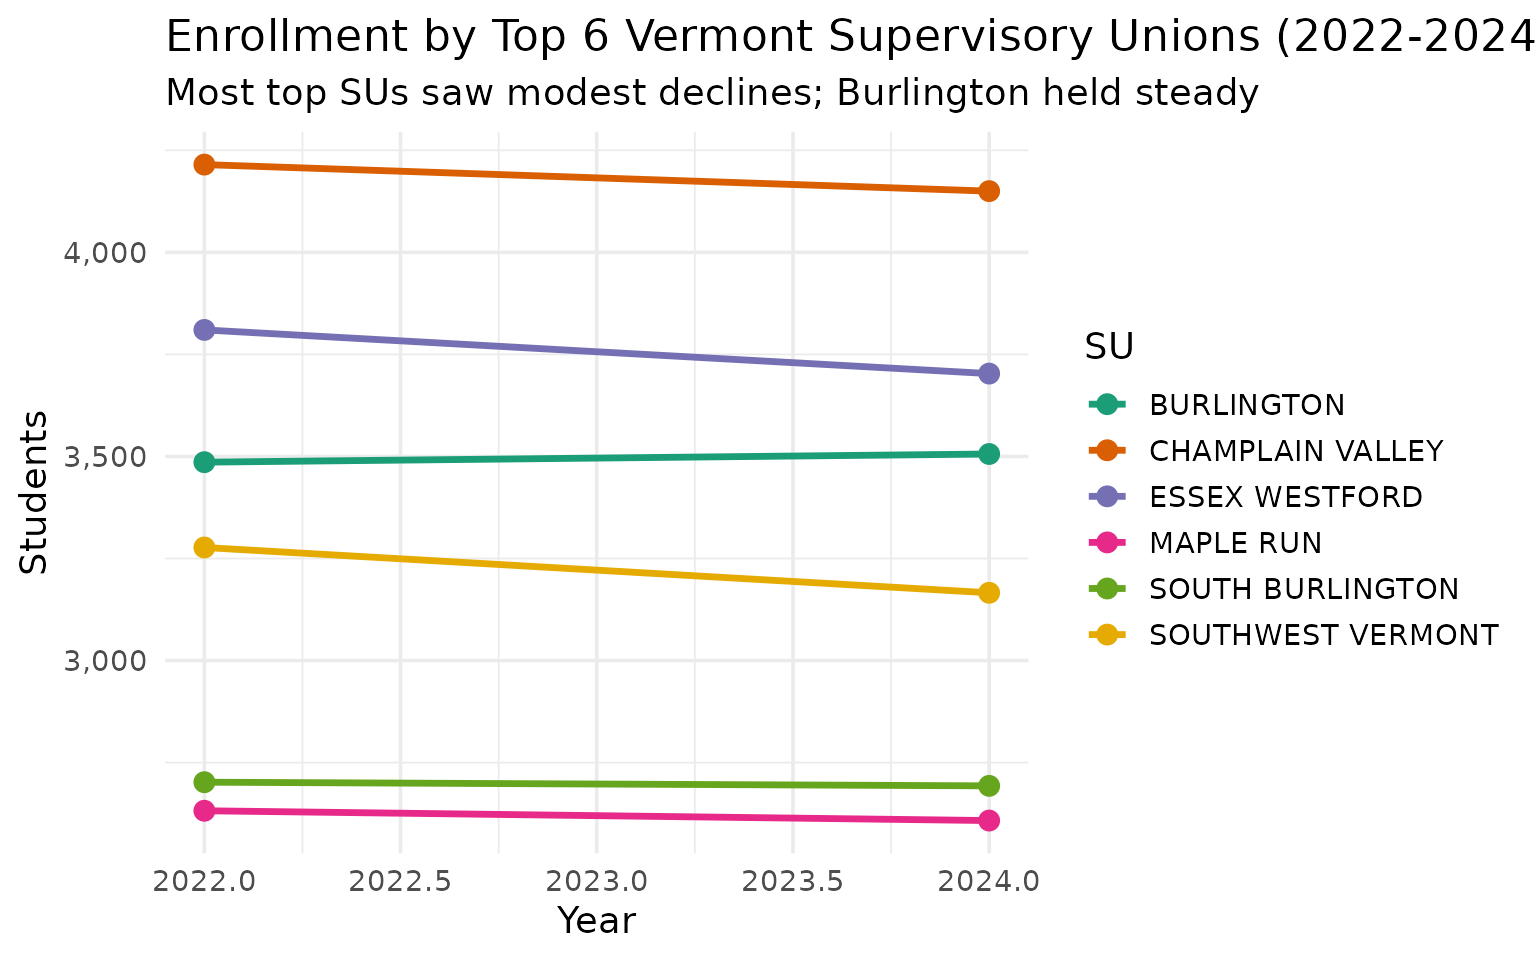
7. Most SUs Serve 1,000-2,000 Students
Vermont is a state of small schools. The plurality of supervisory unions serve between 1,000 and 2,000 students, creating challenges for specialized programs and efficiency.
size_levels <- c("Tiny (<500)", "Small (500-999)",
                 "Medium (1,000-1,999)", "Large (2,000+)")

# Aggregate campus to district level
district_sizes <- enr_2024 |>
  filter(is_campus, subgroup == "total_enrollment", grade_level == "TOTAL") |>
  group_by(district_name) |>
  summarize(n_students = sum(n_students, na.rm = TRUE), .groups = "drop") |>
  mutate(size = case_when(
    n_students >= 2000 ~ "Large (2,000+)",
    n_students >= 1000 ~ "Medium (1,000-1,999)",
    n_students >= 500 ~ "Small (500-999)",
    TRUE ~ "Tiny (<500)"
  )) |>
  count(size) |>
  mutate(size = factor(size, levels = size_levels))

stopifnot(nrow(district_sizes) > 0)
district_sizes
#> # A tibble: 4 x 2
#> size n
#> <fct> <int>
#> 1 Tiny (<500) 4
#> 2 Small (500-999) 10
#> 3 Medium (1,000-1,999) 27
#> 4 Large (2,000+) 11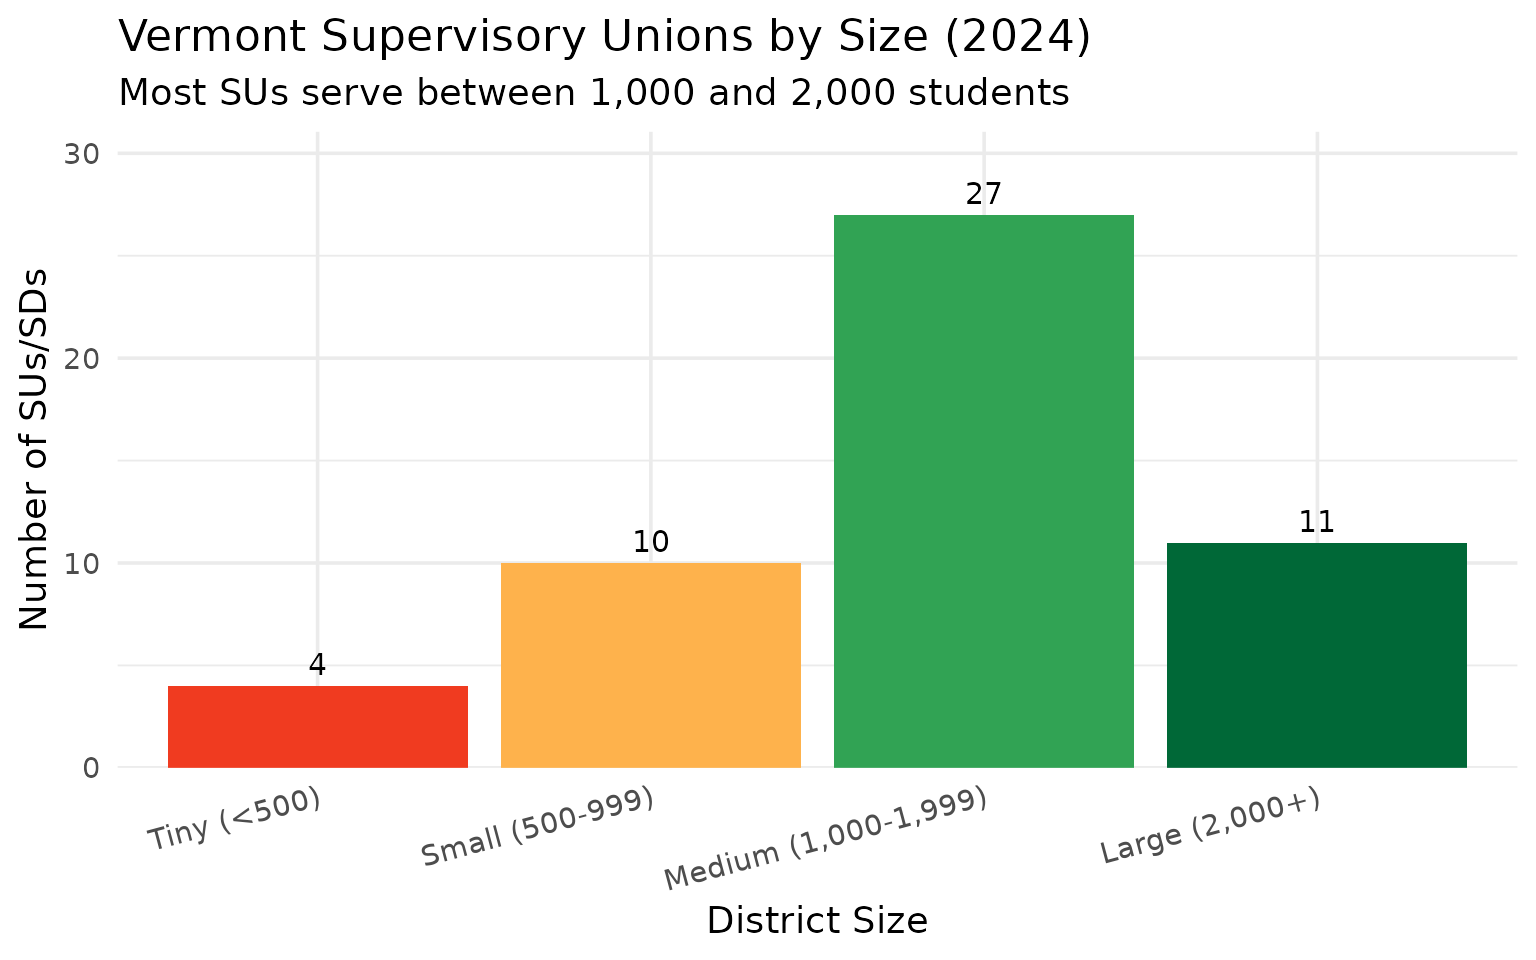
8. The Northeast Kingdom Serves Under 5,000 Students
Vermont’s remote Northeast Kingdom (Essex, Orleans, and Caledonia counties) enrolled fewer than 5,000 students in 2024 – about 6% of the state total. The NEK lost 6% of its students in just two years.
Note: Vermont district names changed format between years and some years have missing district data, so we compare only 2022 and 2024 for consistency. We exclude Essex-Westford (a Chittenden County district) from the NEK match.
# NEK districts: Kingdom East, Caledonia Central, Orleans Central/Southwest, Essex North
# Exclude Essex-Westford (Chittenden County, not NEK)
nek_pattern <- "KINGDOM|CALEDONIA|ORLEANS|ESSEX NORTH"

nek_trend <- fetch_enr_multi(c(2022, 2024), use_cache = TRUE)

nek_districts <- nek_trend |>
  filter(is_campus, subgroup == "total_enrollment", grade_level == "TOTAL") |>
  mutate(district_short = strip_suffix(district_name)) |>
  filter(grepl(nek_pattern, district_short, ignore.case = TRUE)) |>
  group_by(end_year) |>
  summarize(n_students = sum(n_students, na.rm = TRUE), .groups = "drop")

stopifnot(nrow(nek_districts) > 0)
nek_districts
#> end_year n_students
#> 1 2022 4896
#> 2 2024 4599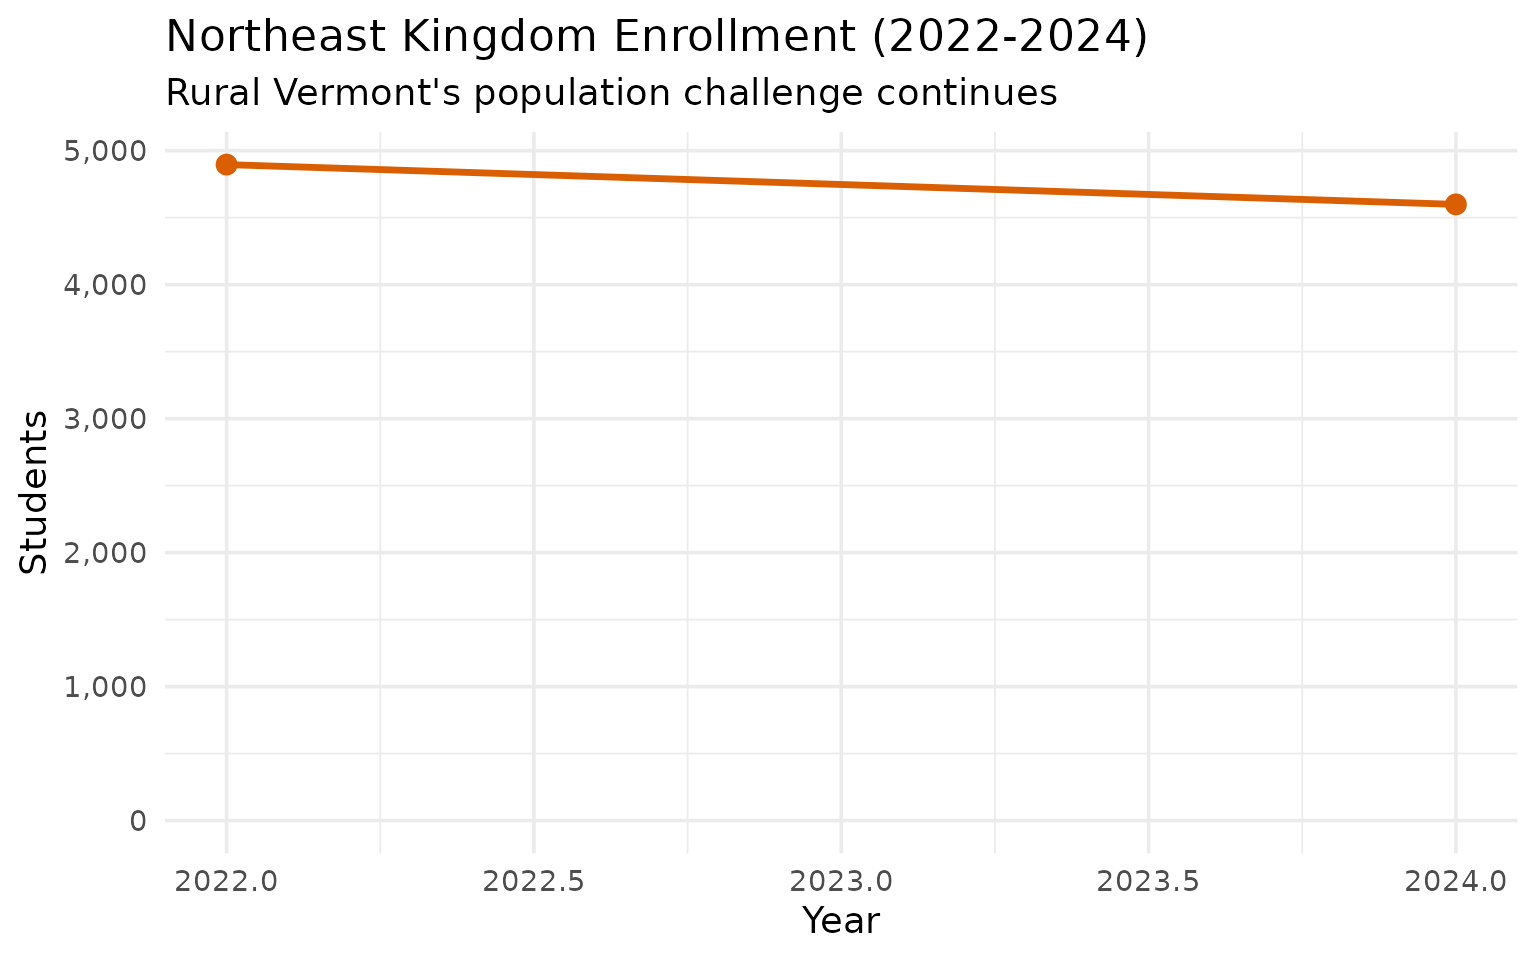
9. High School Holds Steadier Than Elementary
While elementary enrollment has dropped sharply, high school grades have been more stable. Grade 12 enrollment has declined less than kindergarten, reflecting smaller incoming cohorts replacing larger graduating classes.
hs_compare <- fetch_enr_multi(c(2010, 2015, 2020, 2024), use_cache = TRUE)

grade_compare <- hs_compare |>
  filter(is_state, subgroup == "total_enrollment",
         grade_level %in% c("K", "12")) |>
  select(end_year, grade_level, n_students) |>
  mutate(grade_level = factor(grade_level, levels = c("K", "12"),
                              labels = c("Kindergarten", "Grade 12")))

stopifnot(nrow(grade_compare) > 0)
grade_compare
#> end_year grade_level n_students
#> 1 2010 Kindergarten 6205
#> 2 2010 Grade 12 6683
#> 3 2015 Kindergarten 5763
#> 4 2015 Grade 12 5727
#> 5 2020 Kindergarten 5879
#> 6 2020 Grade 12 5088
#> 7 2024 Kindergarten 5191
#> 8 2024 Grade 12 4823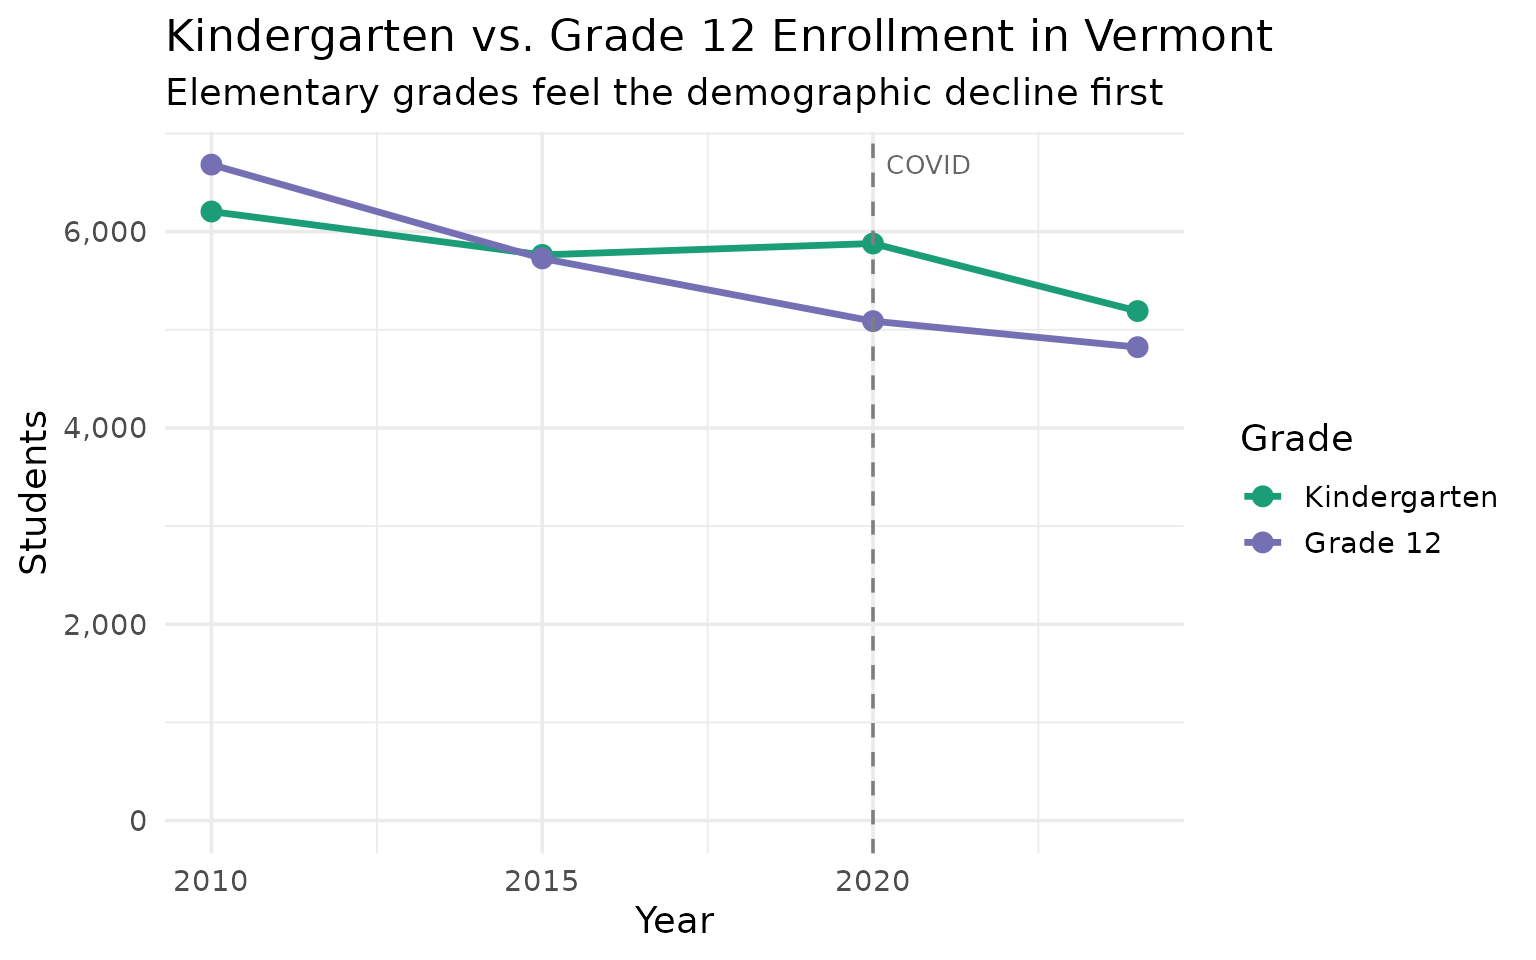
10. Chittenden County Enrolls Nearly a Quarter of Vermont Students
Chittenden County (the Burlington metro area) enrolls about 24% of Vermont’s students. The seven Chittenden County supervisory unions – Burlington, Champlain Valley, Colchester, Essex-Westford, Milton, South Burlington, and Winooski – anchor the state’s enrollment.
Note: Vermont district name formats changed across data years and 2018-2020 data lacks district names, so we compare 2022 and 2024 for consistency.
# Chittenden County SUs: Burlington, Champlain Valley, Colchester,
# Essex-Westford, Milton, South Burlington, Winooski
chittenden_pattern <- "BURLINGTON|SOUTH BURLINGTON|COLCHESTER|ESSEX.WESTFORD|CHAMPLAIN VALLEY|WINOOSKI|MILTON"

chittenden_trend <- fetch_enr_multi(c(2022, 2024), use_cache = TRUE)

chittenden_area <- chittenden_trend |>
  filter(is_campus, subgroup == "total_enrollment", grade_level == "TOTAL") |>
  mutate(district_short = strip_suffix(district_name)) |>
  mutate(region = if_else(
    grepl(chittenden_pattern, district_short, ignore.case = TRUE),
    "Chittenden County", "Rest of Vermont"
  )) |>
  group_by(end_year, region) |>
  summarize(n_students = sum(n_students, na.rm = TRUE), .groups = "drop")

stopifnot(nrow(chittenden_area) > 0)
chittenden_area
#> end_year region n_students
#> 1 2022 Chittenden County 18926
#> 2 2022 Rest of Vermont 61831
#> 3 2024 Chittenden County 18718
#> 4 2024 Rest of Vermont 60570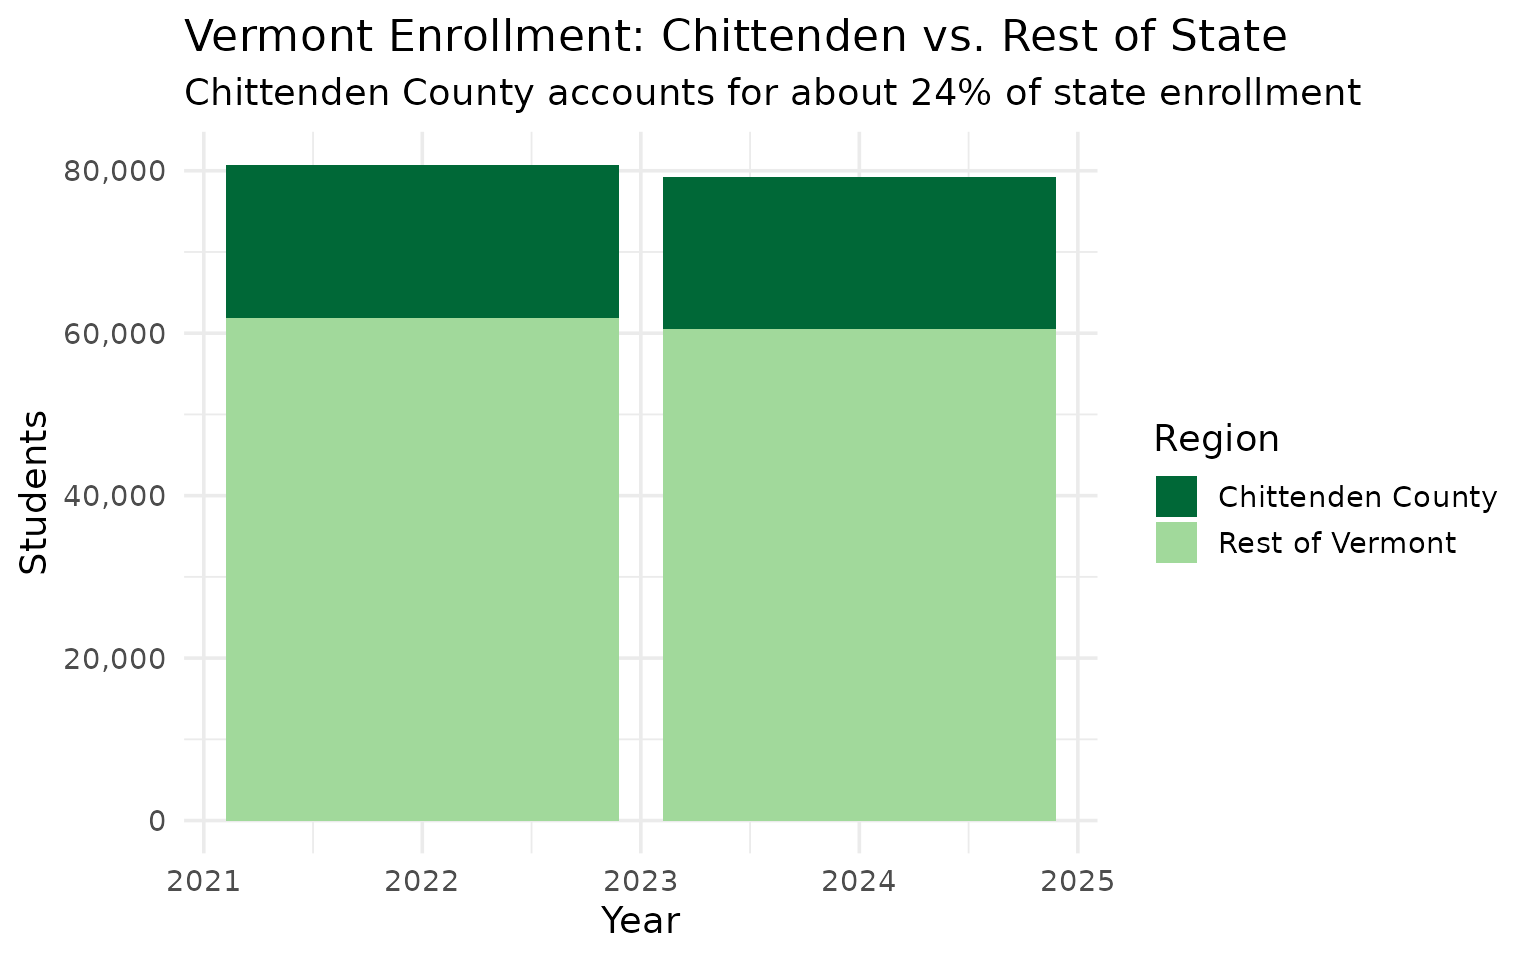
11. 59 Tiny Schools Serve Under 100 Students
Vermont maintains a remarkable number of extremely small schools. These neighborhood schools serve tight-knit rural communities but face efficiency challenges.
tiny_count <- fetch_enr(2024, use_cache = TRUE) |>
  filter(is_campus, subgroup == "total_enrollment", grade_level == "TOTAL") |>
  filter(n_students > 0, n_students < 100) |>
  nrow()

stopifnot(tiny_count > 0)
tiny_count
#> [1] 5912. Half SUs and Half SDs, Plus One Oddity
Vermont’s school governance differs from most states. Schools are organized into Supervisory Unions (SUs) or Supervisory Districts (SDs) that share administrative services, allowing small communities to maintain local schools while pooling resources. One district (SCHOOL ADMINISTRATIVE UNIT #70) fits neither category.
# Count unique district types from campus data
su_types <- enr_2024 |>
  filter(is_campus, subgroup == "total_enrollment", grade_level == "TOTAL") |>
  distinct(district_name) |>
  mutate(type = case_when(
    grepl("SUPERVISORY UNION", district_name) ~ "Supervisory Union",
    grepl("SUPERVISORY DISTRICT|SCHOOL DISTRICT", district_name) ~ "Supervisory District",
    TRUE ~ "Other"
  )) |>
  count(type)

stopifnot(nrow(su_types) > 0)
su_types
#> type n
#> 1 Other 1
#> 2 Supervisory District 26
#> 3 Supervisory Union 2513. Pre-K Enrollment Reaches 8,100 Students
Vermont’s public Pre-K program serves over 8,000 students, accounting for about 10% of total enrollment. Vermont has been a leader in universal pre-K access.
prek <- enr_2024 |>
  filter(is_state, subgroup == "total_enrollment", grade_level == "PK") |>
  select(n_students)

stopifnot(nrow(prek) > 0)
prek
#> n_students
#> 1 810814. Both Regions Declined Slightly From 2022 to 2024
Both Chittenden County and the rest of Vermont saw modest enrollment declines between 2022 and 2024, with the rest of the state losing a slightly larger share.
# Compare 2022 to 2024 by region using chittenden_area data
chittenden_area |>
  pivot_wider(names_from = end_year, values_from = n_students) |>
  mutate(pct_change = round((`2024` - `2022`) / `2022` * 100, 1))
#> region `2022` `2024` pct_change
#> 1 Chittenden County 18926 18718 -1.1
#> 2 Rest of Vermont 61831 60570 -2.015. Data Only Shows Total Enrollment by Grade
Unlike most states, Vermont’s enrollment data focuses on total counts by grade level. Race/ethnicity and special population breakdowns require separate datasets from the Vermont Education Dashboard.
enr_2024 |>
  distinct(subgroup)
#> subgroup
#> 1 total_enrollment