Twenty-five years of Wyoming school enrollment in one package. From 90,065 students in 2000 to a trough of 83,705 in 2005, a peak of 94,002 in 2015, and back to 89,228 by 2024 – a full rollercoaster driven by energy booms and busts, COVID-19, and the sudden emergence of charter schools. Casper ended 2024 with one fewer student than it had in 2000. Sublette County’s gas boom doubled enrollment and it stuck. Fremont County’s Wind River communities kept losing students for a quarter century.
Part of the njschooldata family.
Full documentation – all 15 stories with interactive charts, getting-started guide, and complete function reference.
Highlights
library(wyschooldata)
library(dplyr)
library(tidyr)
library(ggplot2)

theme_set(theme_minimal(base_size = 14))

# Load pre-computed data bundled with the package.
# This ensures vignettes build reliably in CI without network access.
# Falls back to live fetch if bundled data is unavailable.
enr_pdf <- tryCatch(
  readRDS(system.file("extdata", "enr_2000_2007_tidy.rds", package = "wyschooldata")),
  error = function(e) {
    warning("Bundled PDF-era data not found, fetching live data")
    fetch_enr_multi(2000:2007, use_cache = TRUE)
  }
)
if (is.null(enr_pdf) || nrow(enr_pdf) == 0) {
  enr_pdf <- fetch_enr_multi(2000:2007, use_cache = TRUE)
}

enr_modern <- tryCatch(
  readRDS(system.file("extdata", "enr_2008_2024_tidy.rds", package = "wyschooldata")),
  error = function(e) {
    warning("Bundled modern-era data not found, fetching live data")
    fetch_enr_multi(2008:2024, use_cache = TRUE)
  }
)
if (is.null(enr_modern) || nrow(enr_modern) == 0) {
  enr_modern <- fetch_enr_multi(2008:2024, use_cache = TRUE)
}

enr <- bind_rows(enr_pdf, enr_modern)
enr_2024 <- enr |> filter(end_year == 2024)
1. Wyoming’s 25-year enrollment rollercoaster ended where it started
Statewide enrollment fell from 90,065 in 2000 to a trough of 83,705 in 2005, surged to a peak of 94,002 in 2015, then slid back to 89,228 by 2024 – ending just 837 students below where it began.
state_totals <- enr |>
  filter(is_state, subgroup == "total_enrollment", grade_level == "TOTAL") |>
  select(end_year, n_students) |>
  mutate(change = n_students - lag(n_students),
         pct_change = round(change / lag(n_students) * 100, 1))

stopifnot(nrow(state_totals) > 0)
state_totals
#> end_year n_students change pct_change
#> 1 2000 90065 NA NA
#> 2 2001 87897 -2168 -2.4
#> 3 2002 86116 -1781 -2.0
#> 4 2003 84739 -1377 -1.6
#> 5 2004 83772 -967 -1.1
#> 6 2005 83705 -67 -0.1
#> 7 2006 84611 906 1.1
#> 8 2007 85578 967 1.1
#> 9 2008 86519 941 1.1
#> 10 2009 87420 901 1.0
#> 11 2010 88165 745 0.9
#> 12 2011 89476 1311 1.5
#> 13 2012 90993 1517 1.7
#> 14 2013 92218 1225 1.3
#> 15 2014 93303 1085 1.2
#> 16 2015 94002 699 0.7
#> 17 2016 93261 -741 -0.8
#> 18 2017 92976 -285 -0.3
#> 19 2018 93029 53 0.1
#> 20 2019 93832 803 0.9
#> 21 2020 91938 -1894 -2.0
#> 22 2021 91992 54 0.1
#> 23 2022 91640 -352 -0.4
#> 24 2023 90297 -1343 -1.5
#> 25 2024 89228 -1069 -1.2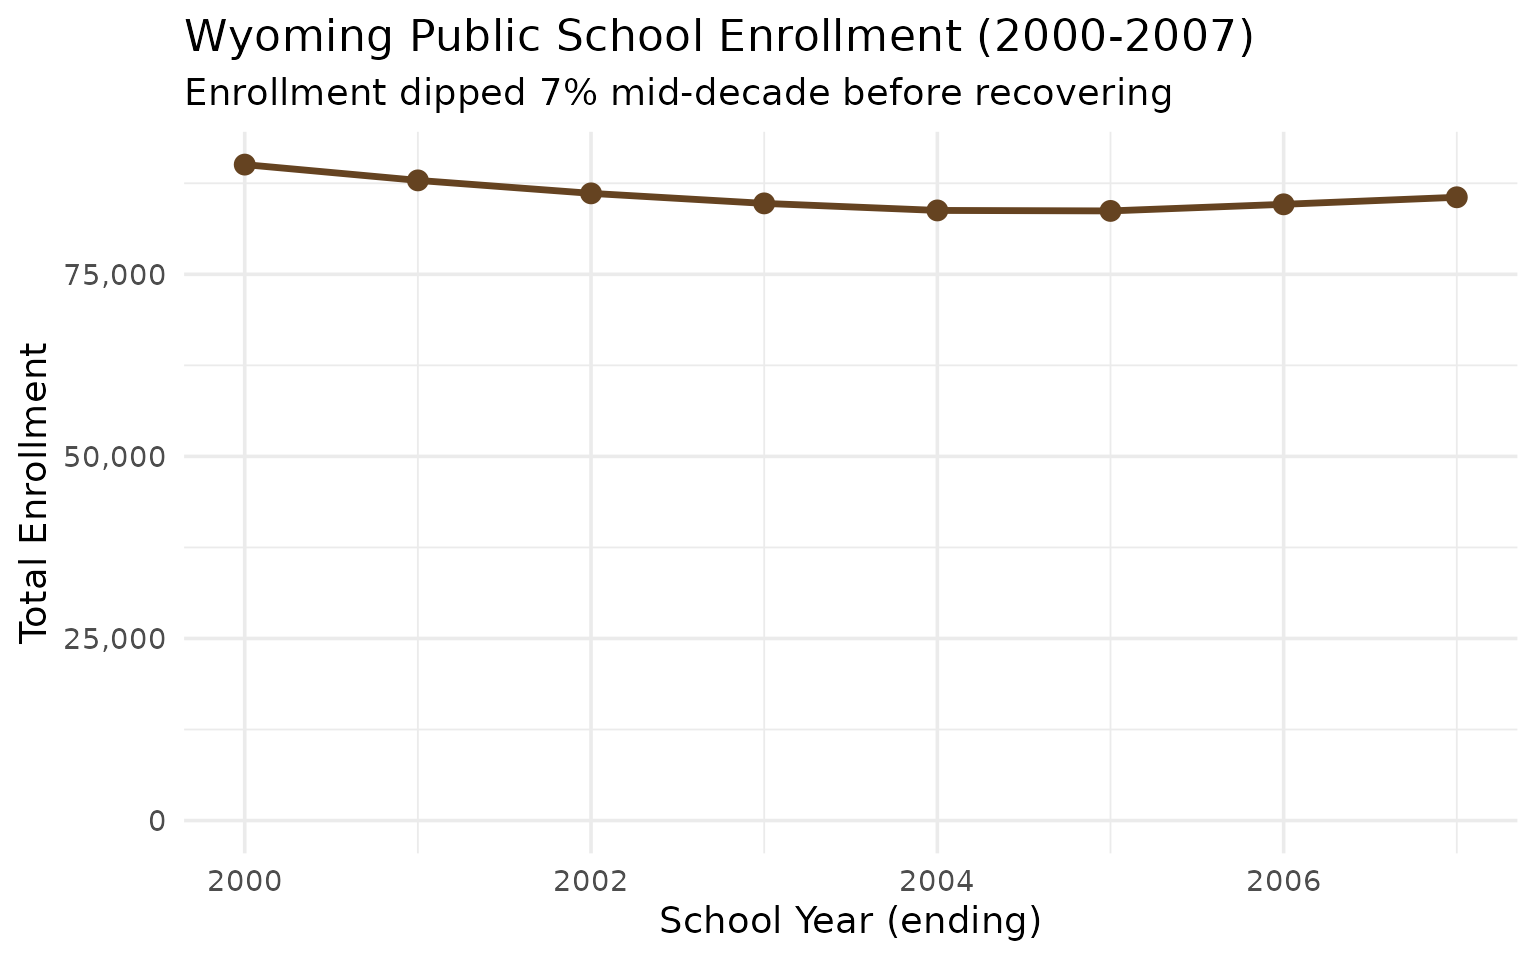
For context: Denver Public Schools alone serves more students than all of Wyoming.
2. Casper ended 2024 with one fewer student than it had in 2000
Natrona #1 (Casper) enrolled 12,038 students in 2000 and 12,037 in 2024 – a difference of exactly one student across a quarter century. In between, it peaked at 13,330 in 2019. Laramie #1 (Cheyenne) tells a similar story: 13,264 in 2000, 13,226 in 2024.
big_two <- enr |>
  filter(is_district, district_name %in% c("Laramie #1", "Natrona #1"),
         subgroup == "total_enrollment", grade_level == "TOTAL") |>
  select(end_year, district_name, n_students)

stopifnot(nrow(big_two) > 0)
big_two |>
  filter(end_year %in% c(2000, 2015, 2019, 2024)) |>
  pivot_wider(names_from = end_year, values_from = n_students) |>
  mutate(change_25yr = `2024` - `2000`)
#> # A tibble: 2 x 6
#> district_name `2000` `2015` `2019` `2024` change_25yr
#> <chr> <dbl> <dbl> <dbl> <dbl> <dbl>
#> 1 Laramie #1 13264 14029 14261 13226 -38
#> 2 Natrona #1 12038 13082 13330 12037 -1
3. After 22 years with exactly 48 districts, charter schools added 3 in two years
Wyoming had exactly 48 school districts from 2000 through 2022. Then charter schools arrived: Wyoming Classical Academy and Prairie View Community School in 2023, plus Cheyenne Classical Academy in 2024, bringing the total to 51.
district_counts <- enr |>
  filter(is_district, subgroup == "total_enrollment", grade_level == "TOTAL") |>
  group_by(end_year) |>
  summarize(n_districts = n_distinct(district_name))

stopifnot(nrow(district_counts) > 0)
district_counts

charter_districts <- enr_2024 |>
  filter(is_district, subgroup == "total_enrollment", grade_level == "TOTAL",
         district_name %in% c("Wyoming Classical Academy",
                              "Prairie View Community School",
                              "Cheyenne Classical Academy")) |>
  select(district_name, n_students) |>
  arrange(desc(n_students))

charter_districts
#> # A tibble: 25 x 2
#> end_year n_districts
#> <int> <int>
#> 1 2000 48
#> 2 2001 48
#> ...
#> 23 2022 48
#> 24 2023 50
#> 25 2024 51
#>
#> district_name n_students
#> 1 Wyoming Classical Academy 298
#> 2 Cheyenne Classical Academy 150
#> 3 Prairie View Community School 90
Data Taxonomy
| Category | Years | Function | Details |
|---|---|---|---|
| Enrollment | 2000-2024 |
fetch_enr() / fetch_enr_multi()
|
State, district, school. Grade-level totals |
| Assessments | – | – | Not yet available |
| Graduation | – | – | Not yet available |
| Directory | Current | fetch_directory() |
District, school. Location, phone, website, accreditation |
| Per-Pupil Spending | – | – | Not yet available |
| Accountability | – | – | Not yet available |
| Chronic Absence | – | – | Not yet available |
| EL Progress | – | – | Not yet available |
| Special Ed | – | – | Not yet available |
See DATA-CATEGORY-TAXONOMY.md for what each category covers.
Quick Start
R
# install.packages("devtools")
devtools::install_github("almartin82/wyschooldata")

library(wyschooldata)
library(dplyr)

# Get 2024 enrollment data (2023-24 school year)
enr <- fetch_enr(2024)

# Statewide total
enr |>
  filter(is_state, subgroup == "total_enrollment", grade_level == "TOTAL") |>
  pull(n_students)
#> 89228

# Top 5 districts
enr |>
  filter(is_district, subgroup == "total_enrollment", grade_level == "TOTAL") |>
  arrange(desc(n_students)) |>
  select(district_name, n_students) |>
  head(5)
Python
import pywyschooldata as wy

# Fetch 2024 data (2023-24 school year)
enr = wy.fetch_enr(2024)

# Statewide total
total = enr[(enr['is_state'] == True) &
            (enr['subgroup'] == 'total_enrollment') &
            (enr['grade_level'] == 'TOTAL')]['n_students'].sum()
print(f"{total:,} students")
#> 89,228 students

# Get multiple years
enr_multi = wy.fetch_enr_multi([2000, 2010, 2020, 2024])

# Check available years
years = wy.get_available_years()
print(f"Data available: {years['min_year']}-{years['max_year']}")
#> Data available: 2000-2024
Explore More
- Full documentation – 15 stories
- Enrollment trends vignette – 15 stories
- Function reference
Data Notes
- Source: Wyoming Department of Education
- Available years: 2000-2024
- PDF Era (2000-2007): Grade-level totals from archived enrollment reports
- Modern Era (2008-2024): Individual-school data from the WDE reporting portal, downloaded via headless browser; bundled as RDS fallback
- Entities: ~340-382 schools across 48-51 districts, plus state-level aggregates
- Census Day: October 1 enrollment counts (Wyoming’s official count date)
- Suppression: Small cell sizes may be suppressed by WDE in source data
Deeper Dive
4. COVID erased Wyoming’s growth – enrollment still hasn’t recovered
Wyoming peaked at 93,832 students in 2019, then lost 1,894 in the pandemic year alone. By 2024, enrollment had fallen further to 89,228 – still 4,604 students below the pre-COVID peak.
covid_window <- state_totals |>
  filter(end_year >= 2015)

stopifnot(nrow(covid_window) > 0)
covid_window
#> end_year n_students change pct_change
#> 16 2015 94002 699 0.7
#> 17 2016 93261 -741 -0.8
#> 18 2017 92976 -285 -0.3
#> 19 2018 93029 53 0.1
#> 20 2019 93832 803 0.9
#> 21 2020 91938 -1894 -2.0
#> 22 2021 91992 54 0.1
#> 23 2022 91640 -352 -0.4
#> 24 2023 90297 -1343 -1.5
#> 25 2024 89228 -1069 -1.2
5. Cheyenne and Casper: 28% of Wyoming students for 25 straight years
Laramie #1 (Cheyenne) and Natrona #1 (Casper) together enroll 28% of all Wyoming students – a share that hasn’t budged from 28-29% in a quarter century.
top_districts <- enr_2024 |>
  filter(is_district, subgroup == "total_enrollment", grade_level == "TOTAL") |>
  arrange(desc(n_students)) |>
  head(8) |>
  select(district_name, n_students)

stopifnot(nrow(top_districts) > 0)
top_districts
#> district_name n_students
#> 1 Laramie #1 13226
#> 2 Natrona #1 12037
#> 3 Campbell #1 8459
#> 4 Sweetwater #1 4789
#> 5 Albany #1 3710
#> 6 Sheridan #2 3454
#> 7 Lincoln #2 2924
#> 8 Teton #1 2827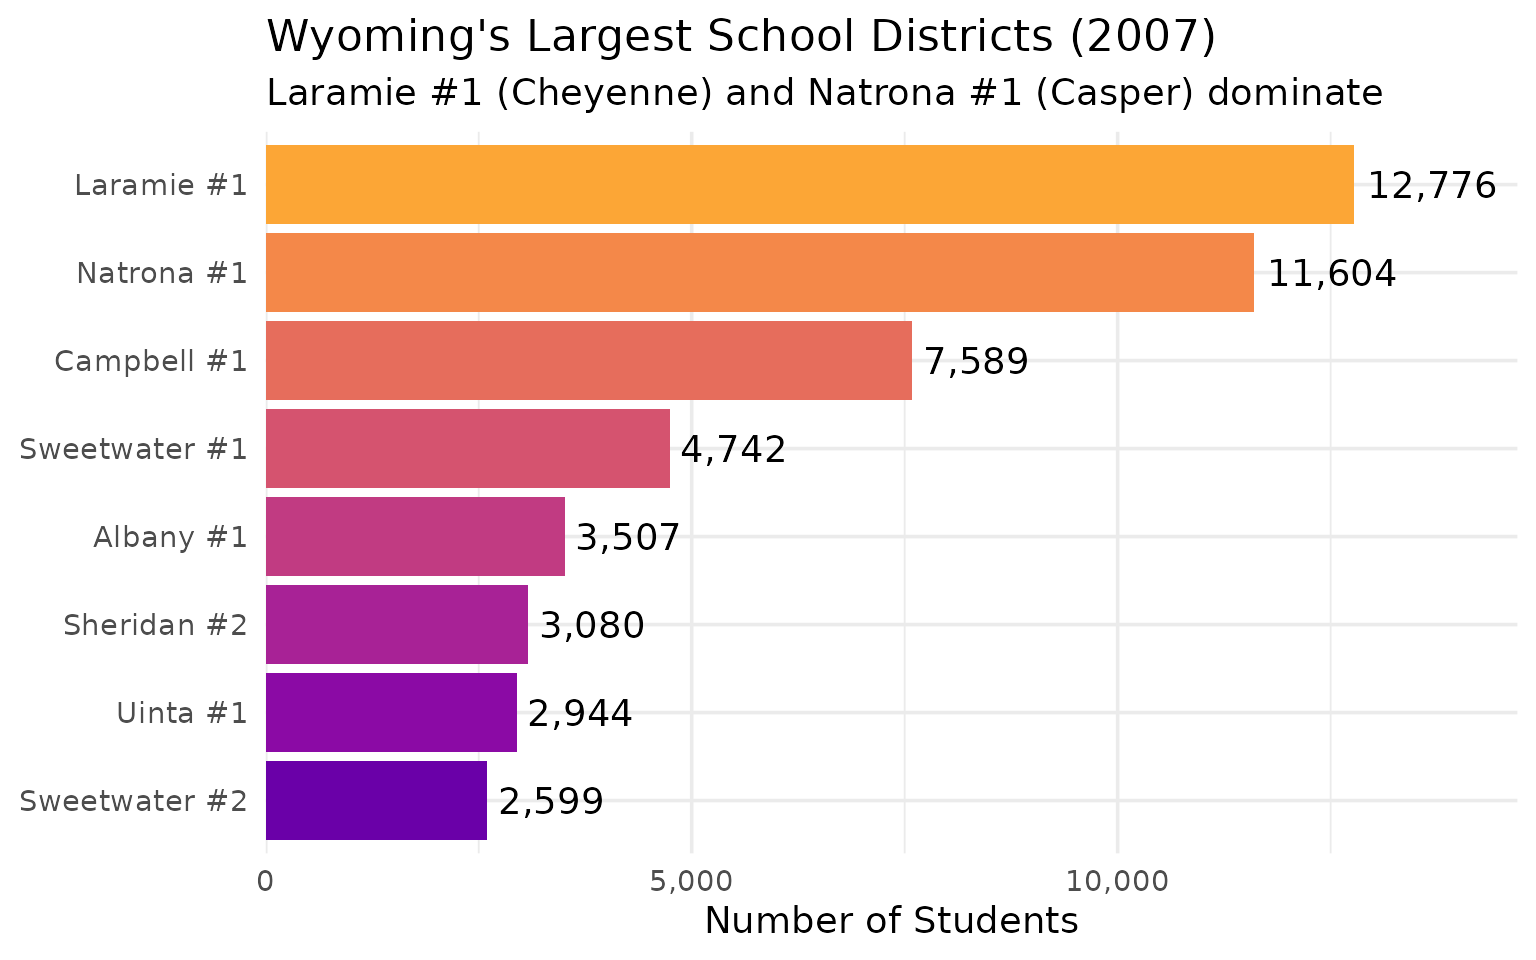
6. Sublette County’s gas boom doubled enrollment – and it stuck
Sublette #1 (Pinedale) grew from 639 students in 2000 to 1,120 by 2019 – a 75% increase driven by the Jonah and Pinedale Anticline gas fields. Even after the boom cooled, enrollment held above 1,000 through 2024.
sublette <- enr |>
  filter(is_district, district_name == "Sublette #1",
         subgroup == "total_enrollment", grade_level == "TOTAL") |>
  select(end_year, n_students) |>
  mutate(pct_change = round((n_students / lag(n_students) - 1) * 100, 1))

stopifnot(nrow(sublette) > 0)
sublette
#> end_year n_students pct_change
#> 1 2000 639 NA
#> 2 2001 630 -1.4
#> 3 2002 671 6.5
#> 4 2003 689 2.7
#> 5 2004 701 1.7
#> 6 2005 767 9.4
#> 7 2006 841 9.6
#> 8 2007 940 11.8
#> 9 2008 989 5.2
#> 10 2009 978 -1.1
#> 11 2010 1020 4.3
#> 12 2011 1043 2.3
#> 13 2012 1018 -2.4
#> 14 2013 1034 1.6
#> 15 2014 1035 0.1
#> 16 2015 1041 0.6
#> 17 2016 1065 2.3
#> 18 2017 1064 -0.1
#> 19 2018 1115 4.8
#> 20 2019 1120 0.4
#> 21 2020 1044 -6.8
#> 22 2021 1065 2.0
#> 23 2022 1092 2.5
#> 24 2023 1071 -1.9
#> 25 2024 1032 -3.6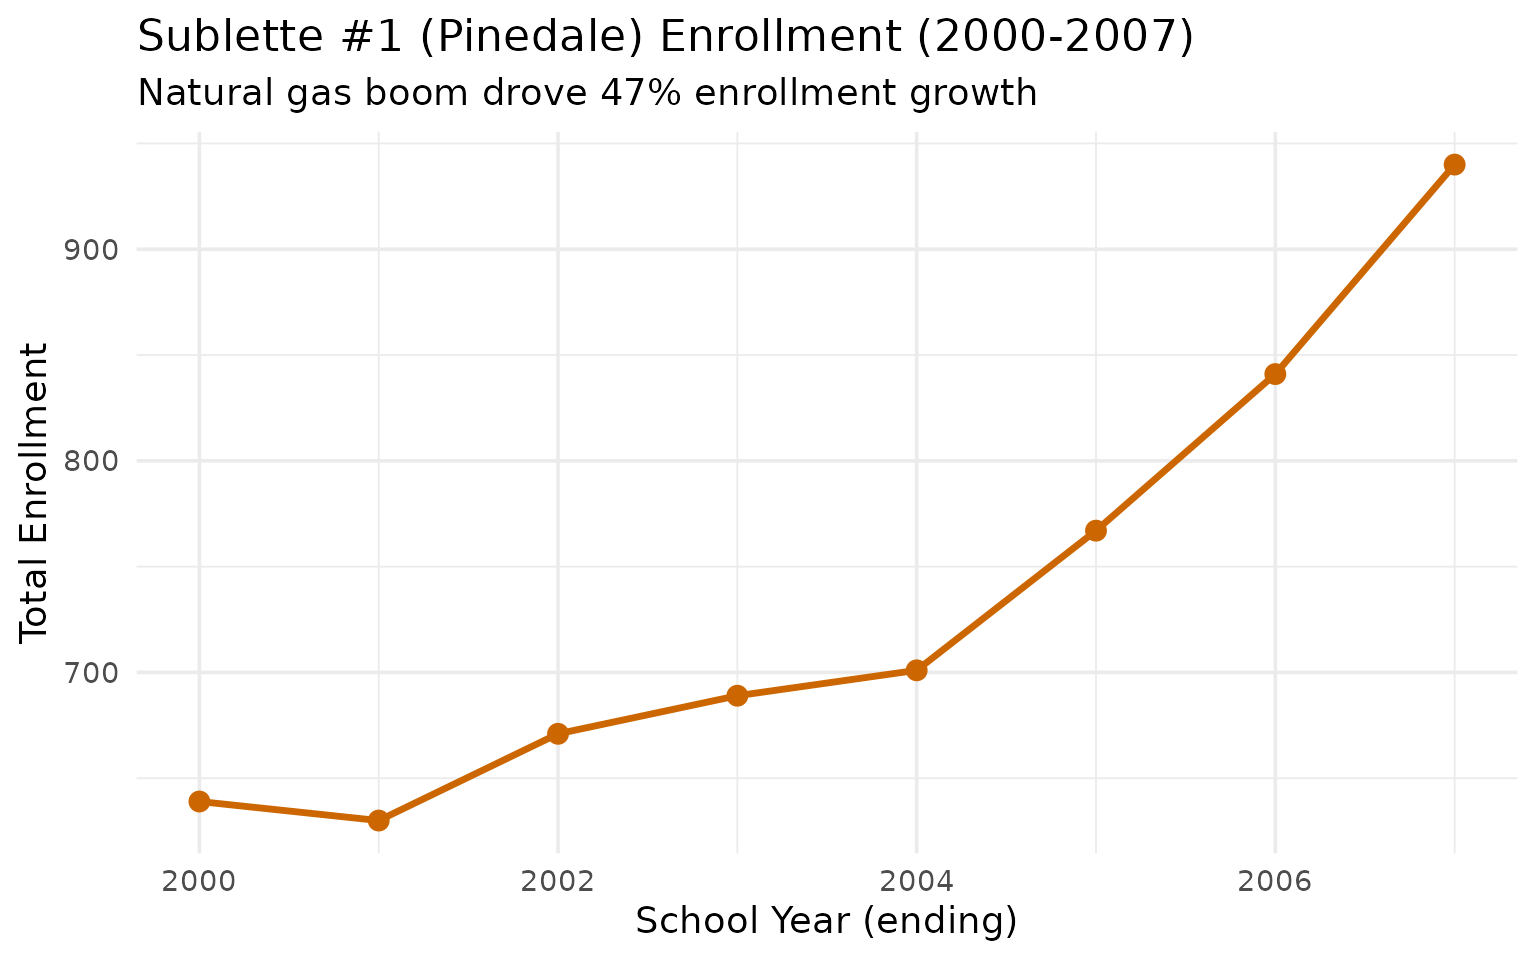
7. Campbell County rode coal to a 22% surge, then gave half back
Campbell #1 (Gillette) grew from 7,488 students in 2000 to a peak of 9,177 in 2015 as Powder River Basin coal production surged. When coal declined, enrollment retreated to 8,459 by 2024 – still 13% above 2000 but well off the peak.
campbell_summary <- enr |>
  filter(is_district, district_name == "Campbell #1",
         subgroup == "total_enrollment", grade_level == "TOTAL") |>
  select(end_year, n_students) |>
  mutate(pct_change = round((n_students / lag(n_students) - 1) * 100, 1))

stopifnot(nrow(campbell_summary) > 0)
campbell_summary
#> end_year n_students pct_change
#> 1 2000 7488 NA
#> 2 2001 7441 -0.6
#> 3 2002 7368 -1.0
#> 4 2003 7234 -1.8
#> 5 2004 7198 -0.5
#> 6 2005 7337 1.9
#> 7 2006 7617 3.8
#> 8 2007 7589 -0.4
#> 9 2008 7985 5.2
#> 10 2009 8214 2.9
#> 11 2010 8301 1.1
#> 12 2011 8337 0.4
#> 13 2012 8705 4.4
#> 14 2013 8826 1.4
#> 15 2014 9134 3.5
#> 16 2015 9177 0.5
#> 17 2016 8726 -4.9
#> 18 2017 8708 -0.2
#> 19 2018 8721 0.1
#> 20 2019 8830 1.2
#> 21 2020 8567 -3.0
#> 22 2021 8633 0.8
#> 23 2022 8636 0.0
#> 24 2023 8571 -0.8
#> 25 2024 8459 -1.3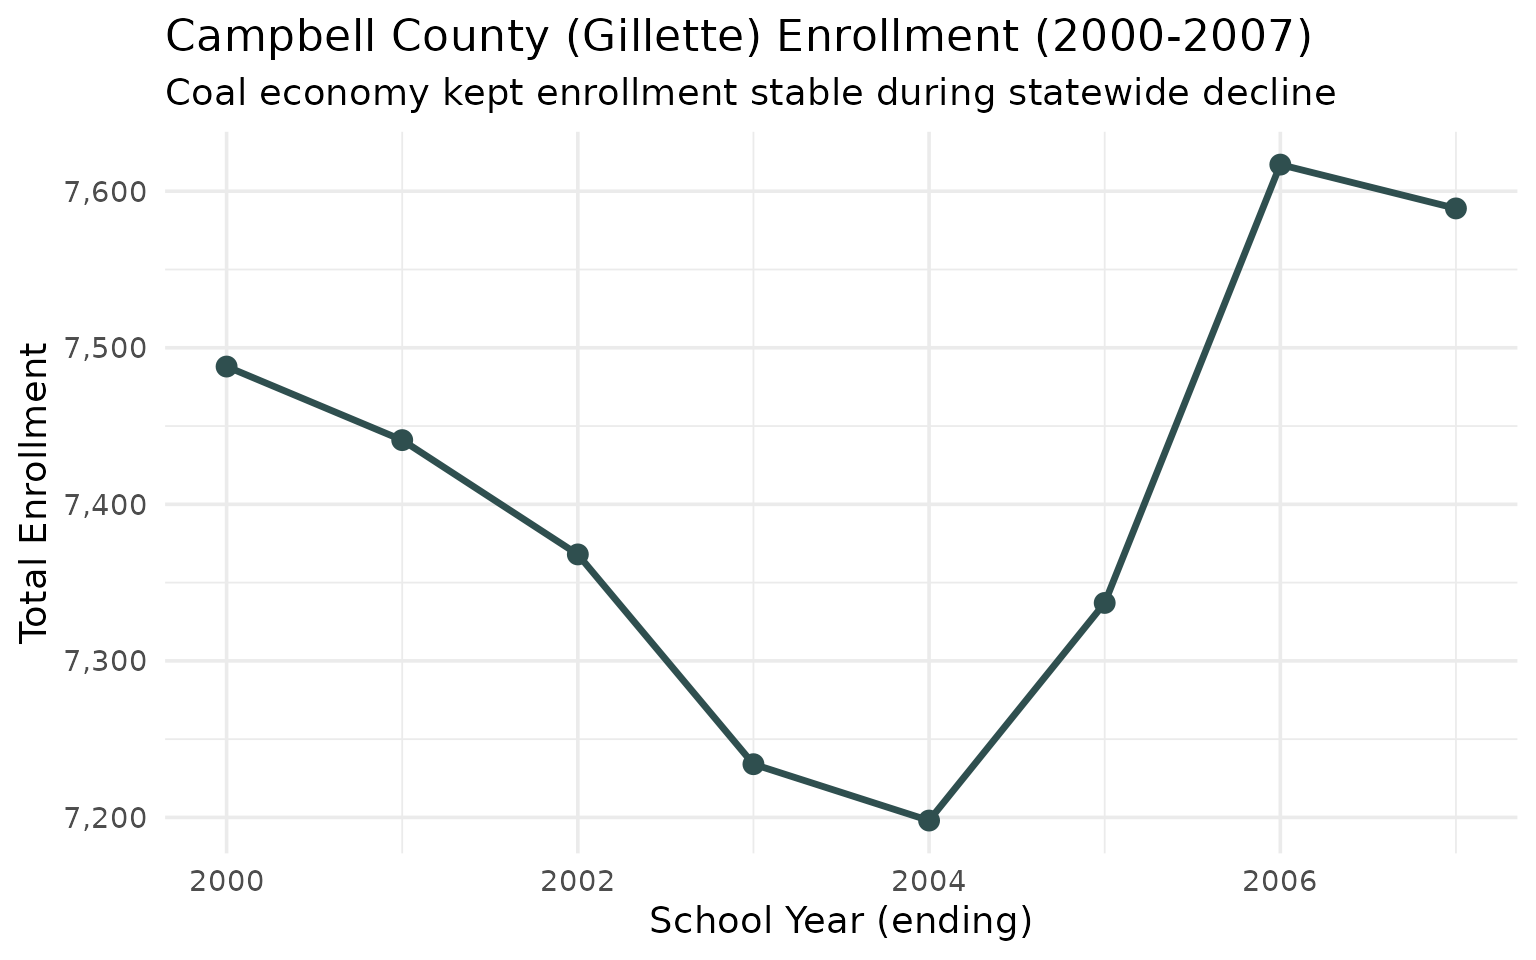
8. Fremont County lost 1,099 students in 25 years – the Wind River drain continues
Home to the Wind River Reservation, Fremont County’s eight districts shed 15% of their students between 2000 and 2024. The decline briefly reversed in the 2010s before resuming after COVID.
fremont <- enr |>
  filter(is_district, subgroup == "total_enrollment", grade_level == "TOTAL",
         grepl("Fremont", district_name)) |>
  group_by(end_year) |>
  summarize(total = sum(n_students, na.rm = TRUE)) |>
  mutate(pct_change = round((total / lag(total) - 1) * 100, 1))

stopifnot(nrow(fremont) > 0)
fremont
#> # A tibble: 25 x 3
#> end_year total pct_change
#> <int> <dbl> <dbl>
#> 1 2000 7273 NA
#> 2 2001 6639 -8.7
#> 3 2002 6504 -2.0
#> 4 2003 6344 -2.5
#> 5 2004 6299 -0.7
#> 6 2005 6373 1.2
#> 7 2006 6360 -0.2
#> 8 2007 6280 -1.3
#> 9 2008 6342 1.0
#> 10 2009 6329 -0.2
#> # ... 15 more rows
#> 25 2024 6174 -3.1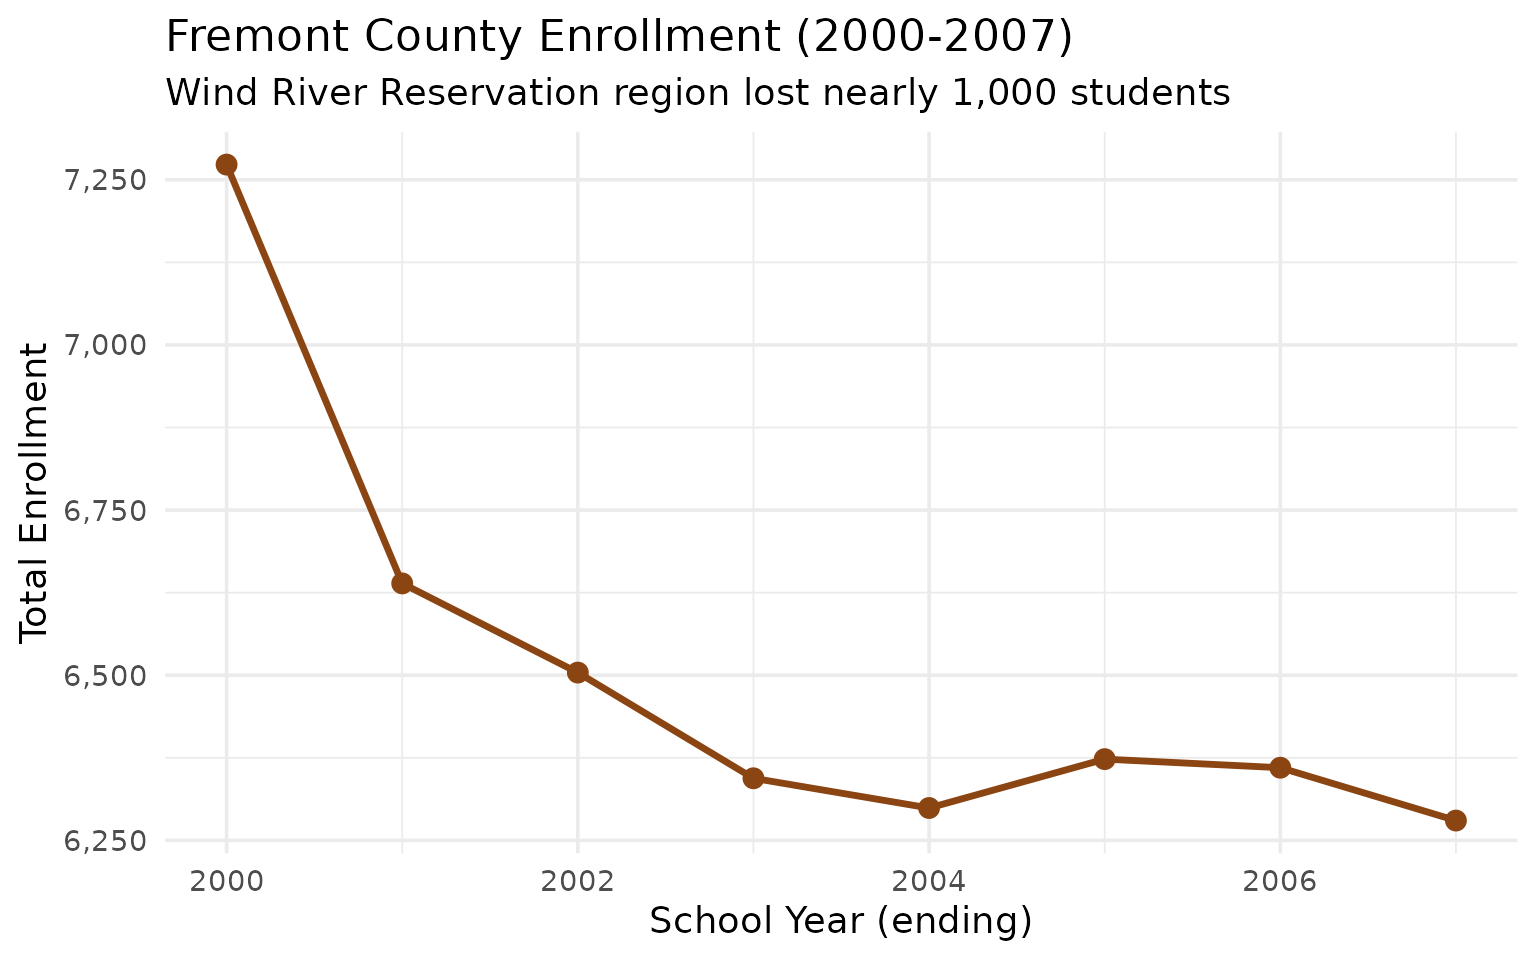
fremont_districts <- enr |>
  filter(is_district, subgroup == "total_enrollment", grade_level == "TOTAL",
         grepl("Fremont", district_name)) |>
  select(end_year, district_name, n_students)

stopifnot(nrow(fremont_districts) > 0)
fremont_districts |>
  filter(end_year %in% c(2000, 2024)) |>
  pivot_wider(names_from = end_year, values_from = n_students) |>
  mutate(change = `2024` - `2000`,
         pct_change = round((`2024` / `2000` - 1) * 100, 1)) |>
  arrange(pct_change)
#> district_name `2000` `2024` change pct_change
#> 1 Fremont #2 291 182 -109 -37.5
#> 2 Fremont #21 530 394 -136 -25.7
#> 3 Fremont #1 1996 1566 -430 -21.5
#> 4 Fremont #38 538 435 -103 -19.1
#> 5 Fremont #14 647 559 -88 -13.6
#> 6 Fremont #6 390 342 -48 -12.3
#> 7 Fremont #25 2540 2309 -231 -9.1
#> 8 Fremont #24 341 387 46 13.59. Wyoming closed 42 schools in 25 years
From 382 schools in 2000 to 340 in 2024, Wyoming lost 11% of its school buildings. Average school size grew from 236 to 262 students, as fewer, larger schools replaced the small rural campuses.
school_counts <- enr |>
  filter(is_school, subgroup == "total_enrollment", grade_level == "TOTAL") |>
  group_by(end_year) |>
  summarize(n_schools = n(), total_students = sum(n_students, na.rm = TRUE)) |>
  mutate(avg_size = round(total_students / n_schools))

stopifnot(nrow(school_counts) > 0)
school_counts
#> # A tibble: 25 x 4
#> end_year n_schools total_students avg_size
#> <int> <int> <dbl> <dbl>
#> 1 2000 382 90065 236
#> 2 2001 378 87897 233
#> 3 2002 377 86116 228
#> 4 2003 367 84739 231
#> 5 2004 361 83772 232
#> 6 2005 362 83705 231
#> 7 2006 359 84611 236
#> 8 2007 354 85578 242
#> 9 2008 347 86519 249
#> 10 2009 349 87420 250
#> # ... 15 more rows
#> 25 2024 340 89228 262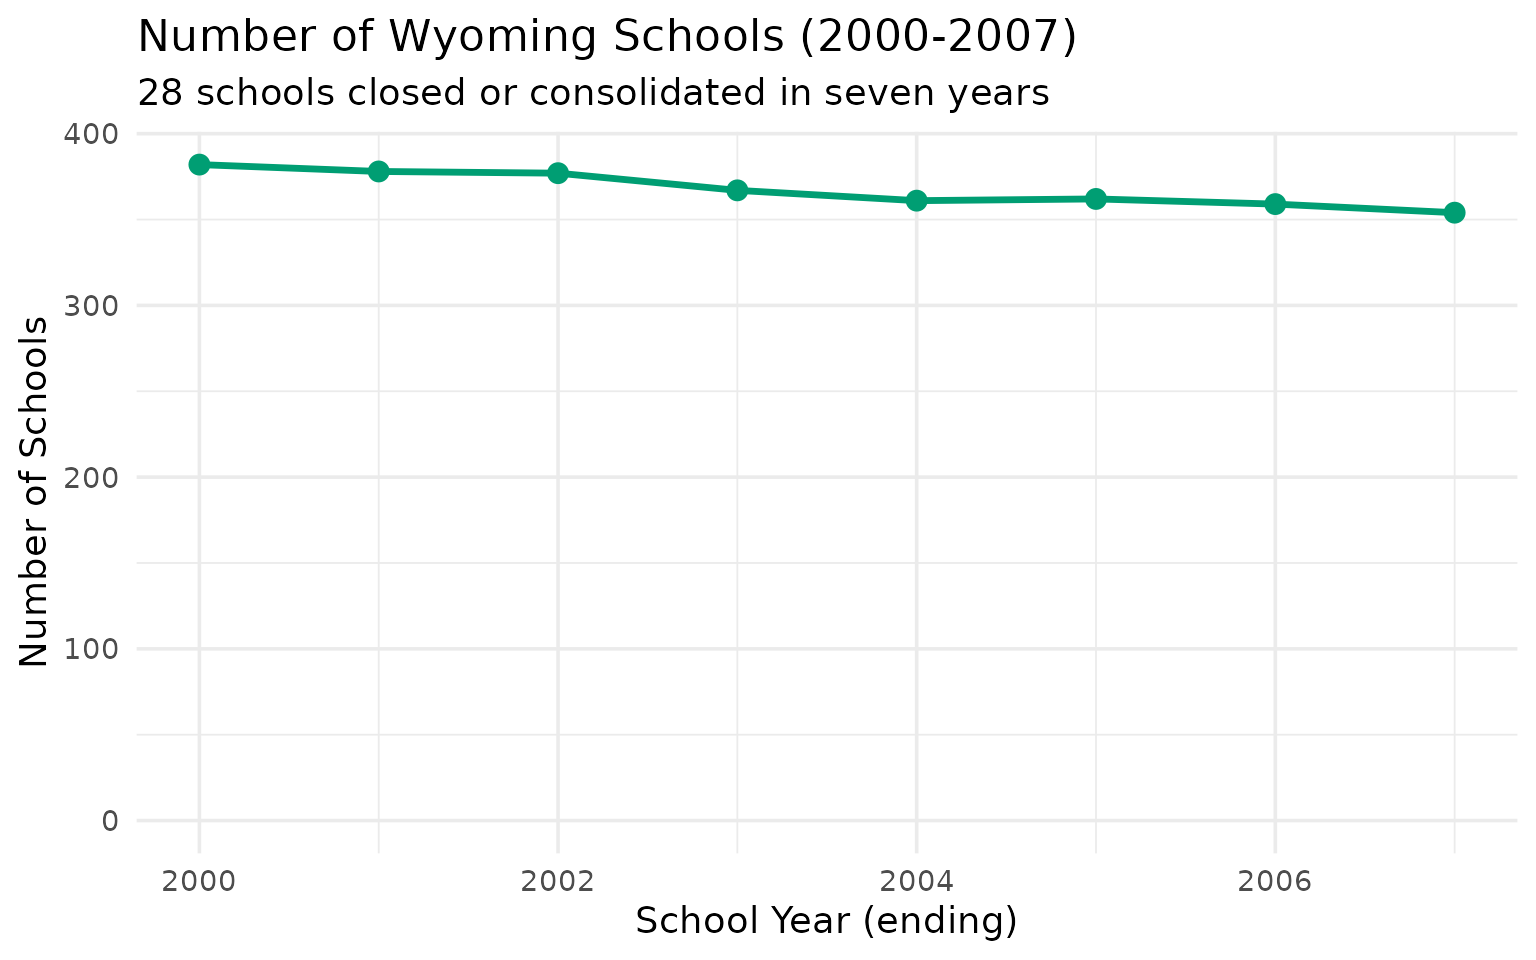
10. K vs 12: crossed, then crossed back – 25 years of demographic whiplash
In 2000, Wyoming had 6,851 12th graders but only 5,825 kindergartners. Kindergarten surged past 12th grade by 2004 and peaked at 8,131 in 2012. Then kindergarten fell while 12th grade rose – by 2024, 12th grade (6,898) led kindergarten (6,509) again.
k_vs_12 <- enr |>
  filter(is_state, subgroup == "total_enrollment", grade_level %in% c("K", "12")) |>
  select(end_year, grade_level, n_students) |>
  pivot_wider(names_from = grade_level, values_from = n_students)

stopifnot(nrow(k_vs_12) > 0)
k_vs_12
#> # A tibble: 25 x 3
#> end_year K `12`
#> <int> <dbl> <dbl>
#> 1 2000 5825 6851
#> 2 2001 6002 6832
#> 3 2002 6165 6582
#> 4 2003 6224 6451
#> 5 2004 6263 6272
#> 6 2005 6381 6042
#> 7 2006 6575 6146
#> 8 2007 6891 6212
#> 9 2008 7215 6093
#> 10 2009 7422 6141
#> # ... 15 more rows
#> 25 2024 6509 6898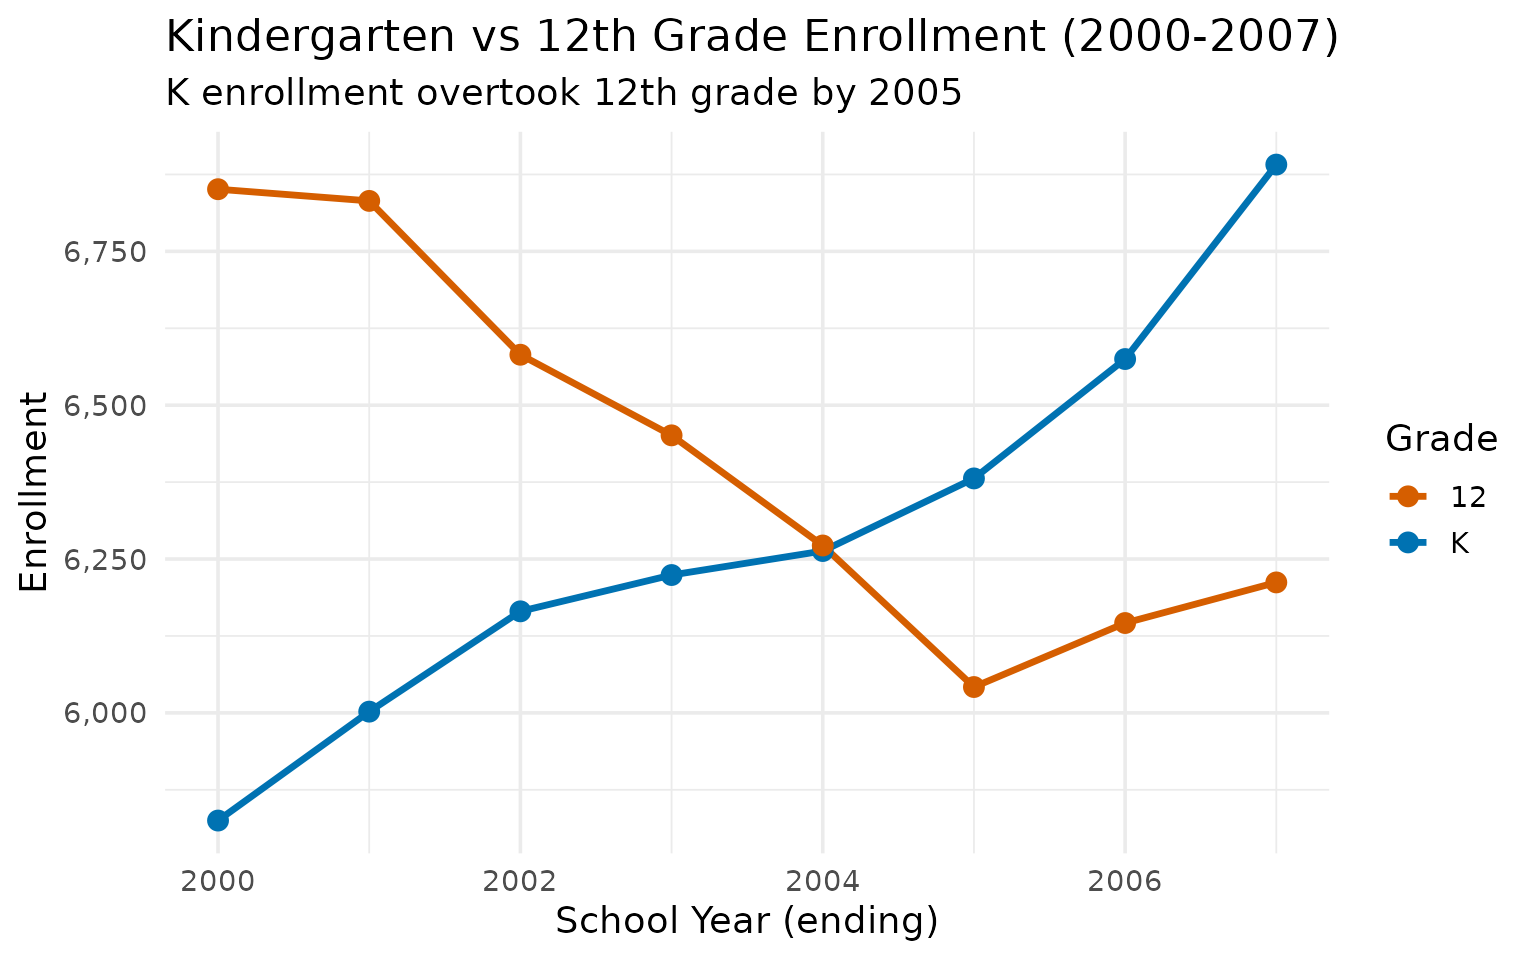
11. Sweetwater twin cities: Rock Springs held flat, Green River lost 22%
Rock Springs (Sweetwater #1) and Green River (Sweetwater #2) are 15 miles apart but diverged over 25 years. Rock Springs peaked at 5,749 in 2015 and returned to 4,789 by 2024 – nearly its 2000 level of 4,665. Green River steadily declined from 2,928 to 2,286.
sweetwater <- enr |>
  filter(is_district, subgroup == "total_enrollment", grade_level == "TOTAL",
         grepl("Sweetwater", district_name)) |>
  select(end_year, district_name, n_students)

stopifnot(nrow(sweetwater) > 0)
sweetwater |>
  filter(end_year %in% c(2000, 2007, 2015, 2024)) |>
  pivot_wider(names_from = end_year, values_from = n_students)
#> # A tibble: 2 x 5
#> district_name `2000` `2007` `2015` `2024`
#> <chr> <dbl> <dbl> <dbl> <dbl>
#> 1 Sweetwater #1 4665 4742 5749 4789
#> 2 Sweetwater #2 2928 2599 2710 2286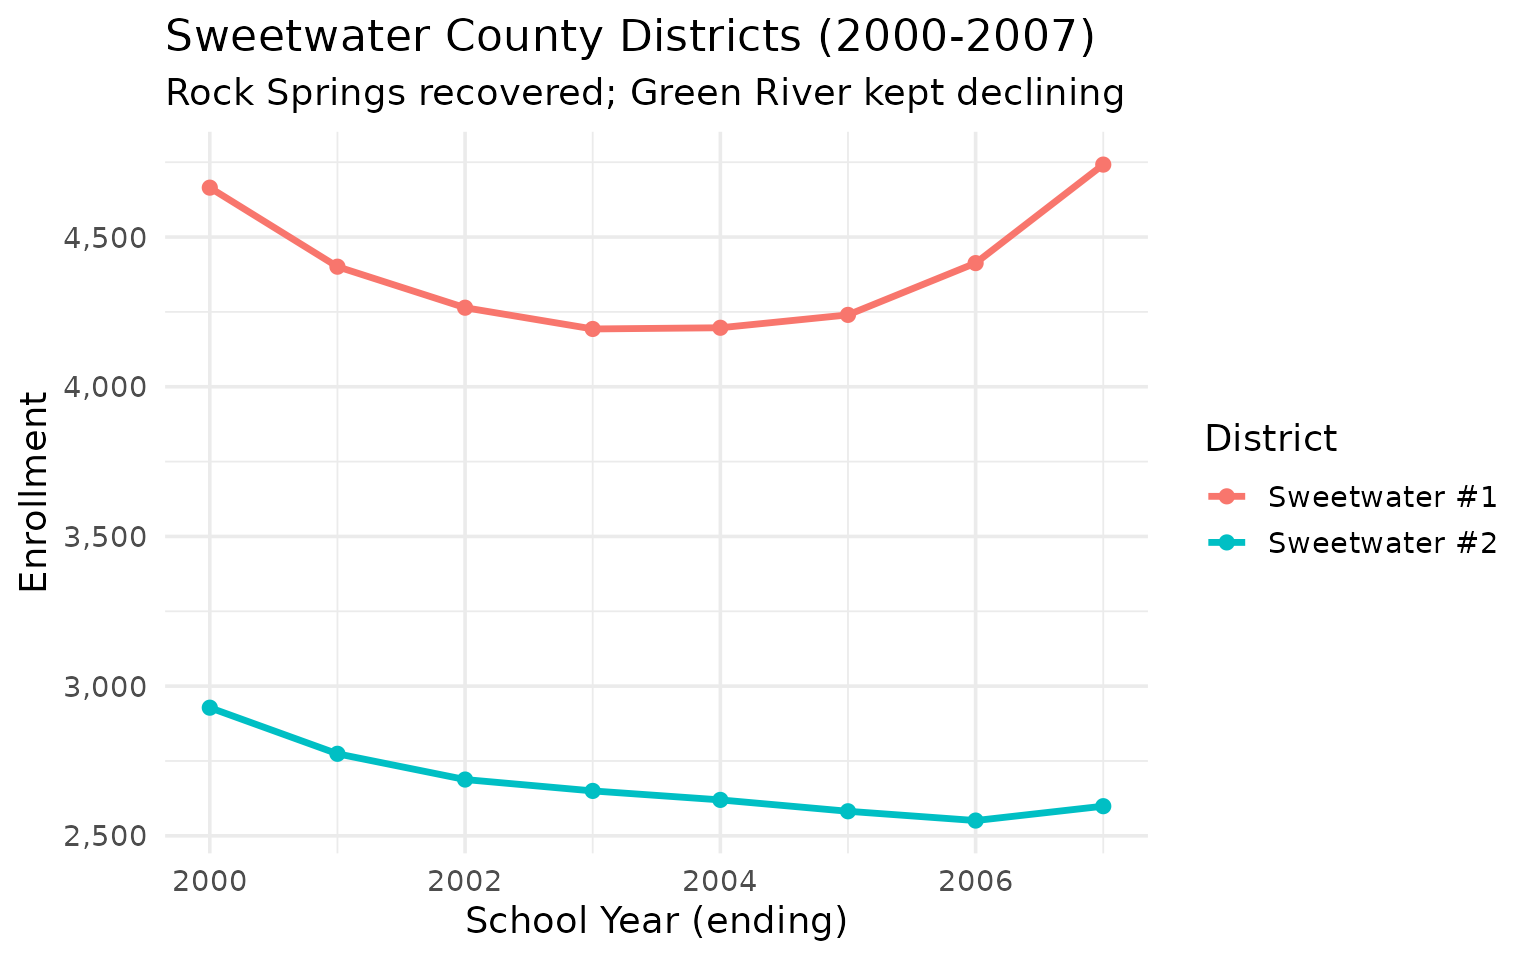
12. Teton County defied Wyoming’s decline: Jackson Hole grew 19%
While most Wyoming districts lost students, Teton #1 (Jackson) grew from 2,366 in 2000 to 2,827 in 2024 – a 19% increase. Jackson’s tourism and recreation economy attracted families even as energy-dependent communities shrank.
teton <- enr |>
  filter(is_district, district_name == "Teton #1",
         subgroup == "total_enrollment", grade_level == "TOTAL") |>
  select(end_year, n_students)

stopifnot(nrow(teton) > 0)
teton
#> end_year n_students
#> 1 2000 2366
#> 2 2001 2209
#> 3 2002 2248
#> 4 2003 2296
#> 5 2004 2270
#> 6 2005 2265
#> 7 2006 2219
#> 8 2007 2270
#> 9 2008 2294
#> 10 2009 2317
#> 11 2010 2456
#> 12 2011 2449
#> 13 2012 2487
#> 14 2013 2597
#> 15 2014 2691
#> 16 2015 2770
#> 17 2016 2835
#> 18 2017 2862
#> 19 2018 2881
#> 20 2019 2869
#> 21 2020 2749
#> 22 2021 2798
#> 23 2022 2797
#> 24 2023 2822
#> 25 2024 2827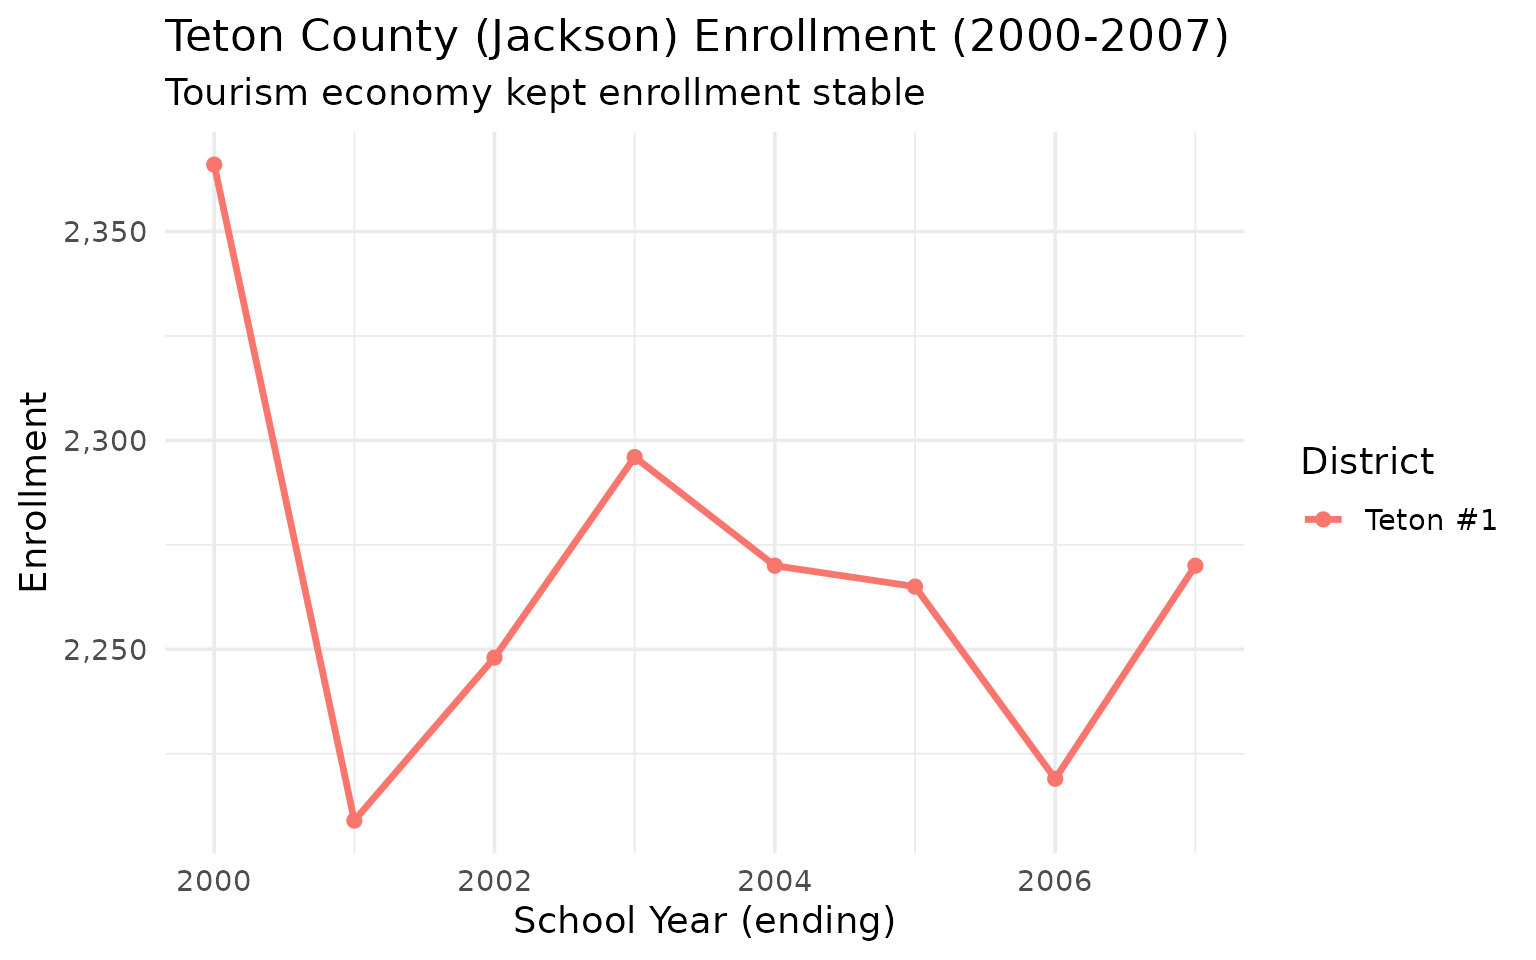
13. Elementary peaked in 2015 and fell back to 2000 levels
Elementary (K-5) enrollment surged from 38,545 in 2000 to a peak of 45,952 in 2015, then retreated to 39,635 by 2024 – almost exactly back to 2000. High school (9-12) followed a mirror path: declining from 30,172 to 25,970 by 2011, then recovering to 28,614 by 2024.
elem <- enr |>
  filter(is_state, subgroup == "total_enrollment",
         grade_level %in% c("K", "01", "02", "03", "04", "05")) |>
  group_by(end_year) |>
  summarize(students = sum(n_students)) |>
  mutate(level = "Elementary (K-5)")

hs <- enr |>
  filter(is_state, subgroup == "total_enrollment",
         grade_level %in% c("09", "10", "11", "12")) |>
  group_by(end_year) |>
  summarize(students = sum(n_students)) |>
  mutate(level = "High School (9-12)")

elem_hs <- bind_rows(elem, hs)

stopifnot(nrow(elem_hs) > 0)
elem_hs |>
  filter(end_year %in% c(2000, 2005, 2010, 2015, 2020, 2024)) |>
  pivot_wider(names_from = level, values_from = students)
#> # A tibble: 6 x 3
#> end_year `Elementary (K-5)` `High School (9-12)`
#> <int> <dbl> <dbl>
#> 1 2000 38545 30172
#> 2 2005 36934 27007
#> 3 2010 41992 26016
#> 4 2015 45952 26843
#> 5 2020 41300 28176
#> 6 2024 39635 28614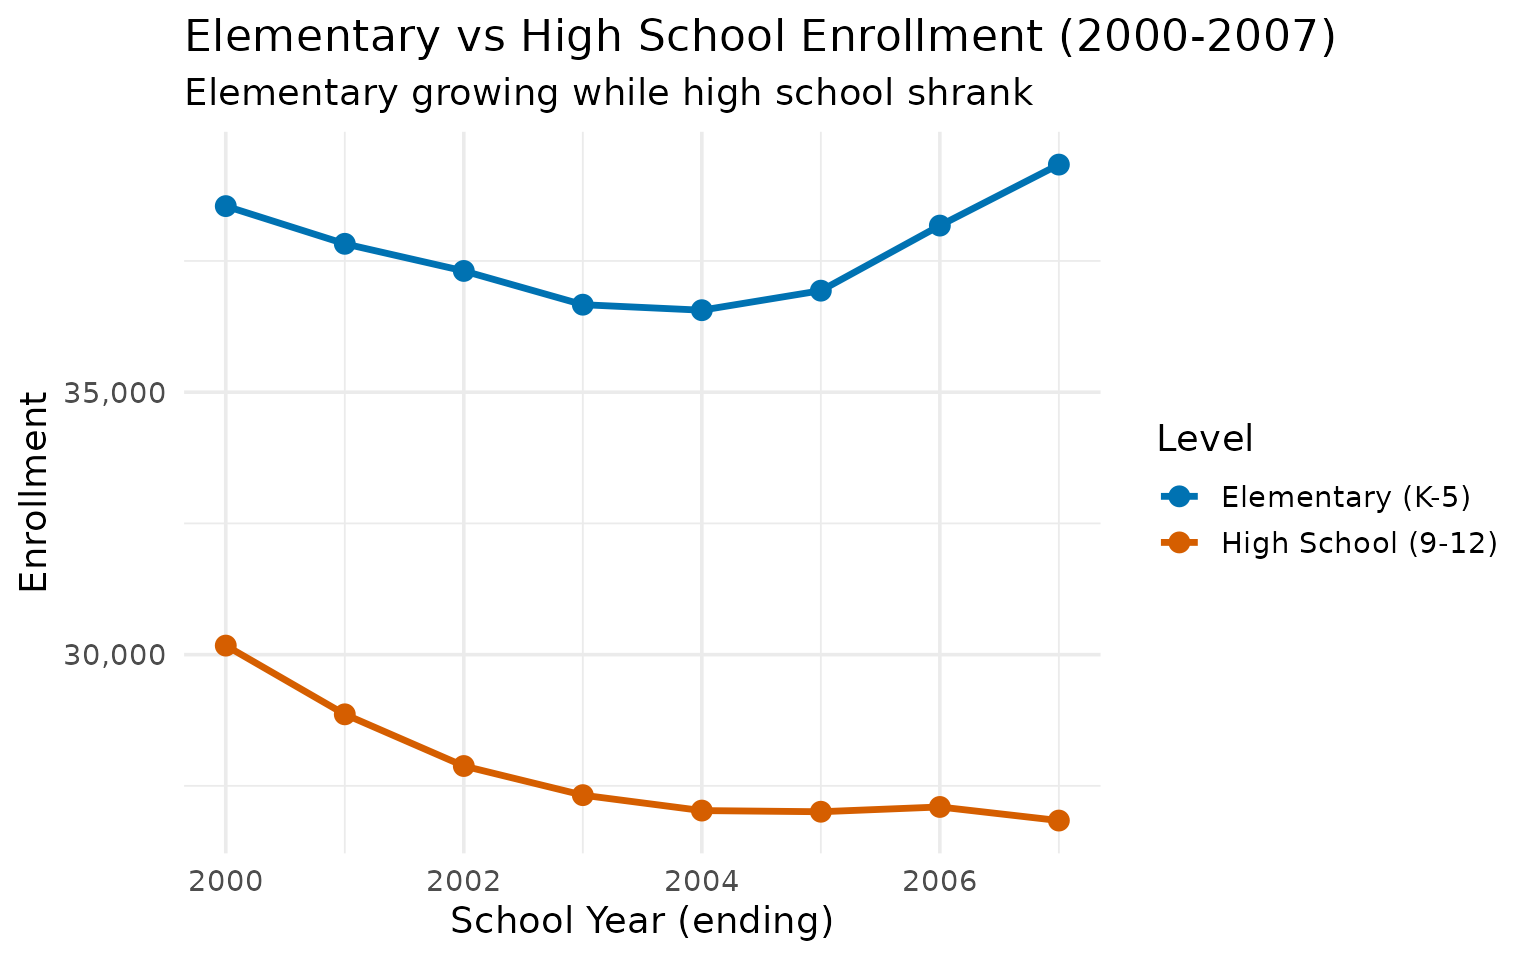
14. 2024 grade snapshot: 9th grade is still the biggest class
The 2024 grade-level distribution shows 9th grade as the largest class at 7,387 students, shrinking to 6,898 by 12th grade – a 7% decline that likely reflects both dropouts and outmigration.
grade_enr <- enr_2024 |>
  filter(is_state, subgroup == "total_enrollment",
         grade_level %in% c("K", "01", "02", "03", "04", "05",
                            "06", "07", "08", "09", "10", "11", "12")) |>
  select(grade_level, n_students) |>
  mutate(grade_level = factor(grade_level,
         levels = c("K", "01", "02", "03", "04", "05",
                    "06", "07", "08", "09", "10", "11", "12")))

stopifnot(nrow(grade_enr) > 0)
grade_enr
#> grade_level n_students
#> 1 K 6509
#> 2 01 6204
#> 3 02 6432
#> 4 03 6825
#> 5 04 6778
#> 6 05 6887
#> 7 06 7004
#> 8 07 6932
#> 9 08 7043
#> 10 09 7387
#> 11 10 7311
#> 12 11 7018
#> 13 12 6898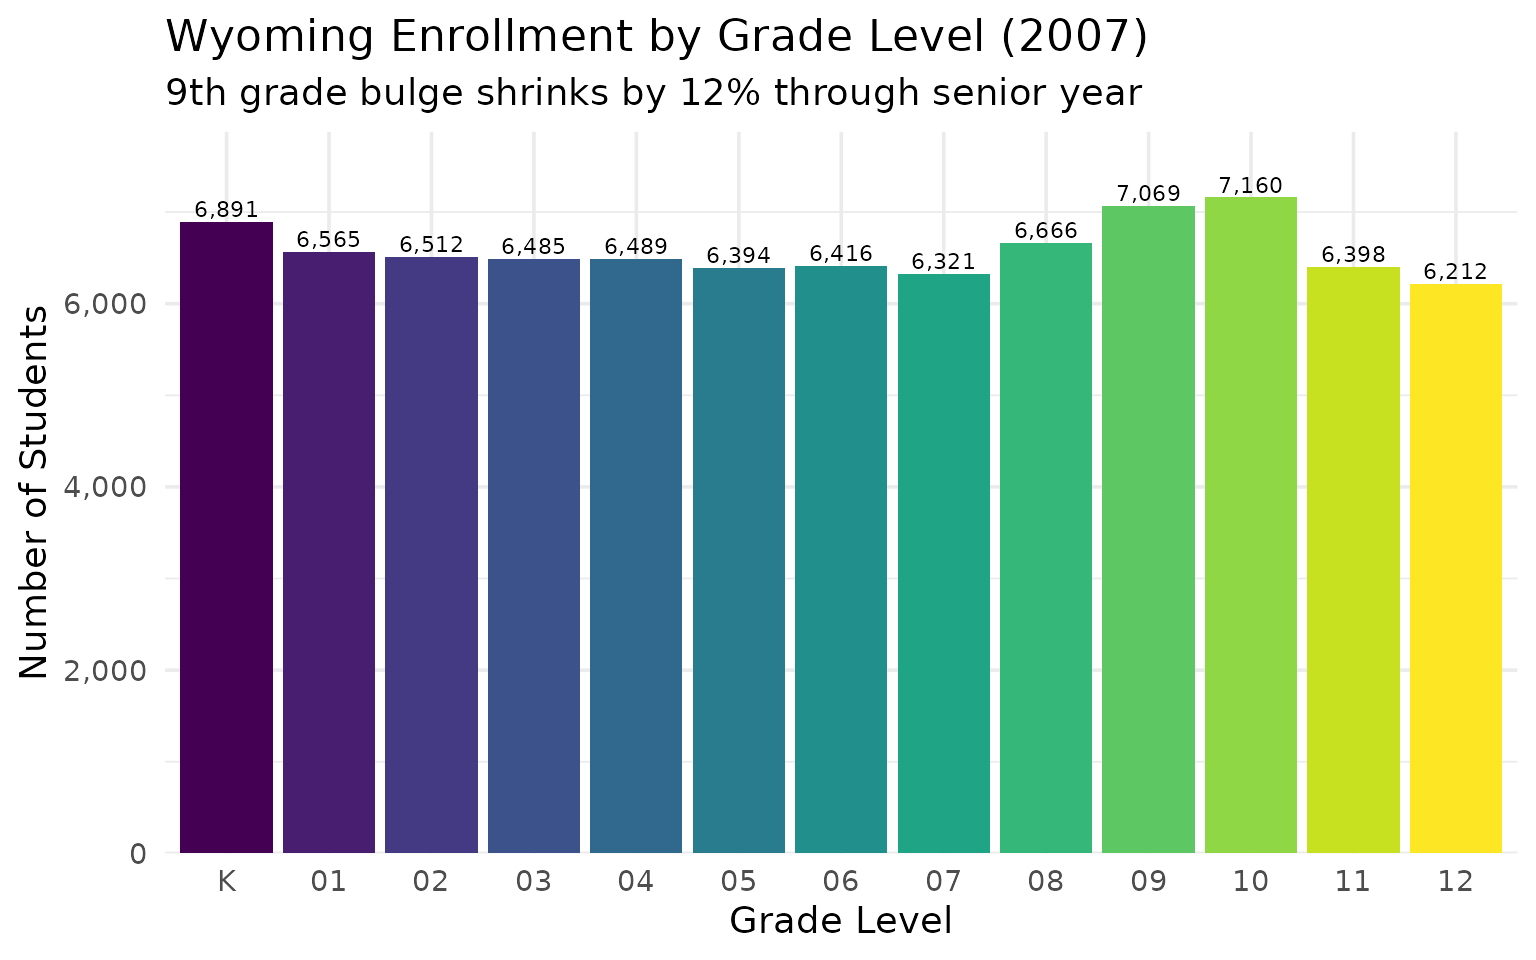
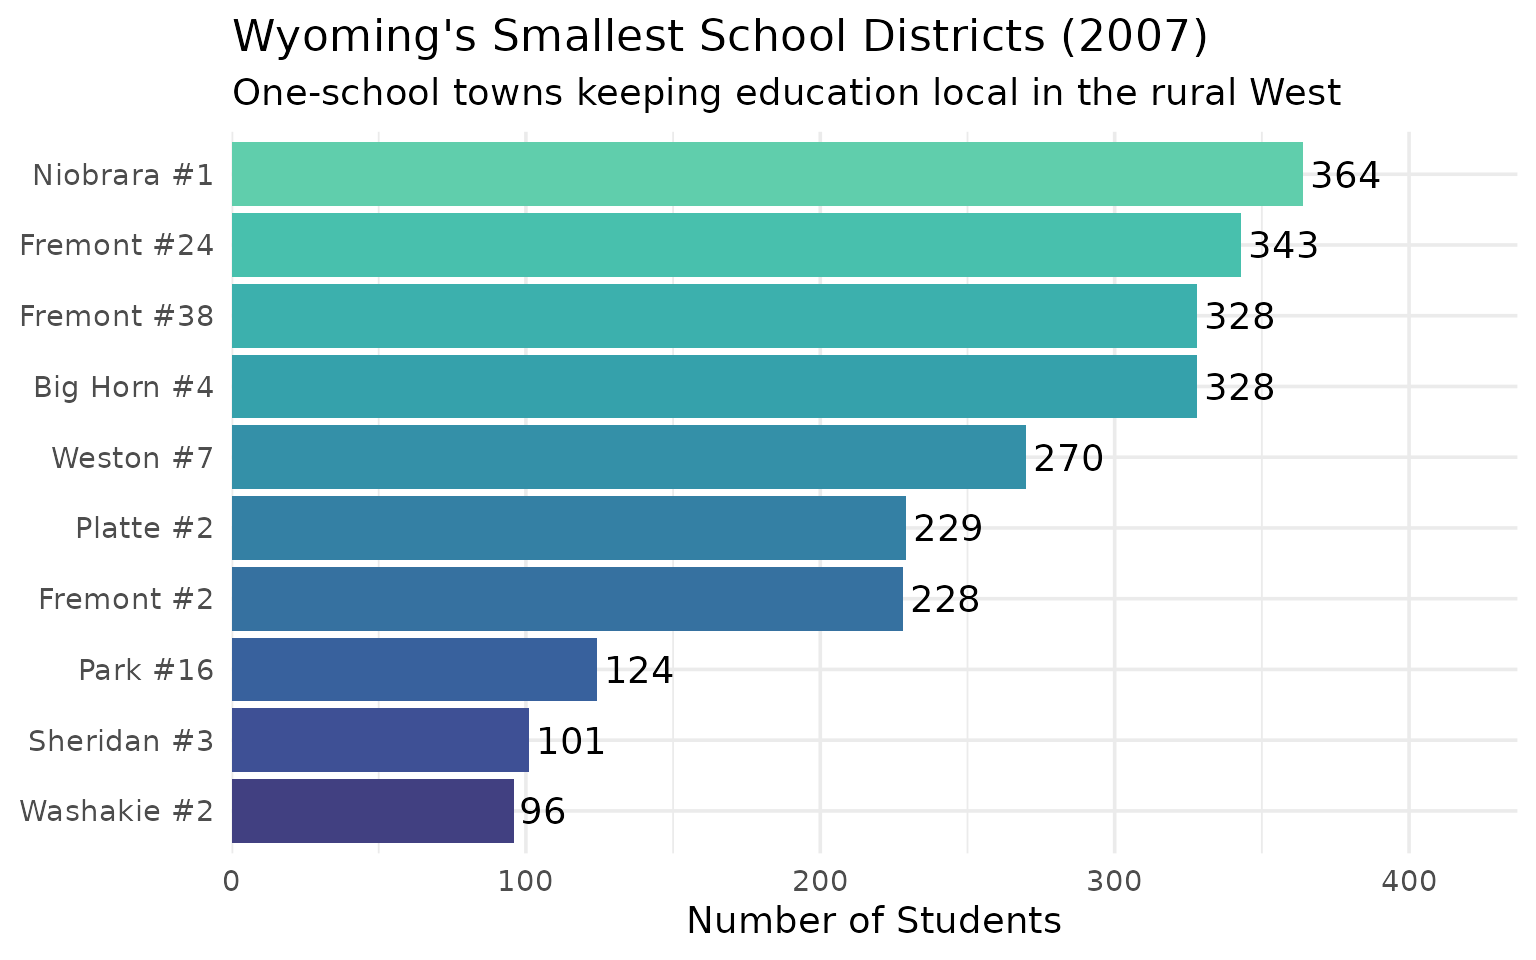
15. Charter schools joined Wyoming’s tiny-district club
In 2024, three of Wyoming’s ten smallest districts are charter schools that didn’t exist two years earlier. Sheridan #3 (86 students) remains the smallest traditional district, but Prairie View Community School (90) and Cheyenne Classical Academy (150) are the new neighbors.
smallest <- enr_2024 |>
  filter(is_district, subgroup == "total_enrollment", grade_level == "TOTAL") |>
  arrange(n_students) |>
  head(10) |>
  select(district_name, n_students)

stopifnot(nrow(smallest) > 0)
smallest
#> district_name n_students
#> 1 Sheridan #3 86
#> 2 Prairie View Community School 90
#> 3 Park #16 98
#> 4 Washakie #2 104
#> 5 Cheyenne Classical Academy 150
#> 6 Fremont #2 182
#> 7 Platte #2 190
#> 8 Big Horn #4 235
#> 9 Wyoming Classical Academy 298
#> 10 Fremont #6 342