Arizona’s charter sector serves nearly 1 in 4 students, its schools have 40% more seniors than kindergartners, and enrollment declined despite a population boom. Explore 1.1 million students across 630 districts with azschooldata.
Part of the njschooldata family.
Full documentation — all 15 stories with charts, getting-started guide, and complete function reference.
Vignettes: - Enrollment trends — 15 stories covering trends, demographics, and district comparisons
Highlights
library(azschooldata)
library(dplyr)
library(tidyr)
library(ggplot2)

theme_set(theme_minimal(base_size = 14))

enr <- fetch_enr_multi(c(2018, 2019, 2024, 2025), use_cache = TRUE)
1. Charters serve nearly 1 in 4 Arizona students
Charter schools and other non-traditional districts now serve 25% of Arizona’s students (270,000 students across 437 districts). Traditional districts (unified, union, elementary) serve the remaining 75%.
charter_data <- enr |>
  filter(is_district,
         subgroup == "total_enrollment", grade_level == "TOTAL",
         end_year == 2025) |>
  mutate(district_type = case_when(
    grepl("Unified|Union|Elementary District|High School District", district_name) ~ "Traditional",
    TRUE ~ "Charter/Other"
  )) |>
  group_by(district_type) |>
  summarize(
    n_districts = n(),
    total_students = sum(n_students, na.rm = TRUE),
    avg_size = round(mean(n_students), 0),
    .groups = "drop"
  ) |>
  mutate(pct = round(total_students / sum(total_students) * 100, 1))
stopifnot(nrow(charter_data) > 0)

charter_data
#> # A tibble: 2 x 5
#>   district_type n_districts total_students avg_size   pct
#>   <chr>               <int>          <dbl>    <dbl> <dbl>
#> 1 Charter/Other         437         270122      618  24.6
#> 2 Traditional           193         829407     4297  75.4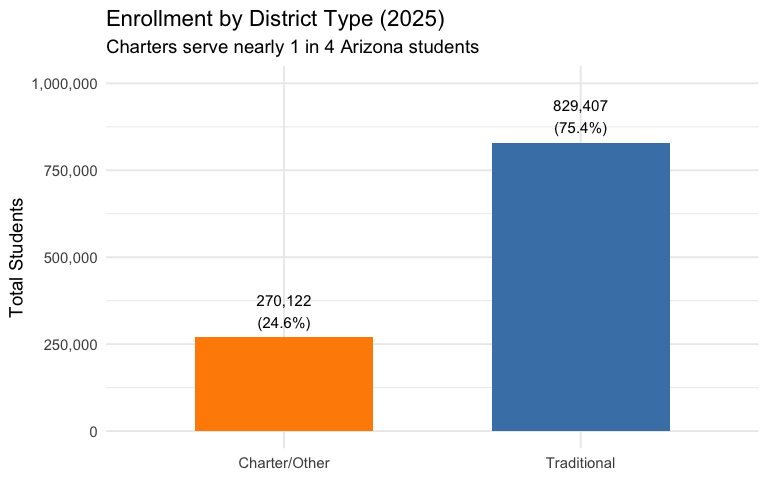
2. Arizona has 40% more seniors than kindergartners
There are 98,216 12th graders but only 70,164 kindergartners - a 40% difference. This “inverted pyramid” could signal declining birth rates or families with young children leaving public schools.
grade_order <- c("PK", "K", "01", "02", "03", "04", "05",
                 "06", "07", "08", "09", "10", "11", "12")

grades <- enr |>
  filter(is_district,
         subgroup == "total_enrollment", grade_level %in% grade_order,
         end_year == 2025) |>
  group_by(grade_level) |>
  summarize(n_students = sum(n_students, na.rm = TRUE), .groups = "drop") |>
  mutate(grade_level = factor(grade_level, levels = grade_order))
stopifnot(nrow(grades) > 0)

grades |>
  arrange(grade_level)
#> # A tibble: 14 x 2
#>    grade_level n_students
#>    <fct>            <dbl>
#>  1 PK               19815
#>  2 K                70164
#>  3 01               73928
#>  4 02               77811
#>  5 03               81507
#>  6 04               79398
#>  7 05               82241
#>  8 06               82458
#>  9 07               82350
#> 10 08               83408
#> 11 09               85720
#> 12 10               88332
#> 13 11               89504
#> 14 12               98216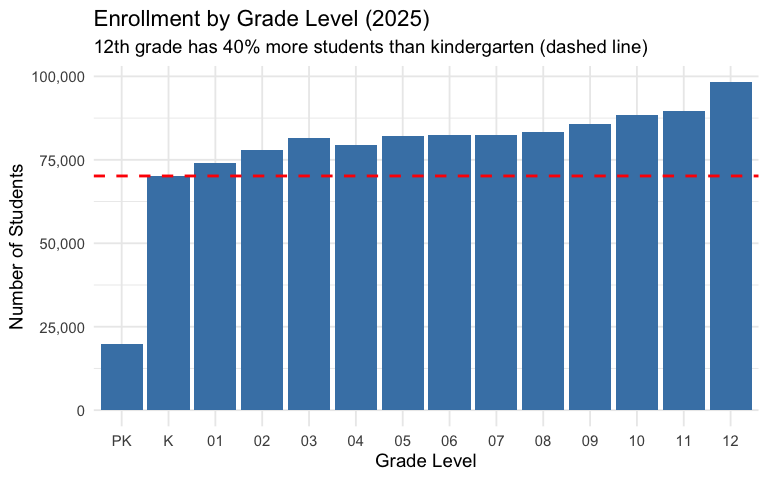
3. Arizona enrollment fell despite population boom
While Arizona’s population grew significantly from 2018-2025, public school enrollment actually declined - from 1.11 million to 1.10 million students. Enrollment peaked in 2019 (1.14M) then fell 3.7% by 2025.
state_enr <- enr |>
  filter(is_state,
         subgroup == "total_enrollment", grade_level == "TOTAL") |>
  select(end_year, n_students) |>
  mutate(change = n_students - lag(n_students),
         pct_change = round(change / lag(n_students) * 100, 1))
stopifnot(nrow(state_enr) > 0)
state_enr
#> # A tibble: 4 x 4
#>   end_year n_students change pct_change
#>      <dbl>      <dbl>  <dbl>      <dbl>
#> 1     2018    1112682     NA       NA
#> 2     2019    1141209  28527        2.6
#> 3     2024    1115111 -26098       -2.3
#> 4     2025    1099529 -15582       -1.4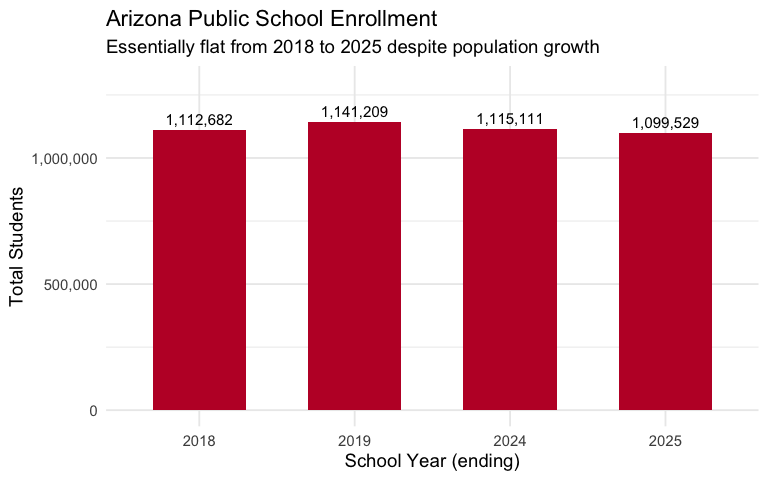
Data Taxonomy
| Category | Years | Function | Details |
|---|---|---|---|
| Enrollment | 2018-2026 |
fetch_enr() / fetch_enr_multi()
|
State, district, school. Race, gender, FRPL, SpEd, LEP |
| Assessments | — | — | Not yet available |
| Graduation | — | — | Not yet available |
| Directory | current | fetch_directory() |
Names, IDs, addresses, coordinates, locale |
| Per-Pupil Spending | — | — | Not yet available |
| Accountability | — | — | Not yet available |
| Chronic Absence | — | — | Not yet available |
| EL Progress | — | — | Not yet available |
| Special Ed | — | — | Not yet available |
See the full data category taxonomy for what each category covers.
Quick Start
R
# install.packages("remotes")
remotes::install_github("almartin82/azschooldata")
library(azschooldata)
library(dplyr)

# Fetch one year
enr_2025 <- fetch_enr(2025)

# Fetch multiple years
enr_multi <- fetch_enr_multi(c(2018, 2019, 2024, 2025))

# State totals
enr_2025 |>
  filter(is_state, subgroup == "total_enrollment", grade_level == "TOTAL")

# District breakdown
enr_2025 |>
  filter(is_district, subgroup == "total_enrollment", grade_level == "TOTAL") |>
  arrange(desc(n_students))

# Demographics
enr_2025 |>
  filter(is_state, grade_level == "TOTAL",
         subgroup %in% c("hispanic", "white", "black", "asian", "native_american")) |>
  select(subgroup, n_students, pct)
Python
import pyazschooldata as az

# Fetch one year
enr_2025 = az.fetch_enr(2025)

# Fetch multiple years
enr_multi = az.fetch_enr_multi([2018, 2019, 2024, 2025])

# State totals
state_total = enr_2025[
    (enr_2025['is_state'] == True) &
    (enr_2025['subgroup'] == 'total_enrollment') &
    (enr_2025['grade_level'] == 'TOTAL')
]

# District breakdown
districts = enr_2025[
    (enr_2025['is_district'] == True) &
    (enr_2025['subgroup'] == 'total_enrollment') &
    (enr_2025['grade_level'] == 'TOTAL')
].sort_values('n_students', ascending=False)

# Demographics
demographics = enr_2025[
    (enr_2025['is_state'] == True) &
    (enr_2025['grade_level'] == 'TOTAL') &
    (enr_2025['subgroup'].isin(['hispanic', 'white', 'black', 'asian', 'native_american']))
][['subgroup', 'n_students', 'pct']]
Explore More
Full analysis with 15 stories: - Enrollment trends — 15 stories - Function reference
Data Notes
Source: Arizona Department of Education October 1 Enrollment Reports
URL: https://www.azed.gov/accountability-research
Available years: 2018, 2019, 2024, 2025, 2026
Missing years: 2020-2023 (Cloudflare protection blocks automated downloads)
Census Day: October 1 of each school year
Important caveats: - Small counts may be suppressed in the source data (marked with *) - Virtual and charter schools are counted separately from traditional districts
What’s included: - State, district, and school level enrollment - Demographics: Hispanic, White, Black, Asian, Native American, Pacific Islander, Multiracial - Gender: Male, Female - Special populations: ELL, Special Ed, Economically Disadvantaged - Grade levels: PK through 12
Deeper Dive
4. Hispanic students now 49% of Arizona schools
Hispanic students grew from 45.7% in 2018 to 48.8% in 2025, while White students declined from 38.0% to 32.9%. Arizona’s schools are becoming increasingly diverse.
demographics <- enr |>
  filter(is_state, grade_level == "TOTAL",
         subgroup %in% c("hispanic", "white", "black", "asian",
                         "native_american", "multiracial", "total_enrollment")) |>
  group_by(end_year) |>
  mutate(pct = round(n_students / n_students[subgroup == "total_enrollment"] * 100, 1)) |>
  filter(subgroup != "total_enrollment")
stopifnot(nrow(demographics) > 0)

demographics |>
  select(end_year, subgroup, n_students, pct) |>
  arrange(end_year, desc(n_students))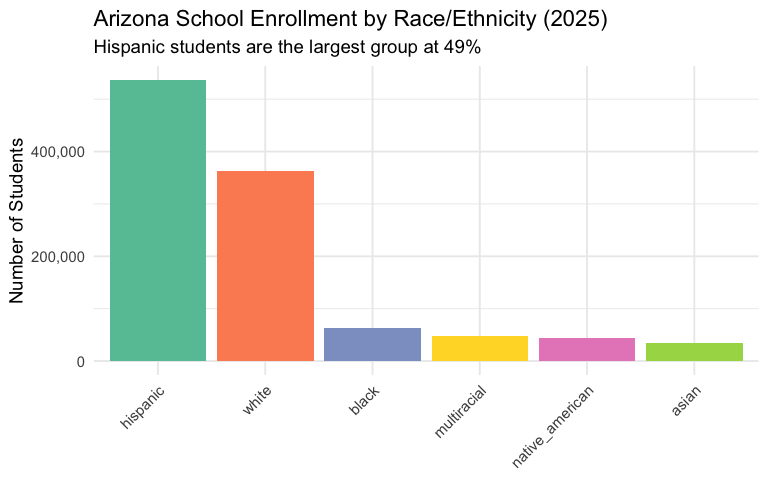
5. Queen Creek doubled in size while Mesa lost 7,100 students
Queen Creek Unified grew 112% (from 7,095 to 15,034 students) as new subdivisions opened in the southeast Valley. Meanwhile, Mesa Unified - the state’s largest district - lost 7,156 students (-11.4%).
growth <- enr |>
  filter(is_district,
         subgroup == "total_enrollment", grade_level == "TOTAL") |>
  group_by(end_year, district_name) |>
  summarize(n_students = sum(n_students, na.rm = TRUE), .groups = "drop") |>
  pivot_wider(names_from = end_year, values_from = n_students,
              names_prefix = "y") |>
  filter(!is.na(y2018), !is.na(y2025), y2018 >= 1000) |>
  mutate(change = y2025 - y2018,
         pct_change = round((y2025 / y2018 - 1) * 100, 1)) |>
  arrange(desc(change))
stopifnot(nrow(growth) > 0)

growth |>
  select(district_name, y2018, y2025, change, pct_change) |>
  head(10)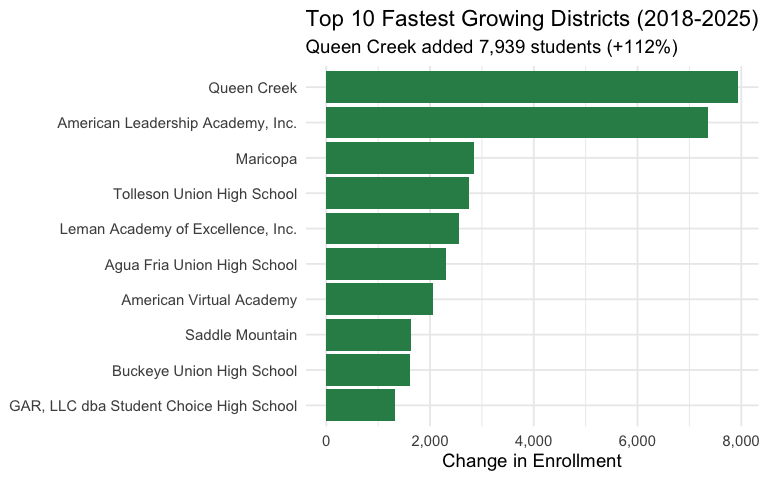
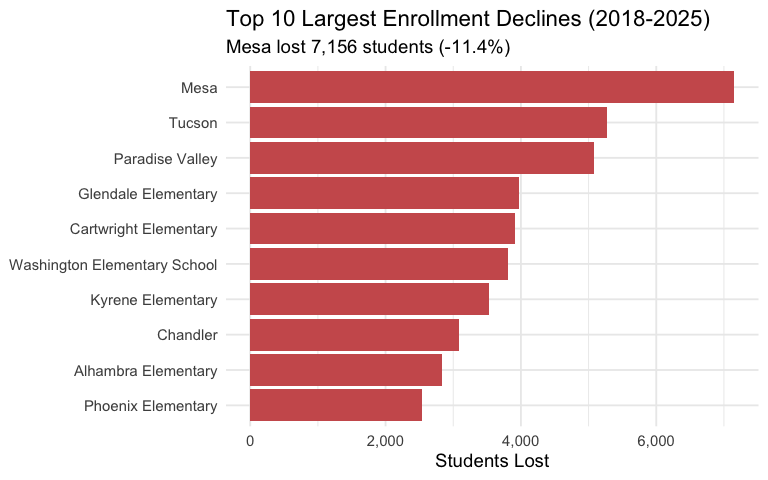
6. Mesa, Tucson, and Paradise Valley lead enrollment losses
The three largest enrollment declines in Arizona are all in established urban districts: Mesa (-7,156), Tucson (-5,265), and Paradise Valley (-5,081). These districts face competition from charters and demographic shifts.
7. Top 27 districts educate half of Arizona’s students
Student enrollment is heavily concentrated: just 27 of Arizona’s 630 districts educate 50% of all students. The top 10 districts alone serve 30% of students.
concentration <- enr |>
  filter(is_district,
         subgroup == "total_enrollment", grade_level == "TOTAL",
         end_year == 2025) |>
  arrange(desc(n_students)) |>
  mutate(
    cum_students = cumsum(n_students),
    cum_pct = round(cum_students / sum(n_students) * 100, 1),
    rank = row_number()
  )
stopifnot(nrow(concentration) > 0)

total_students <- sum(concentration$n_students)
n_districts <- nrow(concentration)

concentration |>
  select(rank, district_name, n_students, cum_pct) |>
  head(15)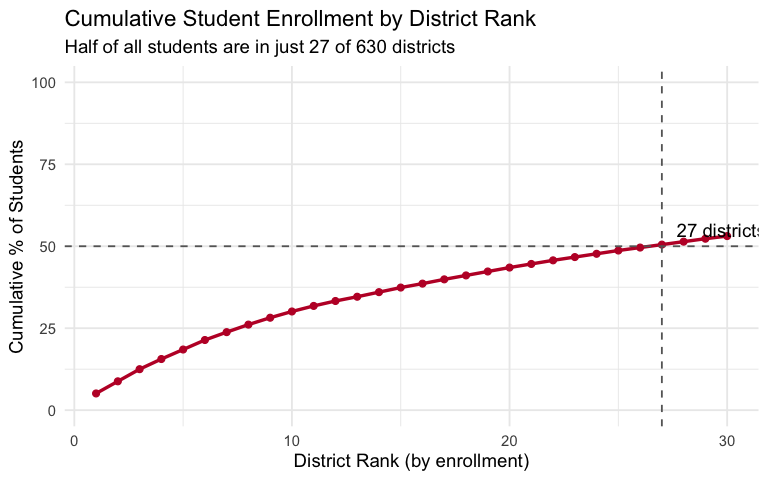
8. Chinle is 99% Native American
Arizona has several districts with almost entirely Native American enrollment, reflecting the state’s 22 federally recognized tribes. Chinle Unified is 99.1% Native American, followed by San Carlos (98.8%) and Window Rock (98.2%).
native_am <- enr |>
  filter(is_district, grade_level == "TOTAL",
         subgroup %in% c("native_american", "total_enrollment"),
         end_year == 2025) |>
  group_by(district_name, subgroup) |>
  summarize(n_students = sum(n_students, na.rm = TRUE), .groups = "drop") |>
  pivot_wider(names_from = subgroup, values_from = n_students) |>
  filter(!is.na(native_american), total_enrollment >= 100) |>
  mutate(pct_native = round(native_american / total_enrollment * 100, 1)) |>
  arrange(desc(pct_native))
stopifnot(nrow(native_am) > 0)

native_am |>
  select(district_name, total_enrollment, native_american, pct_native) |>
  head(10)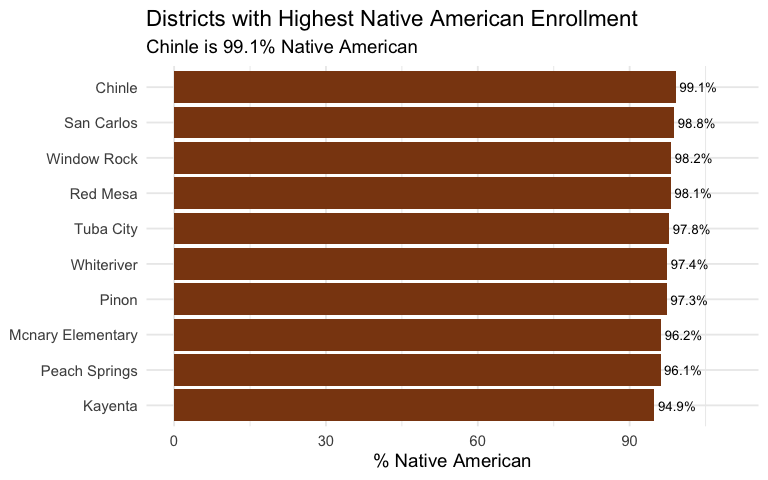
9. Border districts are over 95% Hispanic
Arizona’s border districts have near-complete Hispanic enrollment. Nogales Unified (99.3%), Gadsden Elementary (99.2%), and Douglas Unified (97.8%) serve predominantly Hispanic communities near the Mexico border.
hispanic_maj <- enr |>
  filter(is_district, grade_level == "TOTAL",
         subgroup %in% c("hispanic", "total_enrollment"),
         end_year == 2025) |>
  group_by(district_name, subgroup) |>
  summarize(n_students = sum(n_students, na.rm = TRUE), .groups = "drop") |>
  pivot_wider(names_from = subgroup, values_from = n_students) |>
  filter(!is.na(hispanic), total_enrollment >= 500) |>
  mutate(pct_hispanic = round(hispanic / total_enrollment * 100, 1)) |>
  arrange(desc(pct_hispanic))
stopifnot(nrow(hispanic_maj) > 0)

hispanic_maj |>
  select(district_name, total_enrollment, hispanic, pct_hispanic) |>
  head(10)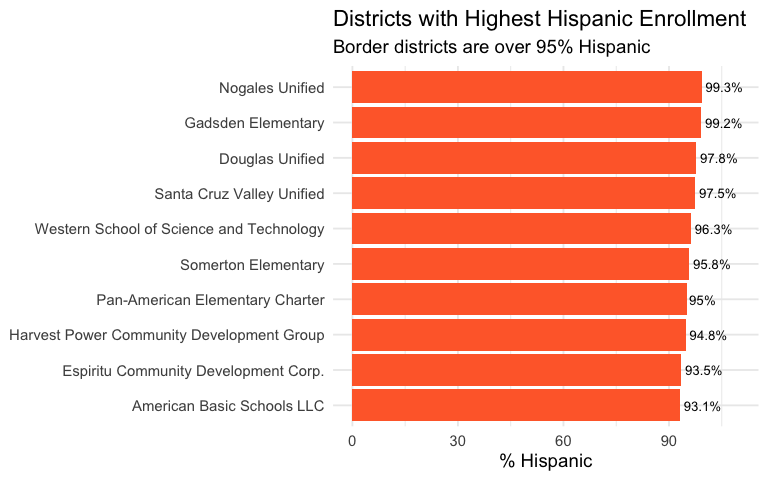
10. Mesa Unified is still Arizona’s largest district
Despite losing 7,156 students, Mesa Unified remains Arizona’s largest district with 55,600 students. Chandler (41,349), Tucson (40,209), and Peoria (34,373) round out the top four.
largest <- enr |>
  filter(is_district,
         subgroup == "total_enrollment", grade_level == "TOTAL",
         end_year == 2025) |>
  select(district_name, n_students) |>
  arrange(desc(n_students))
stopifnot(nrow(largest) > 0)
largest |> head(15)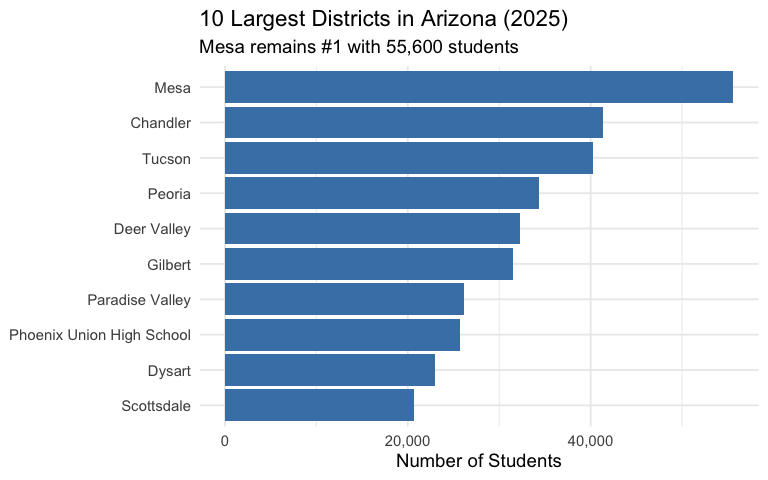
11. Arizona has 630 districts serving 1.1 million students
Arizona’s school system includes 630 separate districts - from Mesa’s 55,600 students down to tiny rural districts with just 11 students. The average district has 1,745 students, but the median is just 414.
district_stats <- enr |>
  filter(is_district,
         subgroup == "total_enrollment", grade_level == "TOTAL",
         end_year == 2025) |>
  summarize(
    n_districts = n(),
    total_students = sum(n_students),
    mean_size = round(mean(n_students), 0),
    median_size = median(n_students),
    min_size = min(n_students),
    max_size = max(n_students)
  )
stopifnot(nrow(district_stats) > 0)

district_stats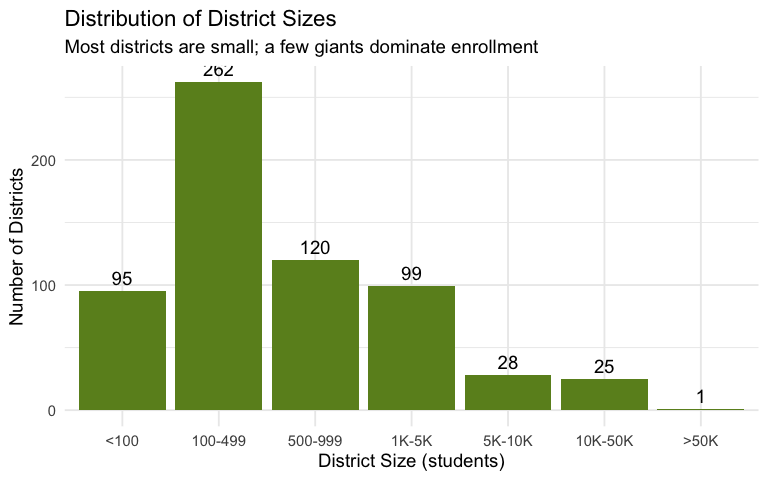
12. Boys outnumber girls 51% to 49%
Male students slightly outnumber female students in Arizona schools: 559,758 boys (50.9%) vs 539,574 girls (49.1%). This 2-point gap is consistent with national patterns.
gender <- enr |>
  filter(is_district, grade_level == "TOTAL",
         subgroup %in% c("male", "female"),
         end_year == 2025) |>
  group_by(subgroup) |>
  summarize(n_students = sum(n_students, na.rm = TRUE), .groups = "drop") |>
  mutate(pct = round(n_students / sum(n_students) * 100, 1))
stopifnot(nrow(gender) > 0)

gender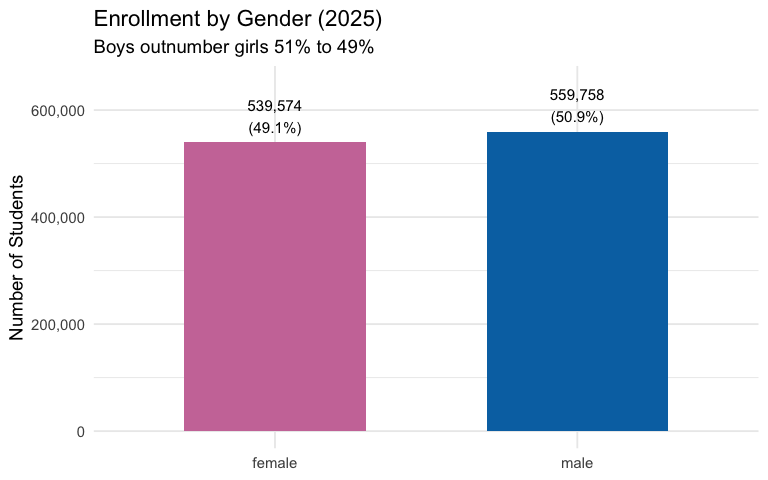
13. Virtual schools serve 6,000+ students
American Virtual Academy is Arizona’s largest virtual school with 6,289 students in 2025. This represents 49% growth from 4,227 students in 2018, reflecting the post-pandemic persistence of online learning.
virtual_schools <- enr |>
  filter(is_district, subgroup == "total_enrollment", grade_level == "TOTAL",
         grepl("Virtual|Online|Digital", district_name, ignore.case = TRUE)) |>
  select(end_year, district_name, n_students) |>
  arrange(end_year, desc(n_students))
stopifnot(nrow(virtual_schools) > 0)
virtual_schools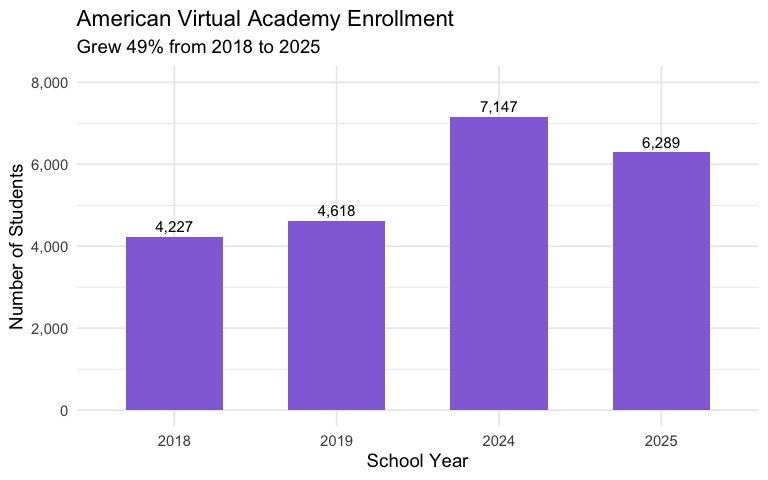
14. Elementary grades are shrinking faster than high school
Elementary enrollment (K-5) totals 465,049 students while high school (9-12) has 361,772. But when you look at individual grades, high school grades average 90,443 students while elementary grades average only 77,508 - a 17% difference suggesting demographic shift.
grade_groups <- enr |>
  filter(is_district,
         subgroup == "total_enrollment", grade_level %in% grade_order,
         end_year == 2025) |>
  group_by(grade_level) |>
  summarize(n_students = sum(n_students, na.rm = TRUE), .groups = "drop") |>
  mutate(level = case_when(
    grade_level %in% c("K", "01", "02", "03", "04", "05") ~ "Elementary (K-5)",
    grade_level %in% c("06", "07", "08") ~ "Middle (6-8)",
    grade_level %in% c("09", "10", "11", "12") ~ "High School (9-12)",
    TRUE ~ "Other"
  )) |>
  group_by(level) |>
  summarize(
    total_students = sum(n_students),
    n_grades = n(),
    avg_per_grade = round(sum(n_students) / n()),
    .groups = "drop"
  )
stopifnot(nrow(grade_groups) > 0)

grade_groups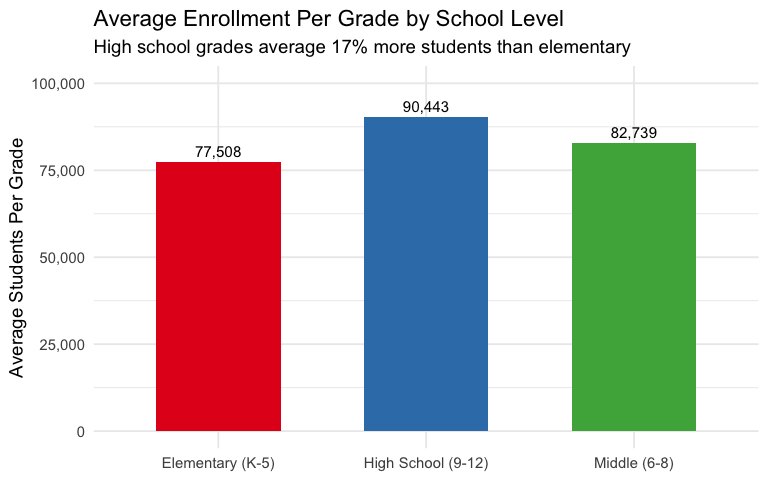
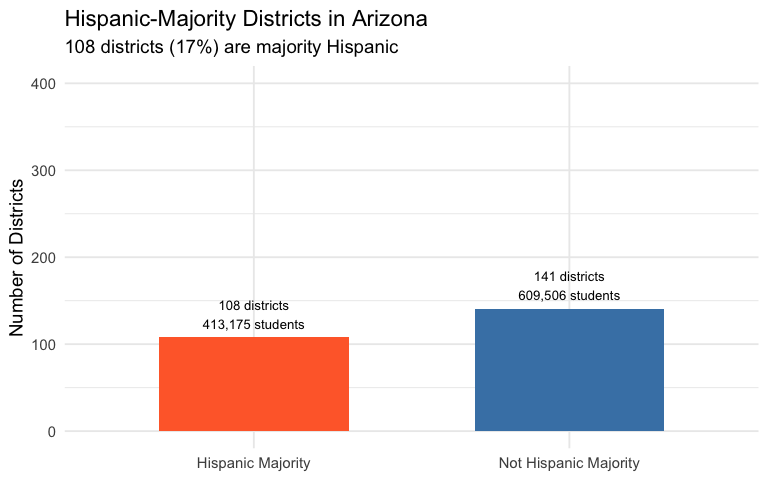
15. 108 districts are Hispanic-majority
Of Arizona’s 630 districts, 108 have majority Hispanic enrollment (at least 500 students and >50% Hispanic). These districts serve 413,175 students total - about 38% of all students statewide.
hispanic_count <- hispanic_maj |>
  filter(pct_hispanic >= 50) |>
  summarize(
    n_districts = n(),
    total_students = sum(total_enrollment),
    pct_of_state = round(sum(total_enrollment) / sum(concentration$n_students) * 100, 1)
  )
stopifnot(nrow(hispanic_count) > 0)

hispanic_count