Fetch and analyze canonical Connecticut district/state enrollment data with a stable-core demographic contract across 2011-2026.
Part of the njschooldata family — a simple, consistent interface for accessing state-published school data in Python and R.
Full documentation — all 15 stories with interactive charts, getting-started guide, and complete function reference.
Highlights
1. Hispanic enrollment crossed 30% statewide in 2023
Hispanic students grew from 26.9% of Connecticut’s public school enrollment in 2020 to 30.2% in 2023 – an increase of 12,249 students even as overall enrollment shrank. This is a significant demographic milestone: nearly one in three Connecticut public school students is now Hispanic.
library(ctschooldata)
library(dplyr)
library(ggplot2)

enr <- fetch_enr_multi(2020:2023, use_cache = TRUE)

hispanic_trend <- enr %>%
  filter(is_state, subgroup == "hispanic",
         grade_level == "TOTAL") %>%
  select(end_year, n_students, pct) %>%
  arrange(end_year) %>%
  mutate(pct_display = round(pct * 100, 1))

print(hispanic_trend)
#> # A tibble: 4 x 4
#>   end_year n_students   pct pct_display
#>      <int>      <dbl> <dbl>       <dbl>
#> 1     2020     136948 0.269        26.9
#> 2     2021     138910 0.280        28.0
#> 3     2022     144253 0.291        29.1
#> 4     2023     149197 0.302        30.2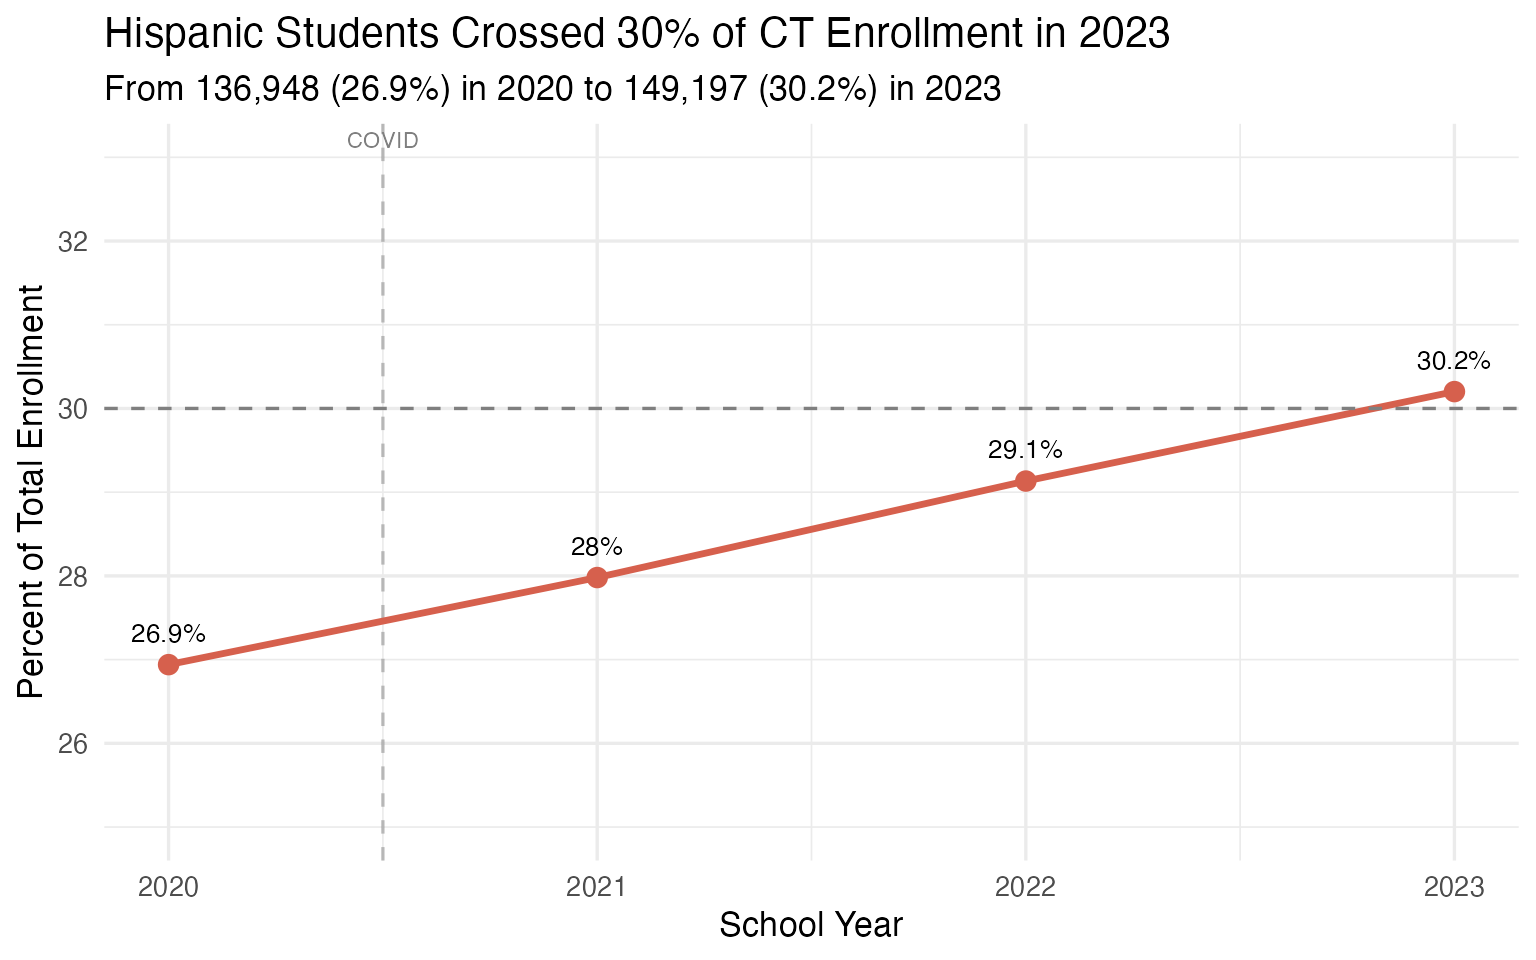
2. Bridgeport bounced back – Hartford and New Haven didn’t
COVID hit Connecticut’s three largest cities hard, but the recovery has been uneven. Bridgeport lost 1,195 students between 2020 and 2021, then clawed most of them back by 2023. Hartford (-10.9%) and New Haven (-7.9%) kept losing students every single year, suggesting a deeper structural decline beyond the pandemic.
big_three <- enr %>%
  filter(is_district,
         district_name %in% c("Bridgeport School District",
                              "Hartford School District",
                              "New Haven School District"),
         subgroup == "total_enrollment",
         grade_level == "TOTAL") %>%
  mutate(city = gsub(" School District", "", district_name)) %>%
  select(end_year, city, n_students) %>%
  arrange(city, end_year)

print(big_three)
#> # A tibble: 12 x 3
#>    end_year city       n_students
#>       <int> <chr>           <dbl>
#>  1     2020 Bridgeport      19423
#>  2     2021 Bridgeport      18228
#>  3     2022 Bridgeport      18391
#>  4     2023 Bridgeport      18508
#>  5     2020 Hartford        17344
#>  6     2021 Hartford        16371
#>  7     2022 Hartford        15790
#>  8     2023 Hartford        15448
#>  9     2020 New Haven       19307
#> 10     2021 New Haven       18586
#> 11     2022 New Haven       18001
#> 12     2023 New Haven       17776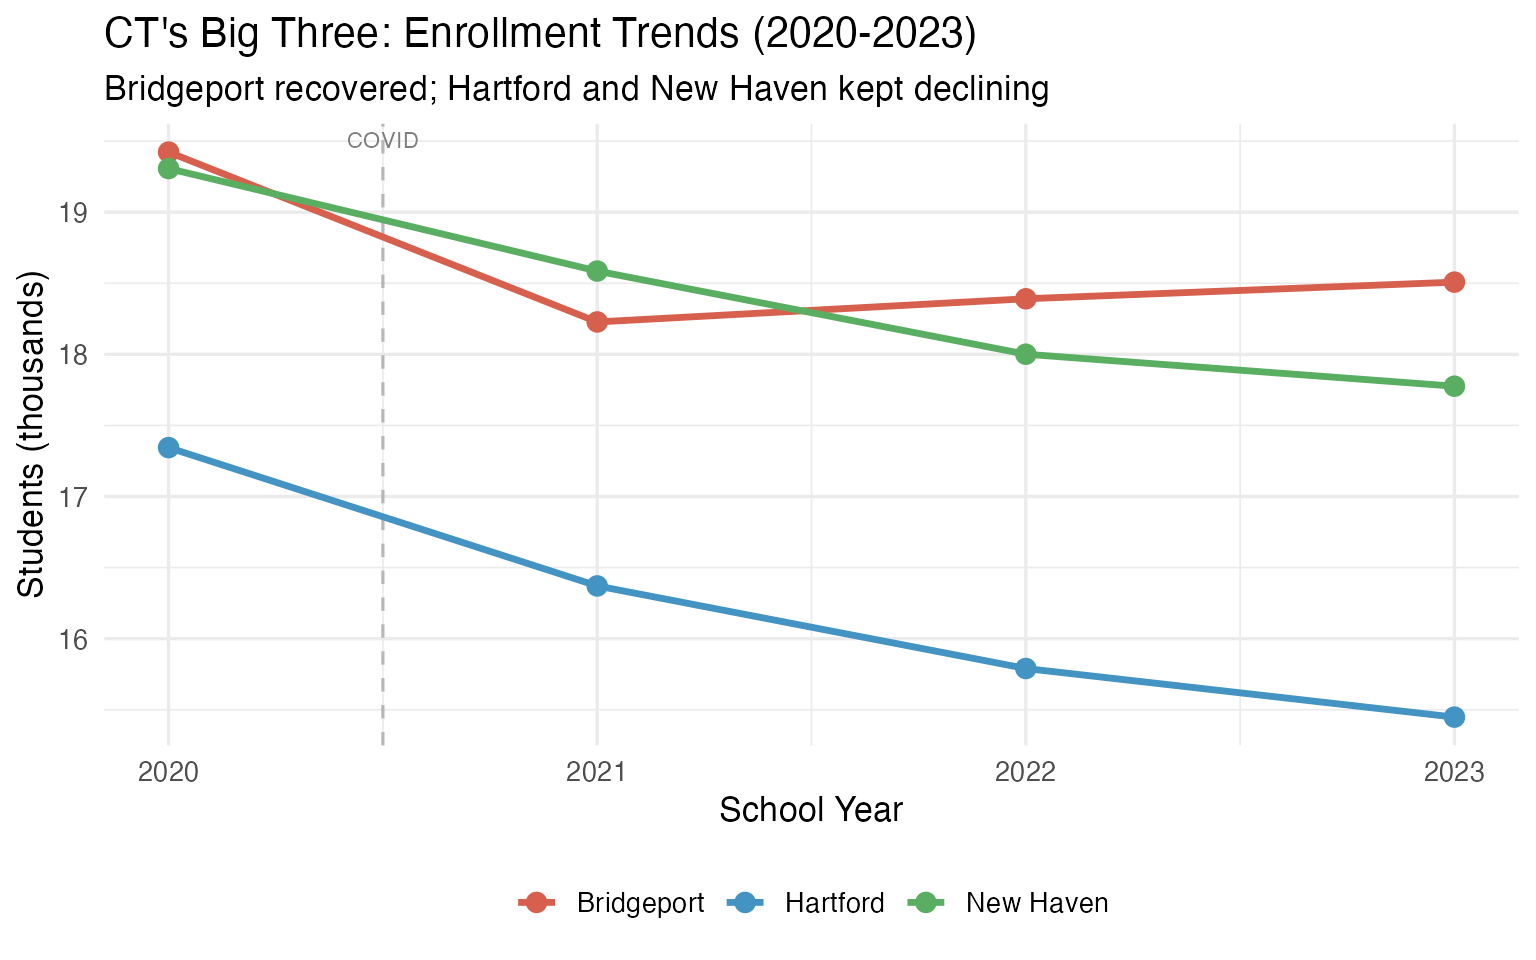
3. 84% of New London students qualify for free/reduced lunch
Free and reduced-price lunch eligibility is the most widely used proxy for student poverty, and the variation across Connecticut is staggering. In New London, 84% of students qualify. In nearby affluent communities, the rate drops below 5%. This gap captures Connecticut’s well-documented wealth inequality.
frl_districts <- enr %>%
  filter(is_district, subgroup == "free_reduced_lunch",
         grade_level == "TOTAL", end_year == 2023) %>%
  arrange(desc(pct)) %>%
  head(10) %>%
  mutate(city = gsub(" School District", "", district_name),
         pct_display = round(pct * 100, 1)) %>%
  select(city, district_name, n_students, pct_display)

print(frl_districts)
#> # A tibble: 10 x 4
#>    city                                  district_name                              n_students pct_display
#>    <chr>                                 <chr>                                           <dbl>       <dbl>
#>  1 New London                            New London School District                       2393        84.0
#>  2 Booker T. Washington Academy          Booker T. Washington Academy District              338        81.1
#>  3 Highville Charter School              Highville Charter School District                  317        78.9
#>  4 Elm City College Preparatory School   Elm City College Preparatory School District       594        78.5
#>  5 Hartford                              Hartford School District                        12002        77.7
#>  6 Amistad Academy                       Amistad Academy District                          846        77.3
#>  7 Unified School District #2            Unified School District #2                         53        76.8
#>  8 Bridgeport                            Bridgeport School District                      14197        76.7
#>  9 Meriden                               Meriden School District                          6371        74.6
#> 10 Achievement First Bridgeport Academy  Achievement First Bridgeport Academy District     774        73.8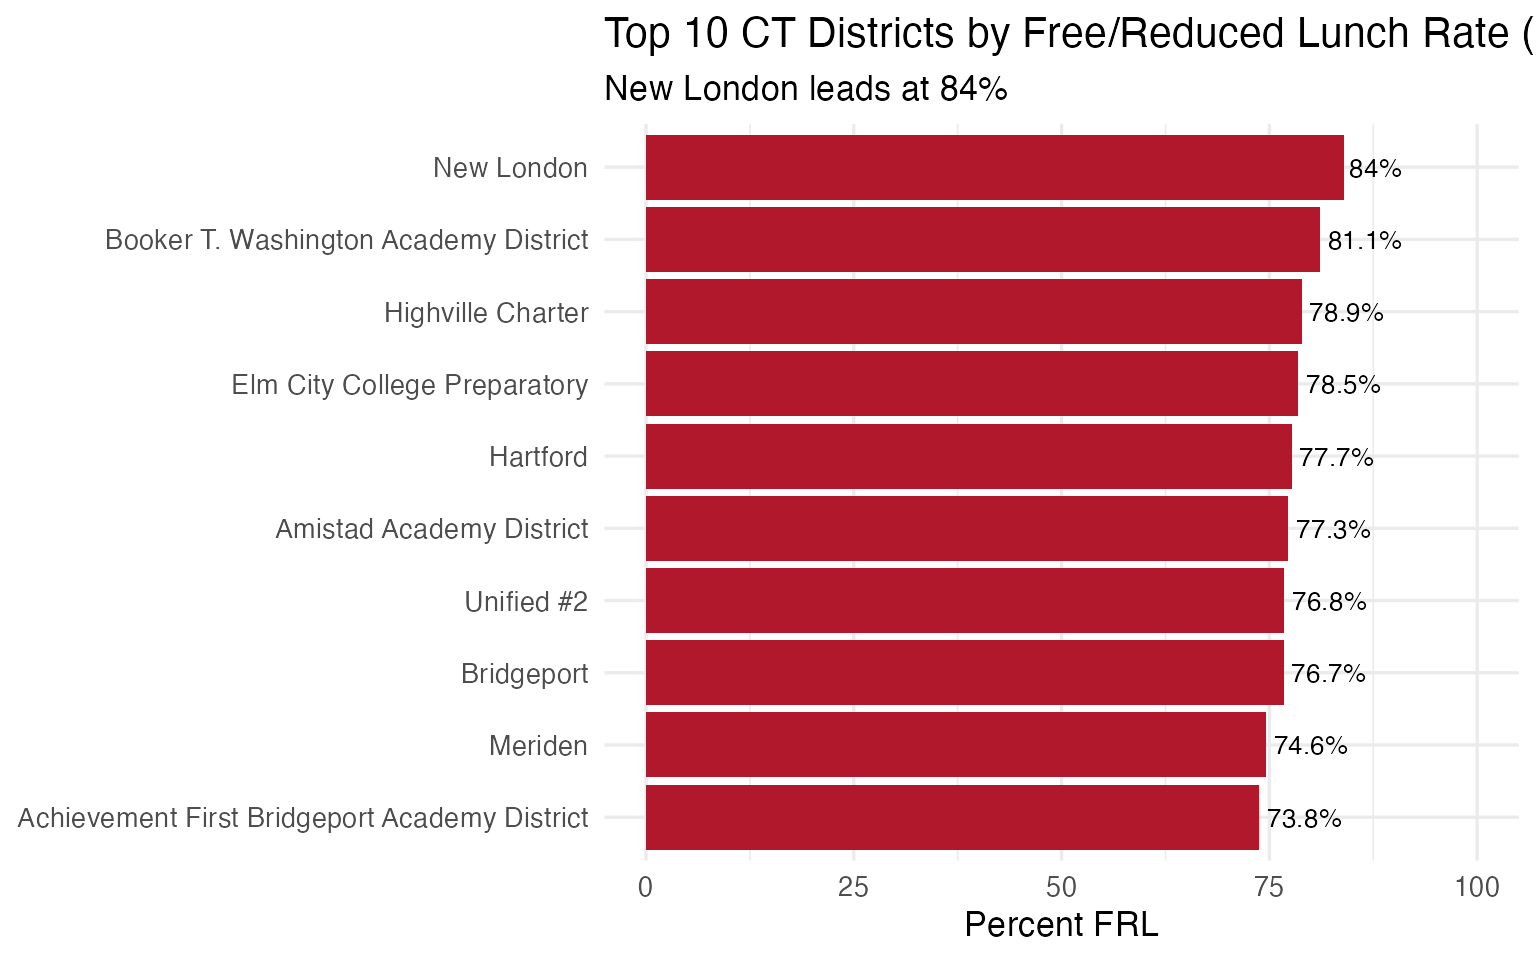
Data Taxonomy
| Category | Years | Function | Details |
|---|---|---|---|
| Enrollment | 2011-2026 | fetch_enr() |
State and district. Stable core: total, race, FRPL, SpEd, LEP. Optional extras when source-backed |
| Assessments | — | — | Not yet available |
| Graduation | — | — | Not yet available |
| Directory | Current | fetch_directory() |
Schools, districts. Addresses, org codes, grades served |
| Per-Pupil Spending | — | — | Not yet available |
| Accountability | — | — | Not yet available |
| Chronic Absence | — | — | Not yet available |
| EL Progress | — | — | Not yet available |
| Special Ed | — | — | Not yet available |
See the full data category taxonomy for what each category covers.
Quick Start
R
# install.packages("remotes")
remotes::install_github("almartin82/ctschooldata")

library(ctschooldata)
library(dplyr)

# Fetch 2023 enrollment
enr <- fetch_enr(2023, use_cache = TRUE)

# State total
enr %>%
  filter(is_state, subgroup == "total_enrollment") %>%
  select(end_year, n_students)
#>   end_year n_students
#> 1 2023 494006Explore More
Full analysis with 15 stories: - Enrollment trends — 15 stories - Getting started — installation, examples, data sources - Function reference
Data Notes
- Source: Canonical bundle built from CTData.org historical enrollment files (2011-2019), CT Open Data attendance datasets (2020-2023), and validated EdSight latest-year exports (2024-2026)
- Available years: 2011-2026
- Census Day: October 1 enrollment counts
-
Suppression: CSDE suppresses small cell sizes for student privacy (markers:
*,<5,-9999) -
Contract:
fetch_enr()returns district/state rows only. School-level CT enrollment is not part of the canonical public surface. -
Stable core:
total_enrollment, race,lep,special_ed, and FRPL/economic-status rows exist for every supported year. -
Optional extras: Additional rows such as
homeless,high_needs,free_lunch, andreduced_lunchare preserved when the source provides them cleanly. -
Grade level: Historical CTData years include per-grade
total_enrollment; demographic rows stay atTOTAL.
Deeper Dive
4. Bridgeport leads CT’s Big 5 with 18,508 students
Connecticut’s urban core is spread across five mid-size cities rather than dominated by one megacity. Bridgeport, Waterbury, and New Haven are nearly tied at the top, each serving around 17,500-18,500 students.
top_districts <- enr %>%
  filter(is_district, subgroup == "total_enrollment",
         grade_level == "TOTAL", end_year == 2023) %>%
  arrange(desc(n_students)) %>%
  head(10) %>%
  select(district_name, district_id, n_students)

print(top_districts)
#> # A tibble: 10 x 3
#>    district_name                                      district_id n_students
#>    <chr>                                              <chr>            <dbl>
#>  1 Bridgeport School District                         0150011          18508
#>  2 Waterbury School District                          1510011          17786
#>  3 New Haven School District                          0930011          17776
#>  4 Stamford School District                           1350011          15938
#>  5 Hartford School District                           0640011          15448
#>  6 Danbury School District                            0340011          11925
#>  7 Norwalk School District                            1030011          11326
#>  8 Connecticut Technical Education and Career System  9000016          10949
#>  9 New Britain School District                        0890011           9367
#> 10 Fairfield School District                          0510011           9279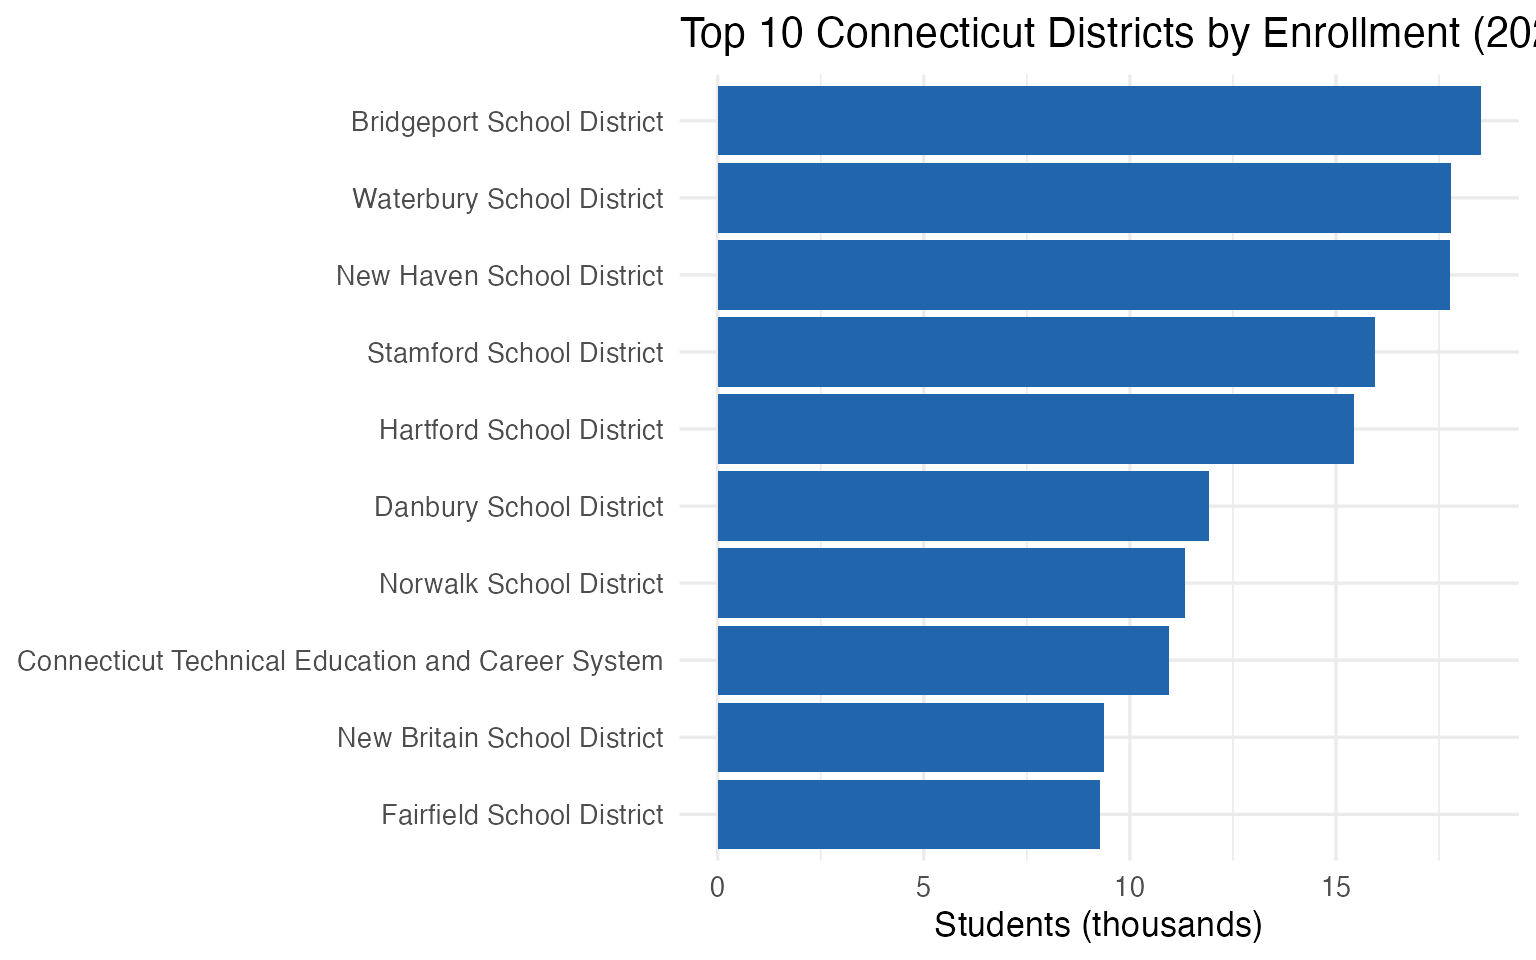
5. Connecticut lost 14,339 students in 4 years
State enrollment fell from 508,345 in 2020 to 494,006 in 2023 – a decline of 2.8%. The steepest drop came between 2020 and 2021, coinciding with pandemic-era enrollment losses.
state_trend <- enr %>%
  filter(is_state, subgroup == "total_enrollment",
         grade_level == "TOTAL") %>%
  select(end_year, n_students) %>%
  arrange(end_year) %>%
  mutate(
    change = n_students - lag(n_students),
    pct_change = round((n_students / lag(n_students) - 1) * 100, 1)
  )

print(state_trend)
#> # A tibble: 4 x 4
#>   end_year n_students change pct_change
#>      <int>      <dbl>  <dbl>      <dbl>
#> 1     2020     508345     NA       NA
#> 2     2021     496458 -11887       -2.3
#> 3     2022     495156  -1302       -0.3
#> 4     2023     494006  -1150       -0.2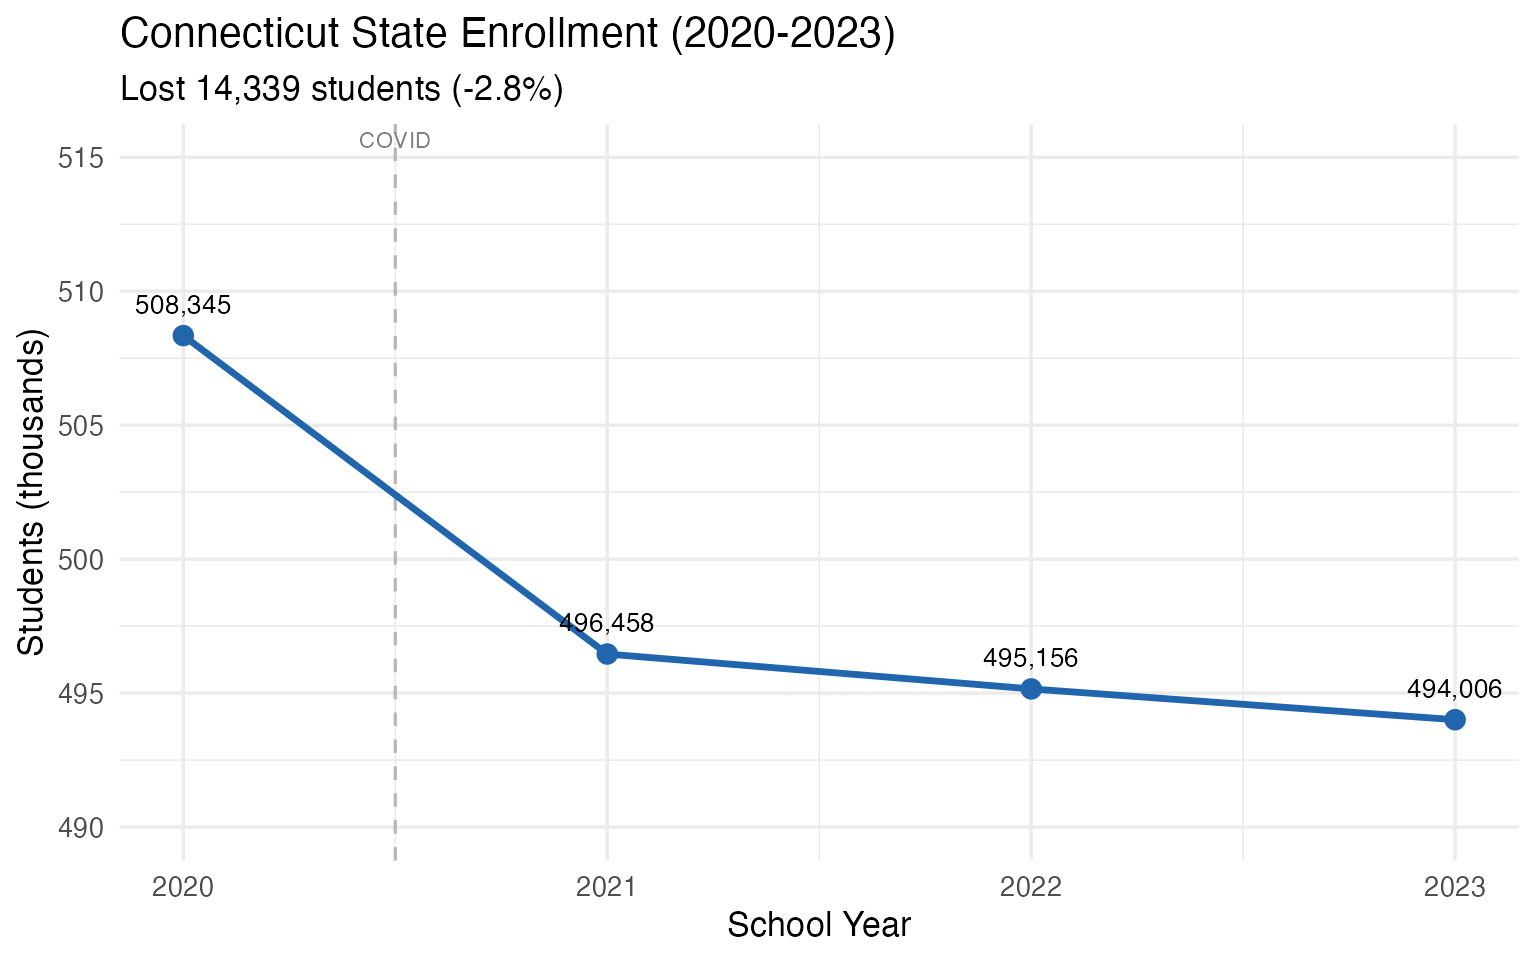
6. Hartford is 58% Hispanic, 6.7% white
Hartford School District’s demographics tell the story of a majority-minority urban core surrounded by predominantly white suburbs. With 58% Hispanic students, 29.1% Black, and only 6.7% white, Hartford’s racial composition is nearly inverse of the state average.
hartford_demo <- enr %>%
  filter(is_district,
         district_name == "Hartford School District",
         end_year == 2023,
         grade_level == "TOTAL",
         subgroup %in% c("white", "black", "hispanic", "other_races",
                         "lep", "special_ed", "free_reduced_lunch",
                         "total_enrollment", "homeless")) %>%
  select(subgroup, n_students, pct) %>%
  arrange(desc(n_students))

print(hartford_demo)
#> # A tibble: 9 x 3
#>   subgroup            n_students     pct
#>   <chr>                    <dbl>   <dbl>
#> 1 total_enrollment         15448 1.000
#> 2 free_reduced_lunch       12002 0.777
#> 3 hispanic                  8957 0.580
#> 4 black                     4490 0.291
#> 5 lep                       3701 0.240
#> 6 special_ed                2993 0.194
#> 7 white                     1034 0.067
#> 8 other_races                967 0.063
#> 9 homeless                   153 0.010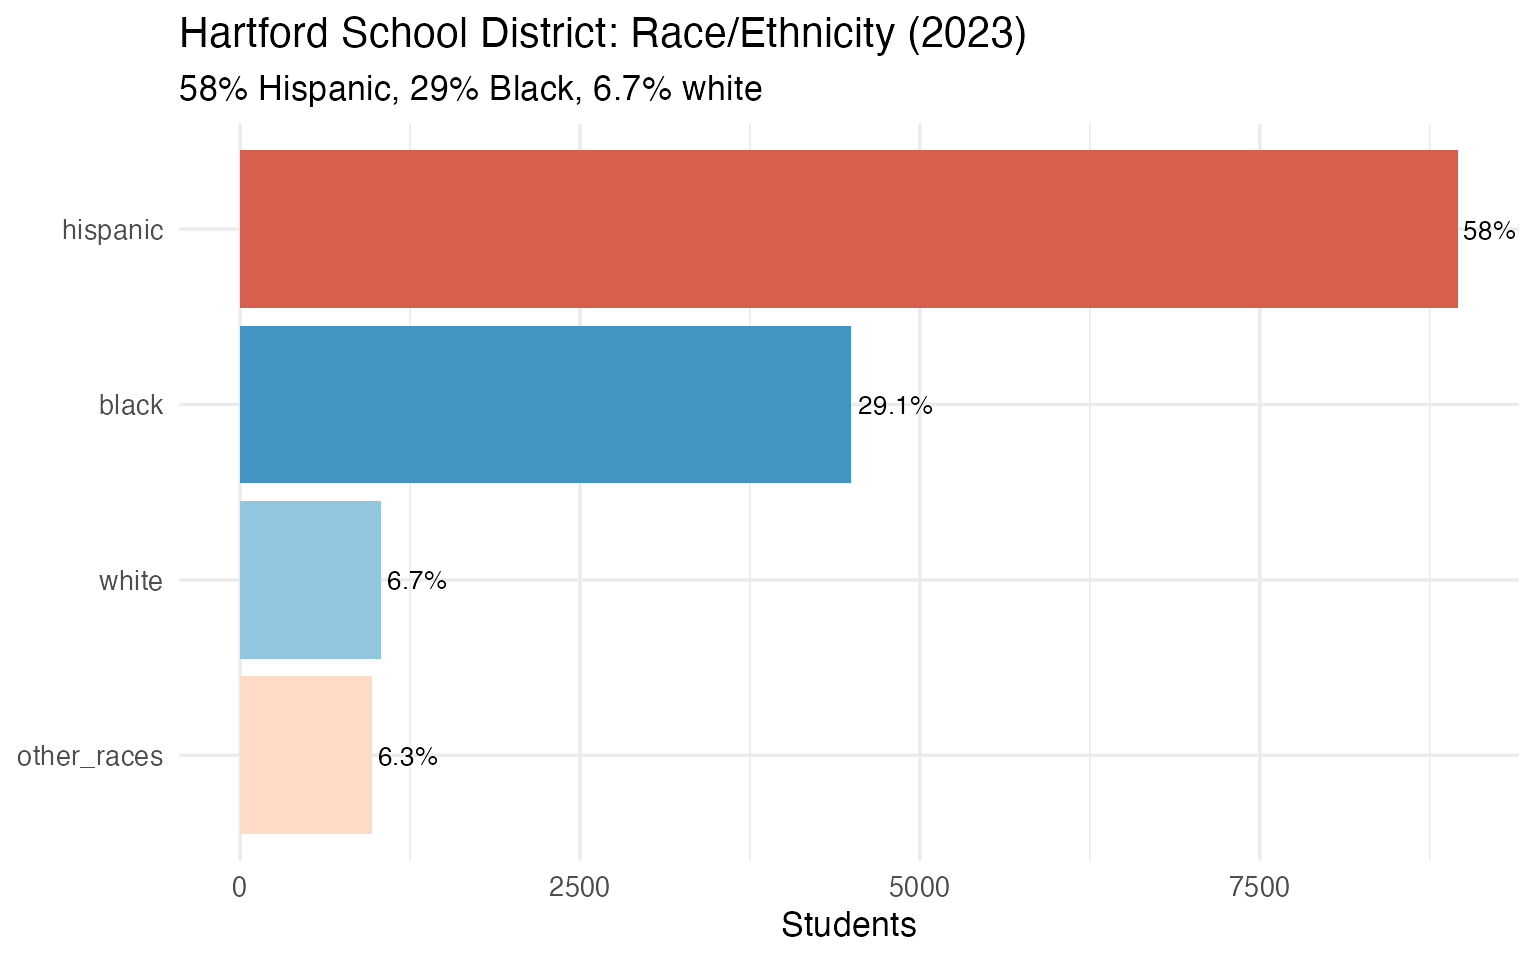
7. CT’s 5 largest districts hold just 17% of state enrollment
Connecticut is one of the most decentralized states in the country for public education. The top 5 districts combine for just 17.2% of statewide enrollment. With 200 districts across a small state, Connecticut’s town-by-town governance model creates extreme fragmentation.
state_total_2023 <- enr %>%
  filter(is_state, subgroup == "total_enrollment",
         grade_level == "TOTAL", end_year == 2023) %>%
  pull(n_students)

top_5 <- enr %>%
  filter(is_district, subgroup == "total_enrollment",
         grade_level == "TOTAL", end_year == 2023) %>%
  arrange(desc(n_students)) %>%
  head(5) %>%
  select(district_name, n_students) %>%
  mutate(pct_of_state = round(n_students / state_total_2023 * 100, 1))

cat("State total (2023):", scales::comma(state_total_2023), "\n")
#> State total (2023): 494,006
cat("Top 5 combined:", scales::comma(sum(top_5$n_students)), "\n")
#> Top 5 combined: 85,456
cat("Top 5 share:", round(sum(top_5$n_students) / state_total_2023 * 100, 1), "%\n\n")
#> Top 5 share: 17.3 %
print(top_5)
#> # A tibble: 5 x 3
#>   district_name              n_students pct_of_state
#>   <chr>                           <dbl>        <dbl>
#> 1 Bridgeport School District      18508          3.7
#> 2 Waterbury School District       17786          3.6
#> 3 New Haven School District       17776          3.6
#> 4 Stamford School District        15938          3.2
#> 5 Hartford School District        15448          3.1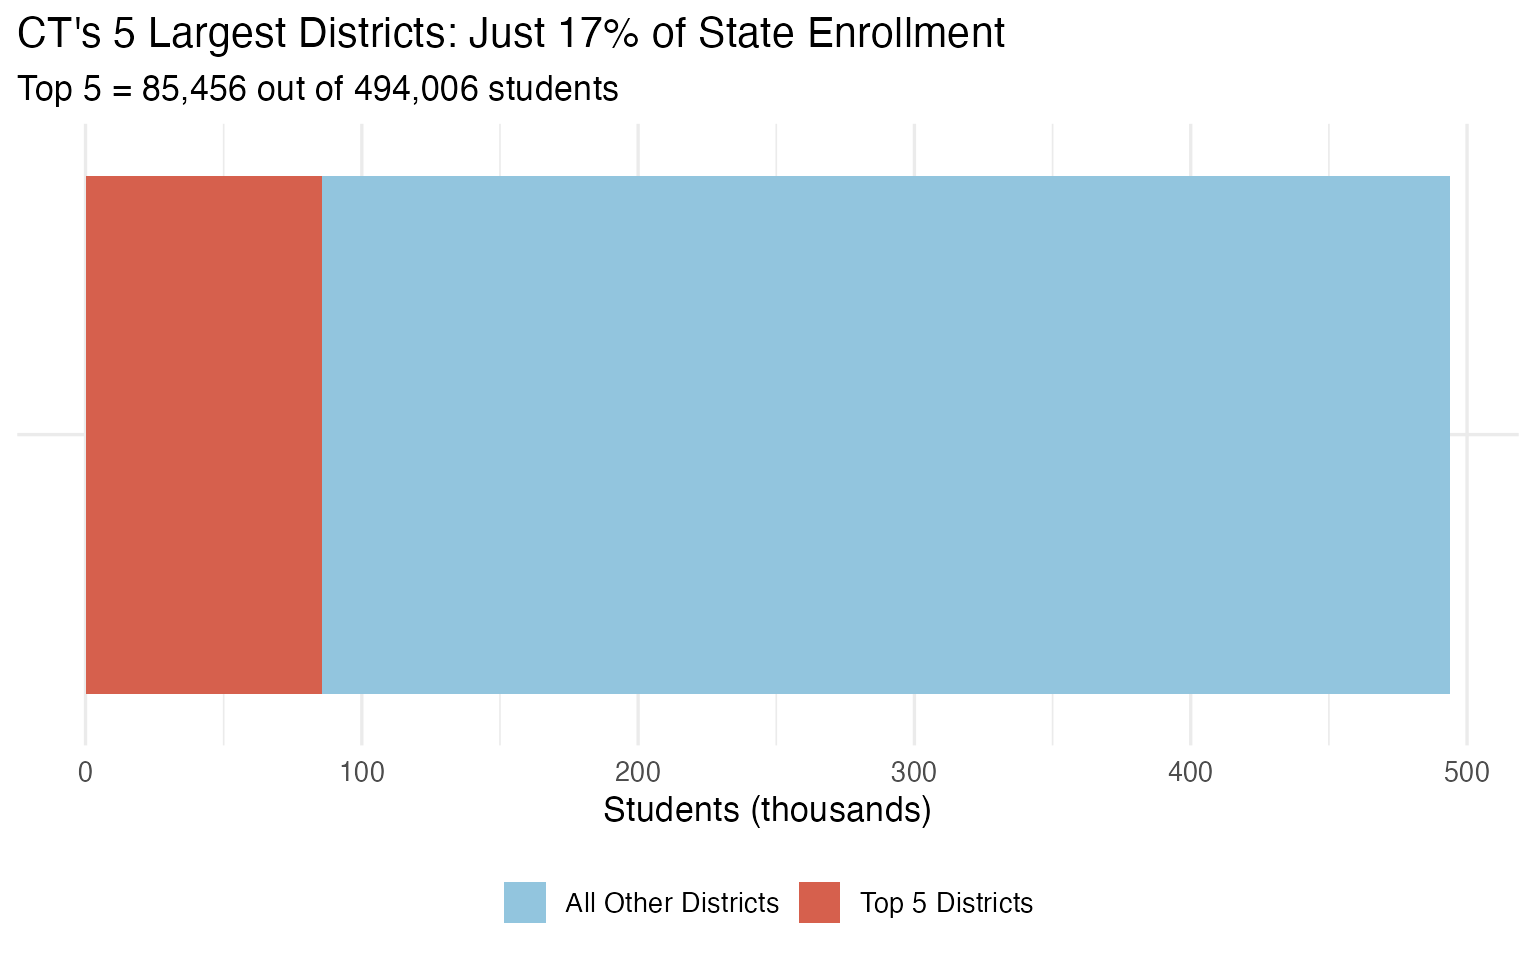
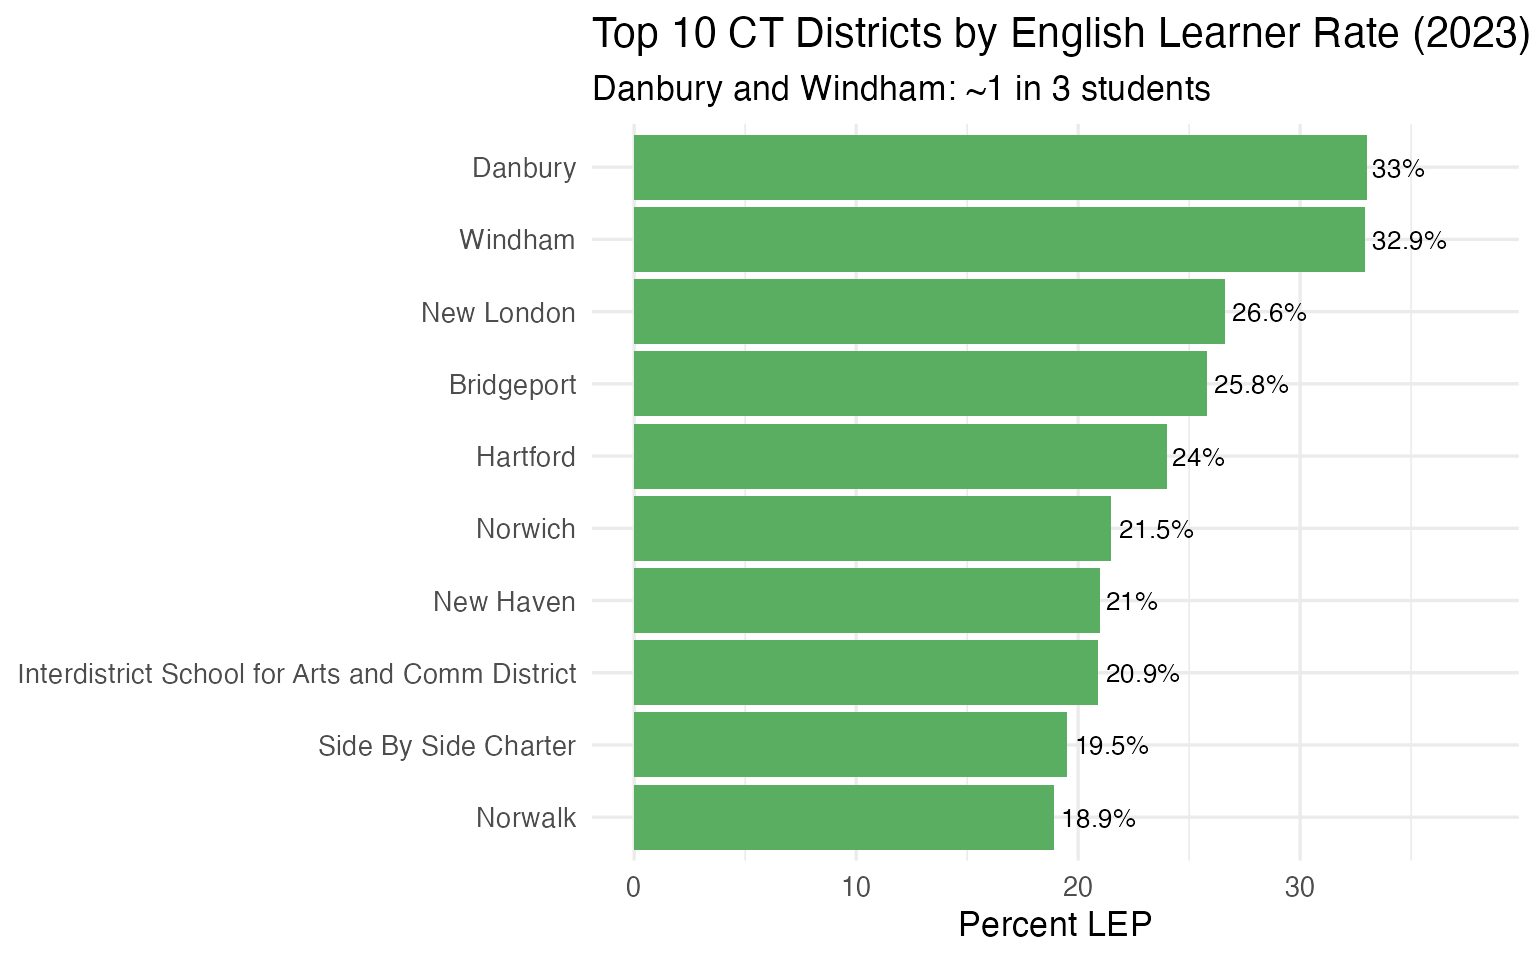
8. 1 in 3 students in Danbury and Windham are English learners
English learner (LEP) concentration varies enormously across Connecticut. In Danbury and Windham, roughly a third of students are English learners. This hyper-concentration creates staffing and resource challenges in just a handful of districts.
lep_districts <- enr %>%
  filter(is_district, subgroup == "lep",
         grade_level == "TOTAL", end_year == 2023) %>%
  arrange(desc(pct)) %>%
  head(10) %>%
  mutate(city = gsub(" School District", "", district_name),
         pct_display = round(pct * 100, 1)) %>%
  select(city, district_name, n_students, pct_display)

print(lep_districts)
#> # A tibble: 10 x 4
#>    city         district_name              n_students pct_display
#>    <chr>        <chr>                           <dbl>       <dbl>
#>  1 Danbury      Danbury School District          3936        33.0
#>  2 Windham      Windham School District            978        32.9
#>  3 New London   New London School District         758        26.6
#>  4 Bridgeport   Bridgeport School District        4781        25.8
#>  5 Hartford     Hartford School District          3701        24.0
#>  6 Norwich      Norwich School District            690        21.5
#>  7 New Haven    New Haven School District         3735        21.0
#>  ...
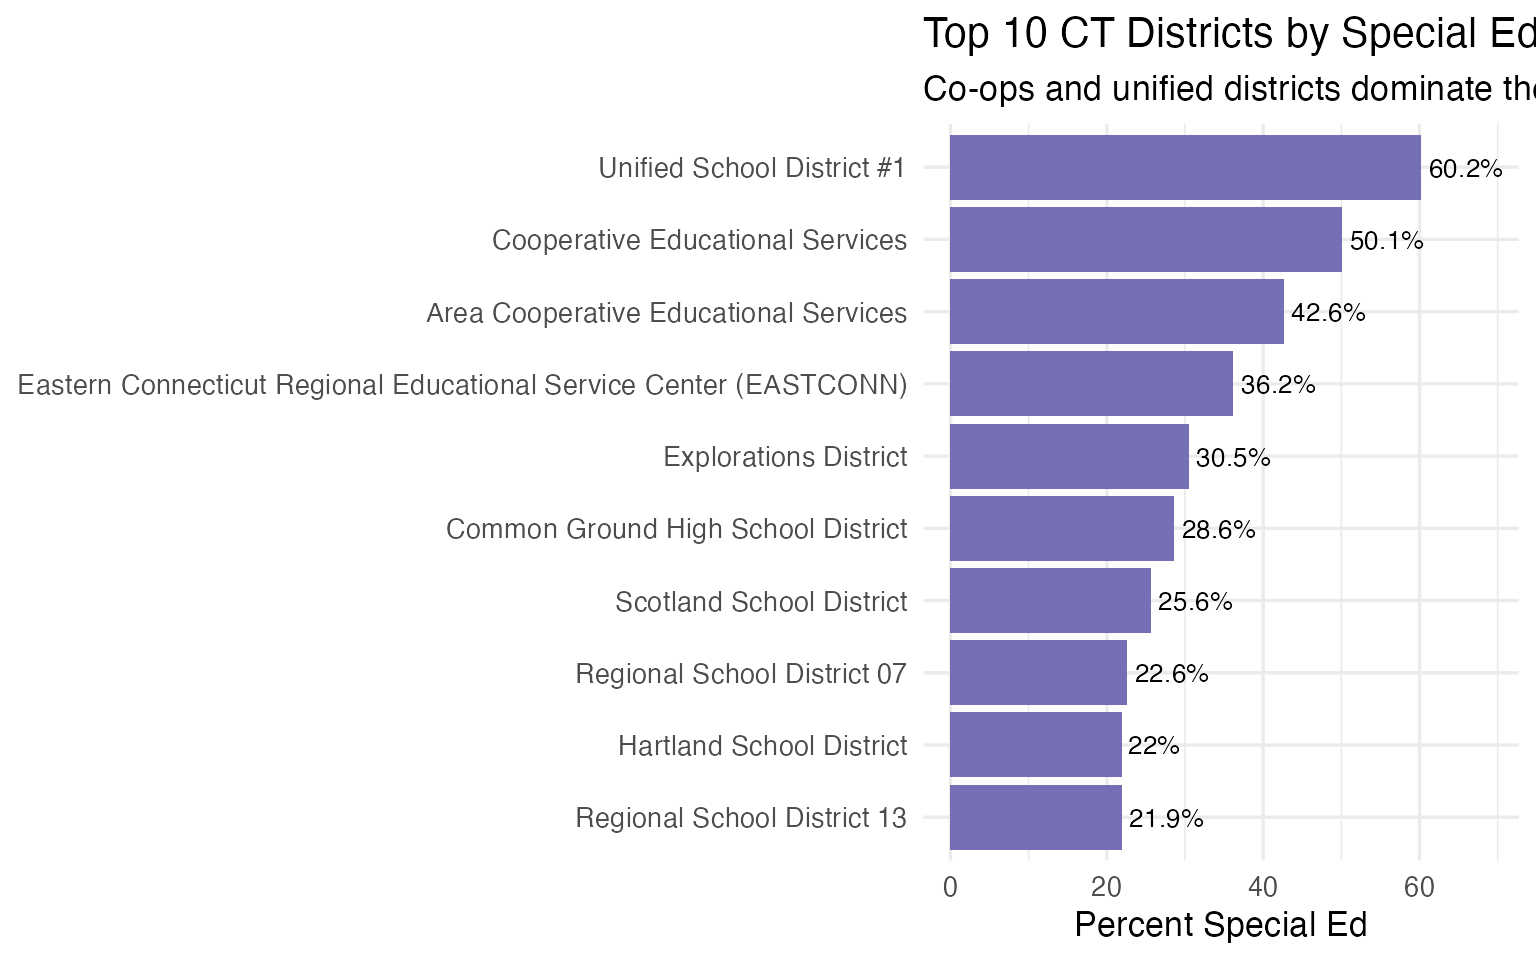
9. Special education co-ops serve mostly IEP students
Connecticut has several cooperative educational service districts that specialize in serving students with disabilities. Unified School District #1, Cooperative Educational Services, and Area Cooperative Educational Services all have special education rates above 40%.
sped_districts <- enr %>%
  filter(is_district, subgroup == "special_ed",
         grade_level == "TOTAL", end_year == 2023) %>%
  arrange(desc(pct)) %>%
  head(10) %>%
  mutate(pct_display = round(pct * 100, 1)) %>%
  select(district_name, n_students, pct_display)

print(sped_districts)
#> # A tibble: 10 x 3
#>    district_name                                                    n_students pct_display
#>    <chr>                                                                 <dbl>       <dbl>
#>  1 Unified School District #1                                               74        60.2
#>  2 Cooperative Educational Services                                        333        50.1
#>  3 Area Cooperative Educational Services                                   734        42.6
#>  4 Eastern Connecticut Regional Educational Service Center (EASTCONN)      141        36.2
#>  5 Explorations District                                                    25        30.5
#>  ...
10. Student homelessness dropped 39% in 4 years
Connecticut identified 3,916 students experiencing homelessness in 2020 but only 2,385 in 2023 – a 39% decline. The 2023 drop to the lowest count in the series is notable.
homeless_trend <- enr %>%
  filter(is_state, subgroup == "homeless",
         grade_level == "TOTAL") %>%
  select(end_year, n_students, pct) %>%
  arrange(end_year) %>%
  mutate(pct_display = round(pct * 100, 2))

print(homeless_trend)
#> # A tibble: 4 x 4
#>   end_year n_students    pct pct_display
#>      <int>      <dbl>  <dbl>       <dbl>
#> 1     2020       3916 0.0077        0.77
#> 2     2021       3110 0.0063        0.63
#> 3     2022       3645 0.0074        0.74
#> 4     2023       2385 0.0048        0.48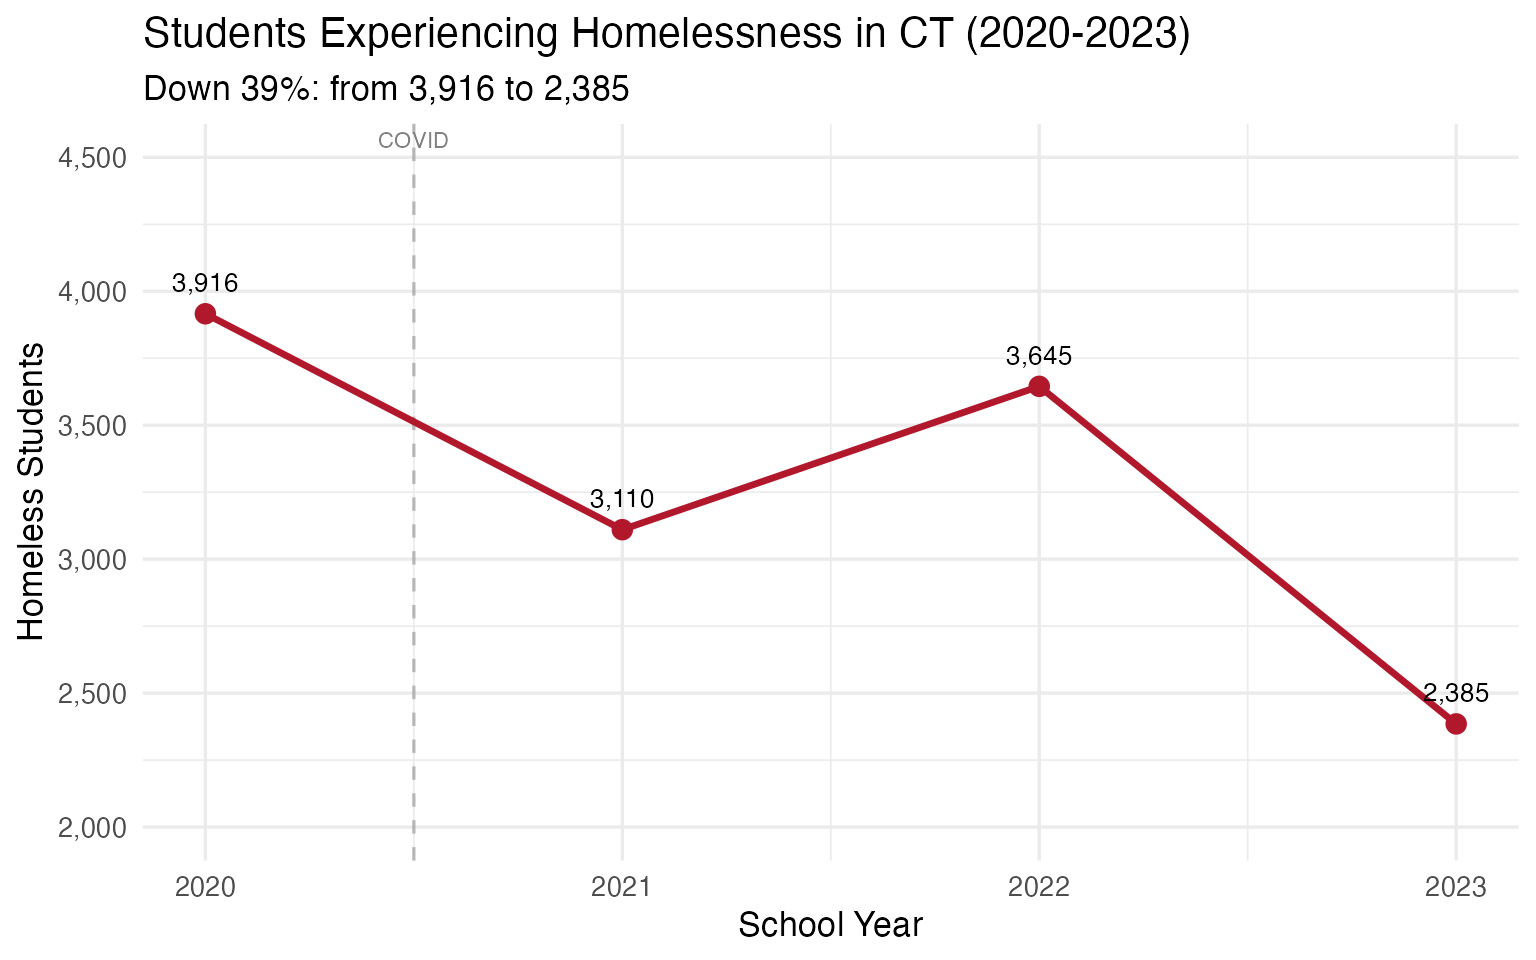
11. Half of CT students are classified “high needs”
Connecticut’s “high needs” designation covers just over half the student body at 50.8% in 2023, down slightly from 52.5% in 2020.
high_needs_trend <- enr %>%
  filter(is_state,
         subgroup %in% c("high_needs", "without_high_needs"),
         grade_level == "TOTAL") %>%
  select(end_year, subgroup, n_students, pct) %>%
  arrange(end_year, desc(n_students))

print(high_needs_trend)
#> # A tibble: 8 x 4
#>   end_year subgroup            n_students   pct
#>      <int> <chr>                    <dbl> <dbl>
#> 1     2020 high_needs              266735 0.525
#> 2     2020 without_high_needs      241610 0.475
#> 3     2021 high_needs              255883 0.515
#> 4     2021 without_high_needs      240575 0.485
#> 5     2022 high_needs              259420 0.524
#> 6     2022 without_high_needs      235736 0.476
#> 7     2023 high_needs              250820 0.508
#> 8     2023 without_high_needs      243186 0.492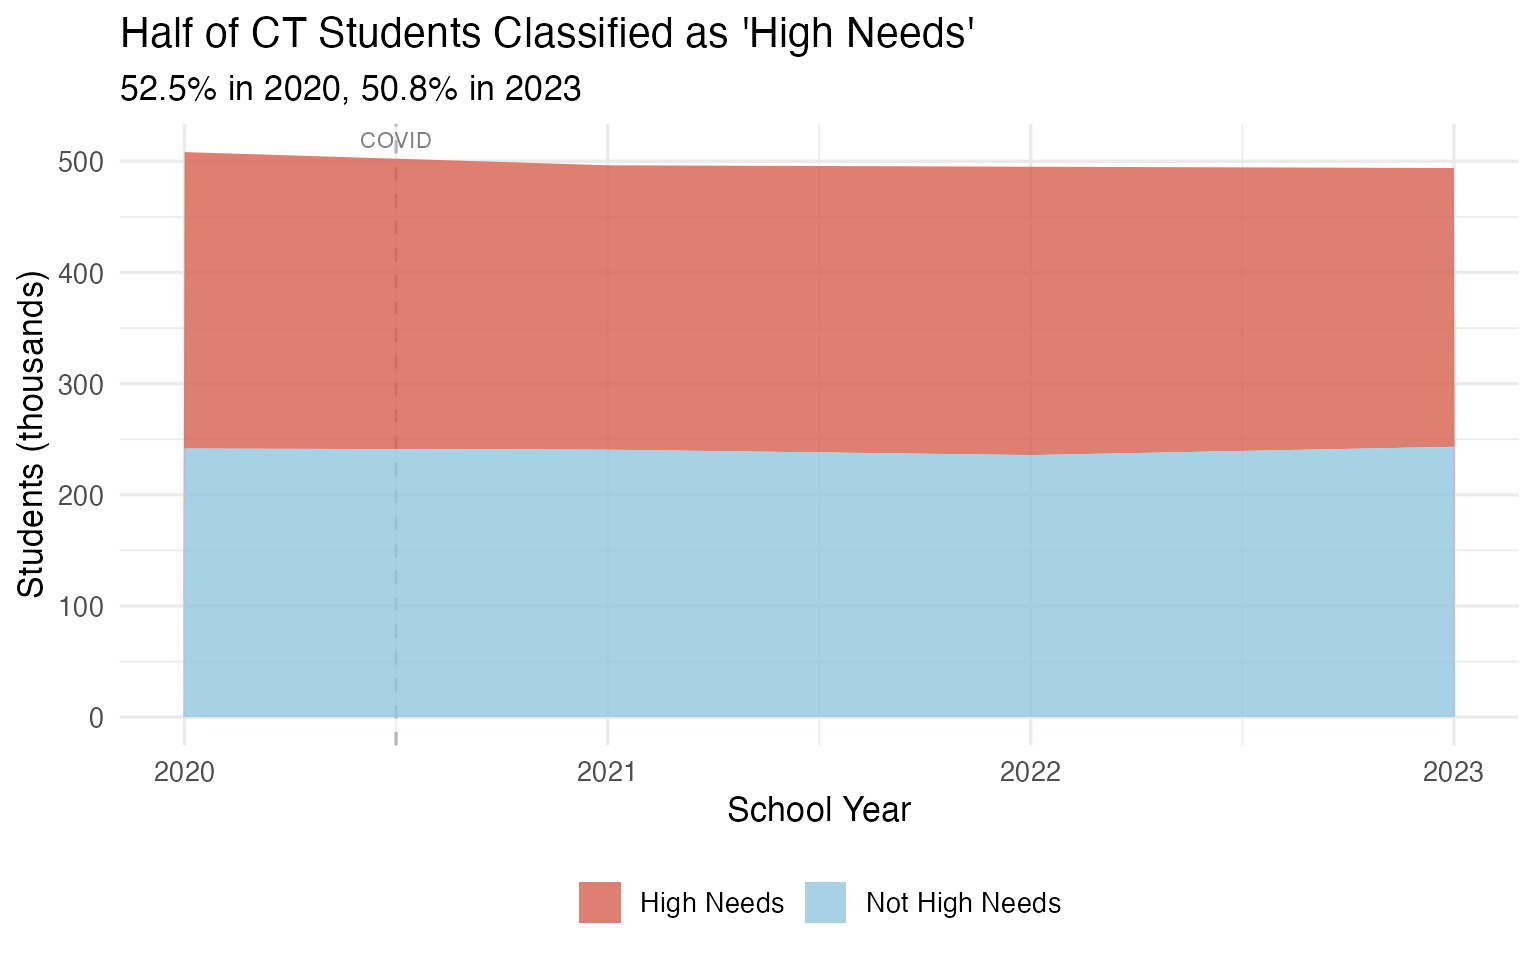
12. Danbury High is CT’s largest school at 3,497 students
At the school level, Danbury High School towers over the rest with 3,497 students – over 800 more than the next largest school.
top_schools <- enr %>%
  filter(is_campus, subgroup == "total_enrollment",
         grade_level == "TOTAL", end_year == 2023) %>%
  arrange(desc(n_students)) %>%
  head(10) %>%
  mutate(city = gsub(" School District", "", district_name)) %>%
  select(campus_name, city, n_students)

print(top_schools)
#> # A tibble: 10 x 3
#>    campus_name              city          n_students
#>    <chr>                    <chr>              <dbl>
#>  1 Danbury High School      Danbury             3497
#>  2 Greenwich High School    Greenwich           2651
#>  3 Westhill High School     Stamford            2229
#>  4 New Britain High School  New Britain         2210
#>  5 Trumbull High School     Trumbull            2128
#>  6 Stamford High School     Stamford            2028
#>  7 Norwich Free Academy     Norwich Free...     2013
#>  8 Southington High School  Southington         1930
#>  9 Glastonbury High School  Glastonbury         1803
#> 10 West Haven High School   West Haven          1742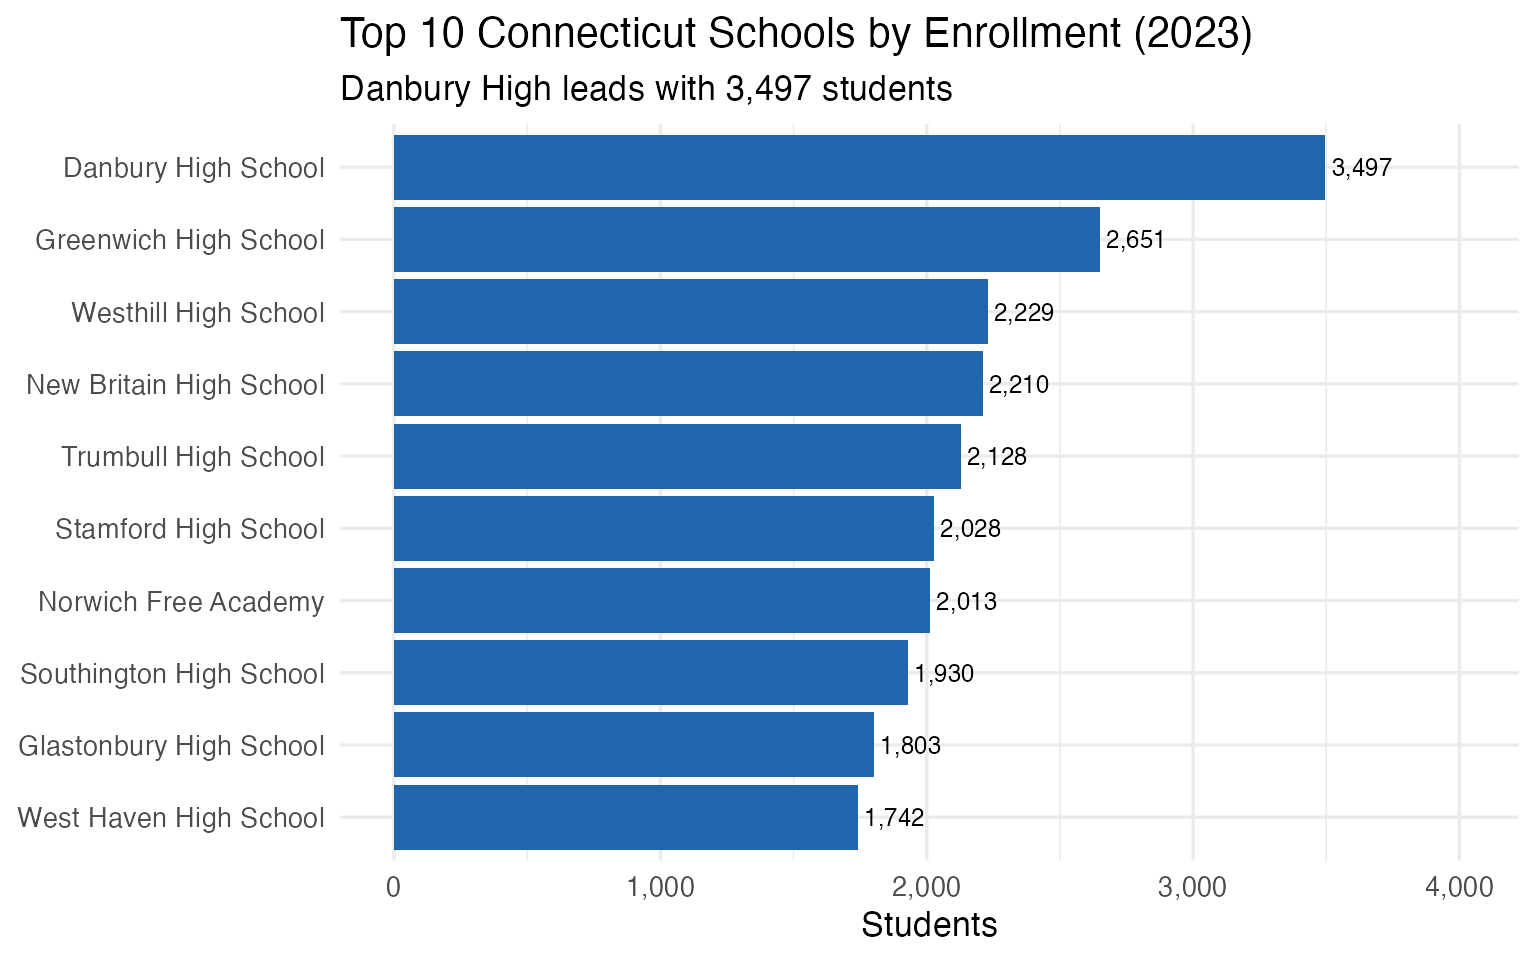
13. 8 charter schools serve just 3,131 students – 0.6% of the state
Connecticut has one of the smallest charter school sectors in the country. Just 8 charter schools enroll a combined 3,131 students.
charters <- enr %>%
  filter(is_charter, subgroup == "total_enrollment",
         grade_level == "TOTAL", end_year == 2023) %>%
  arrange(desc(n_students)) %>%
  select(campus_name, district_name, n_students)

cat("Charter schools:", nrow(charters), "\n")
#> Charter schools: 8
cat("Total charter students:", scales::comma(sum(charters$n_students)), "\n")
#> Total charter students: 3,131
print(charters)
#> # A tibble: 8 x 3
#>   campus_name                          district_name                               n_students
#>   <chr>                                <chr>                                            <dbl>
#> 1 Great Oaks Charter School            Great Oaks Charter School District                 608
#> 2 Stamford Charter School for Excell…  Stamford Charter School for Excellence Dis…        463
#> 3 Charter Oak International Academy    West Hartford School District                      445
#> 4 Highville Charter School             Highville Charter School District                  402
#> 5 Park City Prep Charter School        Park City Prep Charter School District             372
#> 6 Integrated Day Charter School        Integrated Day Charter School District             325
#> 7 Brass City Charter School            Brass City Charter School District                 321
#> 8 Side By Side Charter School          Side By Side Charter School District               195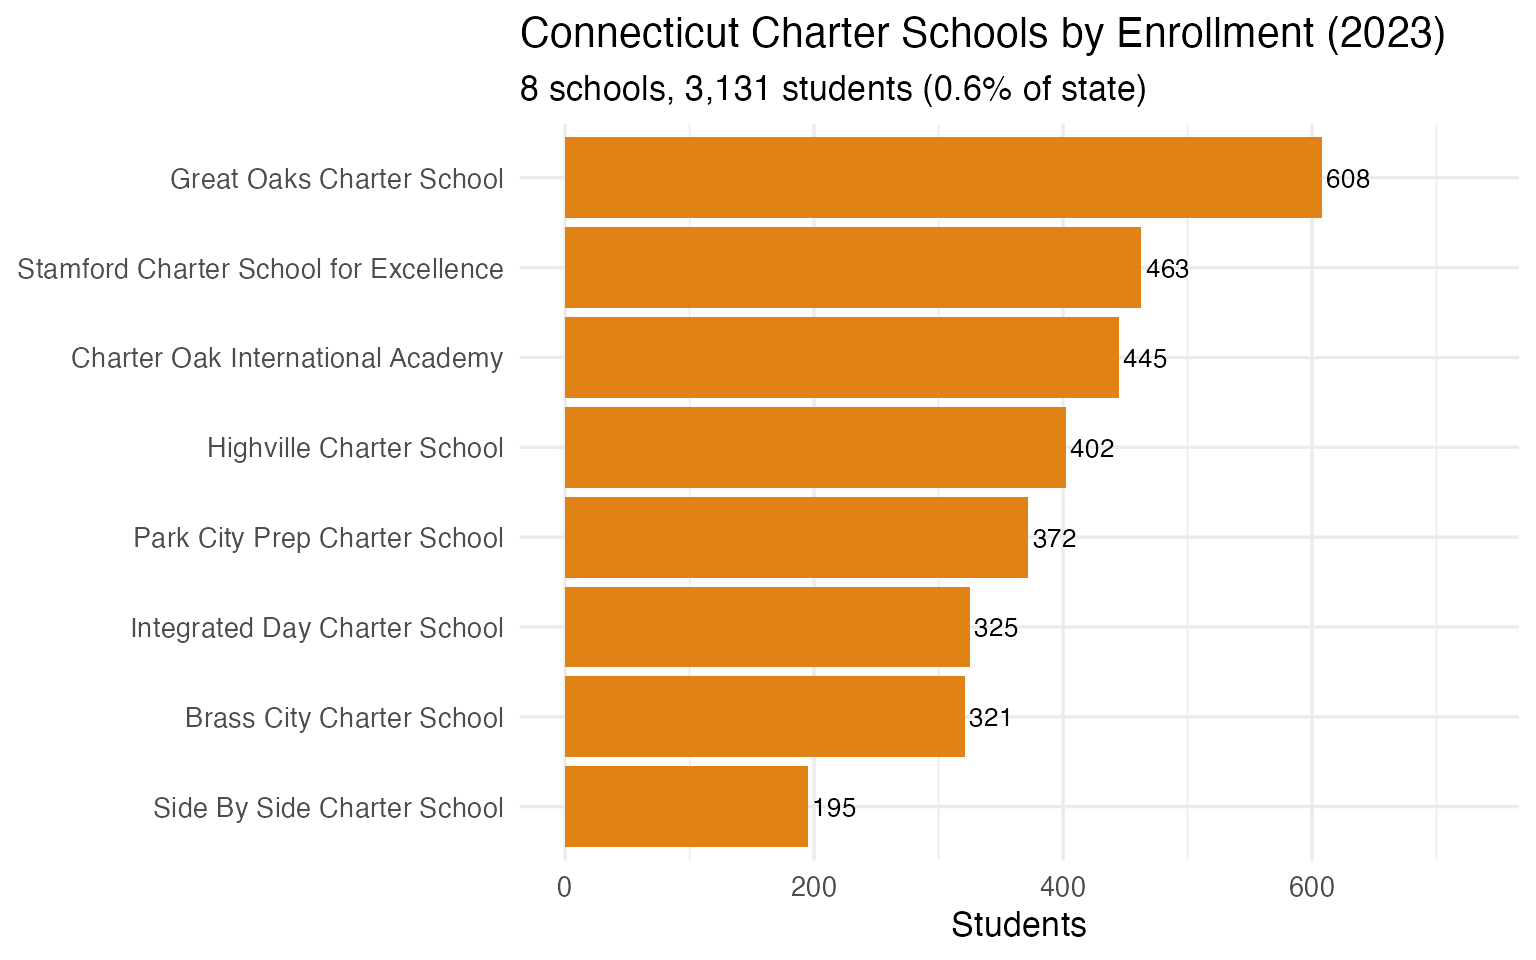
14. Union School District has just 48 students
Connecticut’s smallest districts are remarkably tiny. Union School District enrolls just 48 students – an entire K-8 district smaller than most individual classrooms.
smallest <- enr %>%
  filter(is_district, subgroup == "total_enrollment",
         grade_level == "TOTAL", end_year == 2023,
         n_students > 0) %>%
  arrange(n_students) %>%
  head(10) %>%
  select(district_name, district_id, n_students)

print(smallest)
#> # A tibble: 10 x 3
#>    district_name                district_id n_students
#>    <chr>                        <chr>            <dbl>
#>  1 Union School District        1450011             48
#>  2 Norfolk School District      0980011             58
#>  3 Hampton School District      0630011             60
#>  4 Unified School District #2   3470015             69
#>  5 Colebrook School District    0290011             72
#>  6 Canaan School District       0210011             74
#>  7 Scotland School District     1230011             78
#>  8 Explorations District        2720013             82
#>  9 Cornwall School District     0310011             93
#> 10 Sharon School District       1250011            100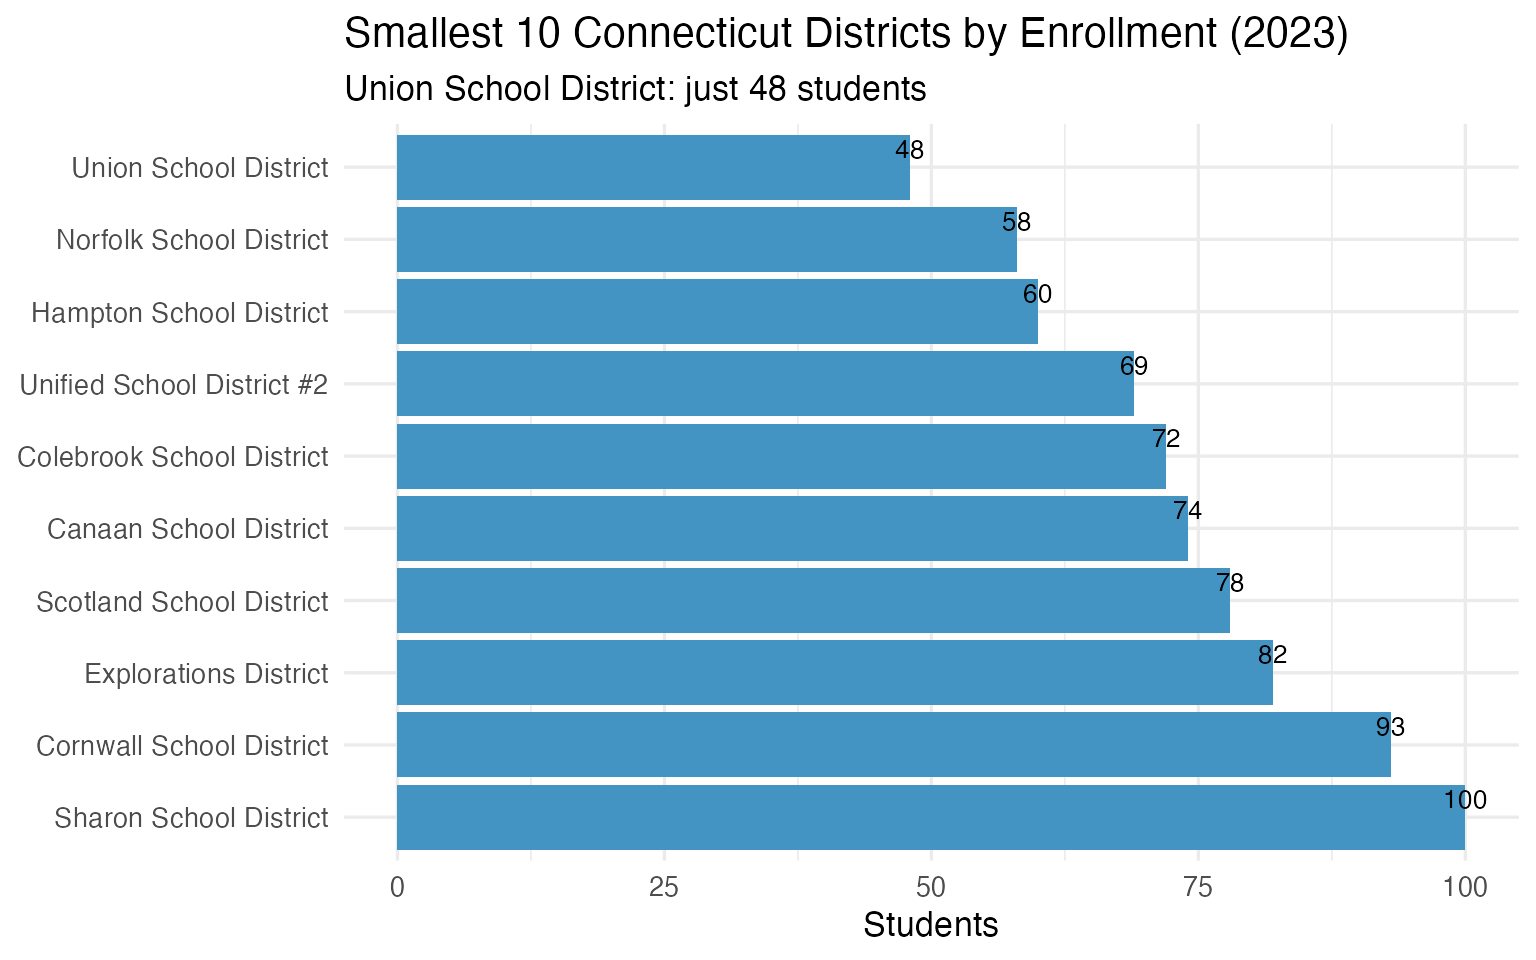
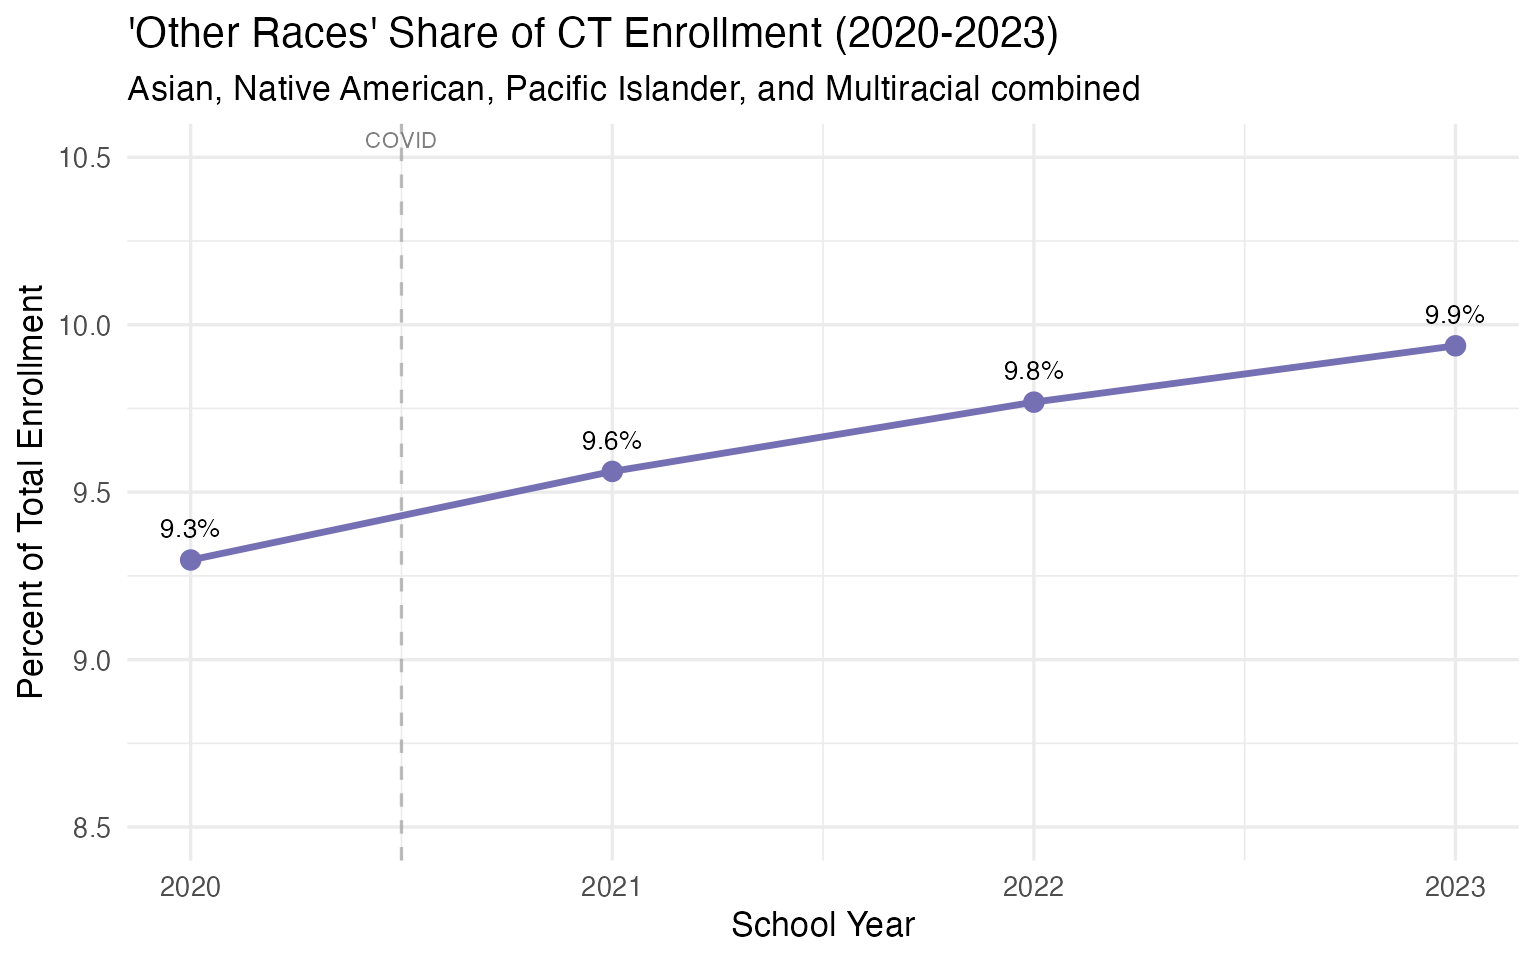
15. “Other races” grew from 9.3% to 9.9% – a proxy for diversification
Connecticut’s attendance data lumps Asian, Native American, Pacific Islander, and Multiracial students into a single “other races” category. This group grew from 9.3% (47,263 students) in 2020 to 9.9% (49,090) in 2023, suggesting increasing diversity beyond the traditional categories.
other_trend <- enr %>%
  filter(is_state, subgroup == "other_races",
         grade_level == "TOTAL") %>%
  select(end_year, n_students, pct) %>%
  arrange(end_year) %>%
  mutate(pct_display = round(pct * 100, 1))

print(other_trend)
#> # A tibble: 4 x 4
#>   end_year n_students   pct pct_display
#>      <int>      <dbl> <dbl>       <dbl>
#> 1     2020      47263 0.093         9.3
#> 2     2021      47471 0.096         9.6
#> 3     2022      48371 0.098         9.8
#> 4     2023      49090 0.099         9.9