Fetch and analyze Delaware school enrollment data from the Delaware Department of Education in R or Python.
Part of the njschooldata family.
Full documentation – all 15 stories with interactive charts, getting-started guide, and complete function reference.
Highlights
library(deschooldata)
library(dplyr)
library(tidyr)
library(ggplot2)

theme_set(theme_minimal(base_size = 14))
1. Charter enrollment grew 65% while traditional districts grew 10%
Charter schools grew from 8,714 to 14,377 students (65% increase) while traditional district enrollment grew from 124,759 to 137,570 (10%).
enr <- fetch_enr_multi(2015:2024, use_cache = TRUE)

charter_trend <- enr |>
  filter(is_district, subgroup == "total_enrollment", grade_level == "TOTAL") |>
  group_by(end_year, is_charter) |>
  summarize(total = sum(n_students, na.rm = TRUE), .groups = "drop") |>
  mutate(sector = ifelse(is_charter, "Charter Schools", "Traditional Districts"))

stopifnot(nrow(charter_trend) > 0)
charter_trend
#> # A tibble: 20 x 4
#> end_year is_charter total sector
#> <dbl> <lgl> <dbl> <chr>
#> 1 2015 FALSE 124759 Traditional Districts
#> 2 2015 TRUE 8714 Charter Schools
#> 3 2016 FALSE 123646 Traditional Districts
#> 4 2016 TRUE 10739 Charter Schools
#> 5 2017 FALSE 123075 Traditional Districts
#> 6 2017 TRUE 11982 Charter Schools
#> 7 2018 FALSE 123573 Traditional Districts
#> 8 2018 TRUE 12717 Charter Schools
#> 9 2019 FALSE 124350 Traditional Districts
#> 10 2019 TRUE 12440 Charter Schools
#> 11 2020 FALSE 134768 Traditional Districts
#> 12 2020 TRUE 12904 Charter Schools
#> 13 2021 FALSE 131997 Traditional Districts
#> 14 2021 TRUE 13300 Charter Schools
#> 15 2022 FALSE 136543 Traditional Districts
#> 16 2022 TRUE 13320 Charter Schools
#> 17 2023 FALSE 137542 Traditional Districts
#> 18 2023 TRUE 14552 Charter Schools
#> 19 2024 FALSE 137570 Traditional Districts
#> 20 2024 TRUE 14377 Charter Schools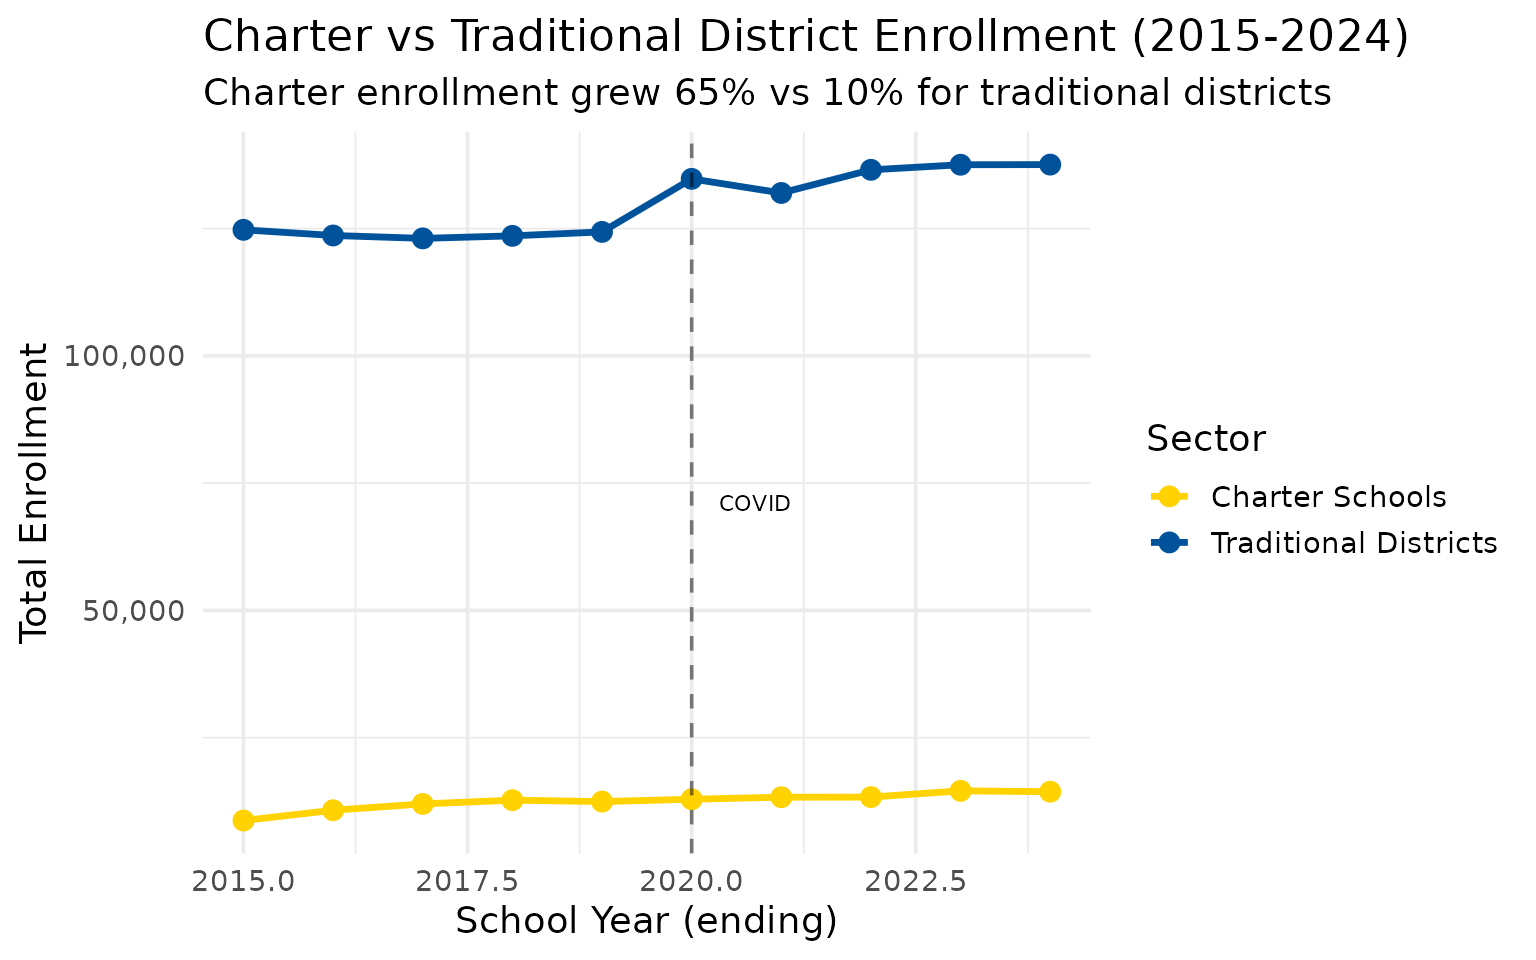
2. One in five Delaware students receives special education
Special education enrollment has grown from 16.5% to 21.5% of all students over the past decade, and English learners grew from 8.8% to 12.6%.
special_pops <- enr |>
  filter(is_state, grade_level == "TOTAL",
         subgroup %in% c("lep", "special_ed")) |>
  select(end_year, subgroup, n_students, pct) |>
  mutate(pct = round(pct * 100, 1))

stopifnot(nrow(special_pops) > 0)
special_pops
#> end_year subgroup n_students pct
#> 1 2015 special_ed 21361 16.5
#> 2 2015 lep 11354 8.8
#> 3 2016 special_ed 22349 17.1
#> 4 2016 lep 12248 9.4
#> 5 2017 special_ed 23351 17.7
#> 6 2017 lep 13451 10.2
#> 7 2018 special_ed 24440 18.4
#> 8 2018 lep 14342 10.8
#> 9 2019 special_ed 25614 19.2
#> 10 2019 lep 14717 11.0
#> 11 2020 special_ed 28621 19.8
#> 12 2020 lep 15295 10.6
#> 13 2021 special_ed 28889 20.2
#> 14 2021 lep 14650 10.2
#> 15 2022 special_ed 30145 20.6
#> 16 2022 lep 16189 11.1
#> 17 2023 special_ed 31071 20.9
#> 18 2023 lep 17171 11.6
#> 19 2024 special_ed 32138 21.5
#> 20 2024 lep 18774 12.6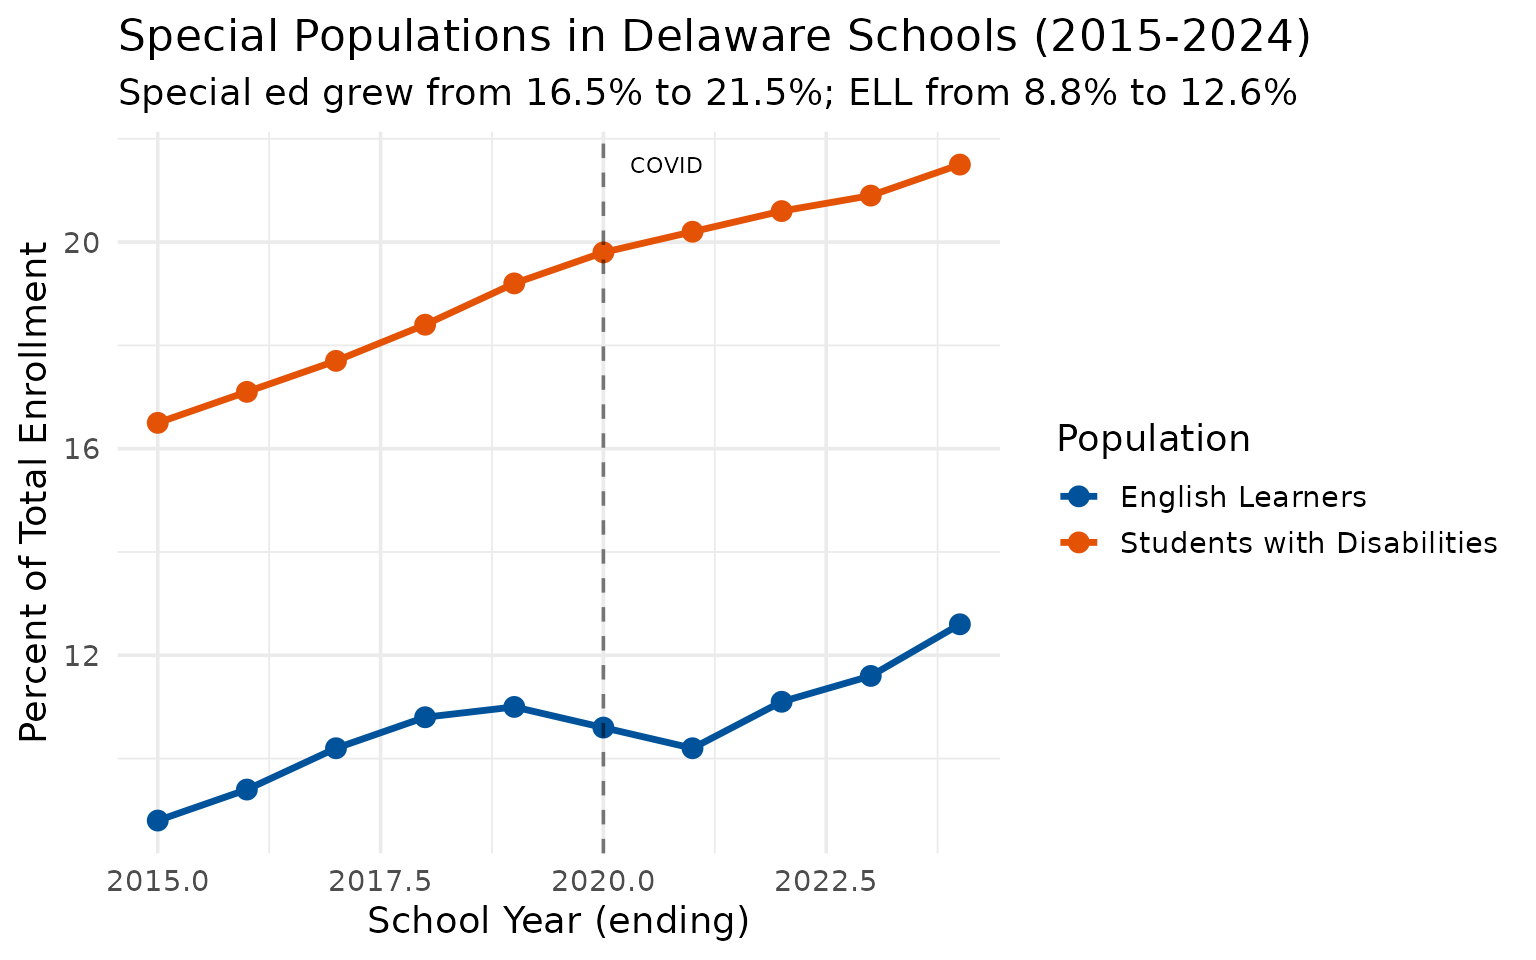
3. Delaware is remarkably diverse
No single racial group holds a majority. White students are the plurality at 38.4%, followed by Black (31.9%) and Hispanic (20.4%).
enr_2024 <- fetch_enr(2024, use_cache = TRUE)

demographics <- enr_2024 |>
  filter(is_state, grade_level == "TOTAL",
         subgroup %in% c("white", "black", "hispanic", "asian", "multiracial")) |>
  mutate(pct = round(pct * 100, 1)) |>
  select(subgroup, n_students, pct) |>
  arrange(desc(n_students))

stopifnot(nrow(demographics) > 0)
demographics
#> subgroup n_students pct
#> 1 white 57336 38.4
#> 2 black 47582 31.9
#> 3 hispanic 30395 20.4
#> 4 multiracial 8389 5.6
#> 5 asian 6865 4.6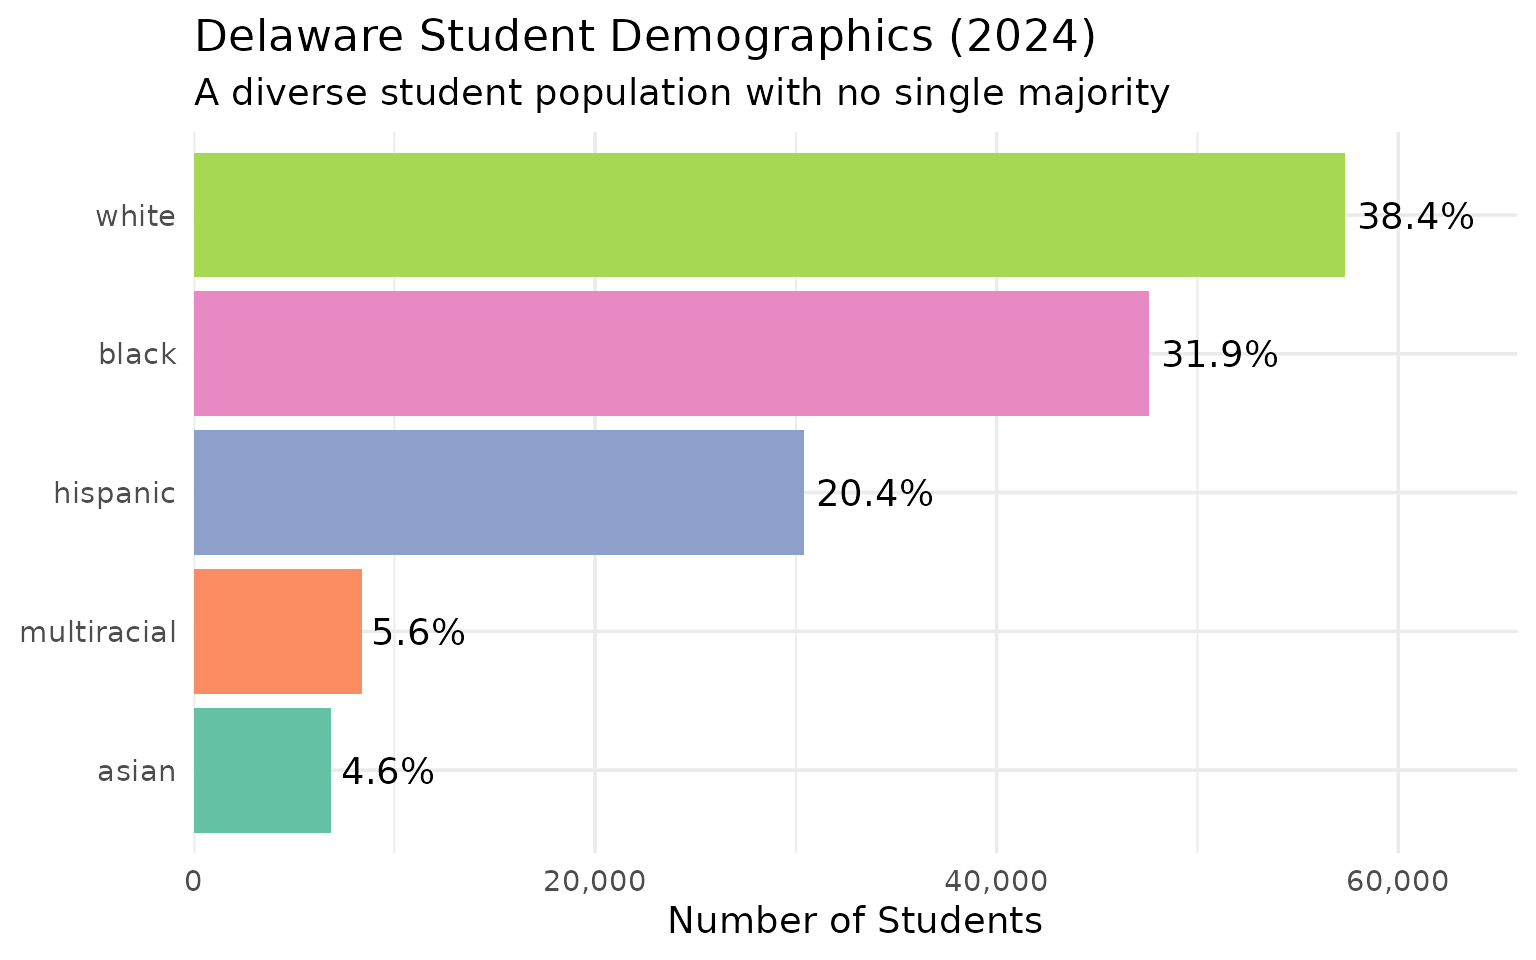
Data Taxonomy
| Category | Years | Function | Details |
|---|---|---|---|
| Enrollment | 2015-2024 |
fetch_enr() / fetch_enr_multi()
|
State, district, school. Race, gender, econ_disadv, SpEd, LEP |
| Assessments | – | – | Not yet available |
| Graduation | – | – | Not yet available |
| Directory | 2015-2025 |
fetch_directory() / fetch_directory_multi()
|
School name, address, coordinates, grades served |
| Per-Pupil Spending | – | – | Not yet available |
| Accountability | – | – | Not yet available |
| Chronic Absence | – | – | Not yet available |
| EL Progress | – | – | Not yet available |
| Special Ed | – | – | Not yet available |
See DATA-CATEGORY-TAXONOMY.md for what each category covers.
Quick Start
R
# install.packages("remotes")
remotes::install_github("almartin82/deschooldata")
library(deschooldata)
library(dplyr)

# Fetch one year
enr_2024 <- fetch_enr(2024, use_cache = TRUE)

# Fetch multiple years
enr_multi <- fetch_enr_multi(2020:2024, use_cache = TRUE)

# State totals
enr_2024 |>
  filter(is_state, subgroup == "total_enrollment", grade_level == "TOTAL")

# District breakdown
enr_2024 |>
  filter(is_district, subgroup == "total_enrollment", grade_level == "TOTAL") |>
  arrange(desc(n_students))

# Demographics
enr_2024 |>
  filter(is_state, grade_level == "TOTAL",
         subgroup %in% c("white", "black", "hispanic", "asian")) |>
  select(subgroup, n_students, pct)
Python
import pydeschooldata as de

# Fetch 2024 data (2023-24 school year)
enr = de.fetch_enr(2024)

# Statewide total
total = enr[(enr['is_state'] == True) & (enr['subgroup'] == 'total_enrollment') & (enr['grade_level'] == 'TOTAL')]['n_students'].sum()
print(f"{total:,} students")
#> 149,324 students

# Get multiple years
enr_multi = de.fetch_enr_multi([2020, 2021, 2022, 2023, 2024])

# Check available years
years = de.get_available_years()
print(f"Data available: {years['min_year']}-{years['max_year']}")
#> Data available: 2015-2024
Explore More
- Full documentation – all 15 stories
- Enrollment trends vignette – 15 stories
- Function reference
Data Notes
Source
Delaware Department of Education: Open Data Portal
What’s included
- Levels: State, district (~40 including charters), school (~220)
- Demographics: White, Black, Hispanic, Asian, American Indian, Pacific Islander, Multiracial
-
Special populations: Economically disadvantaged (
econ_disadv), English learners (lep), Students with disabilities (special_ed) - Grade levels: Pre-K through 12
Delaware ID system
- District codes: 10-35 for traditional districts
- Charter codes: 69-92 and 9604-9614
- School codes: 3-4 digits within each district
- State aggregate: districtcode = 0, schoolcode = 0
Caveats
- Small cell sizes are redacted for privacy (rows with
rowstatus = 'REDACTED'are excluded) - Pre-2015 data not available through the API
- The 2020 enrollment jump (+8.4%) may reflect methodology changes in addition to real enrollment changes
- State total comes from the API’s state-level aggregate row (districtcode=0), not from summing districts
Deeper Dive
4. Delaware added nearly 20,000 students in a decade
Statewide enrollment grew 15.2% from 129,573 to 149,324 between 2015 and 2024, bucking national enrollment decline trends.
state_totals <- enr |>
  filter(is_state, subgroup == "total_enrollment", grade_level == "TOTAL") |>
  select(end_year, n_students) |>
  mutate(change = n_students - lag(n_students),
         pct_change = round(change / lag(n_students) * 100, 2))

stopifnot(nrow(state_totals) > 0)
state_totals
#> end_year n_students change pct_change
#> 1 2015 129573 NA NA
#> 2 2016 130930 1357 1.05
#> 3 2017 131562 632 0.48
#> 4 2018 132482 920 0.70
#> 5 2019 133230 748 0.56
#> 6 2020 144402 11172 8.39
#> 7 2021 143086 -1316 -0.91
#> 8 2022 146267 3181 2.22
#> 9 2023 148494 2227 1.52
#> 10 2024 149324 830 0.56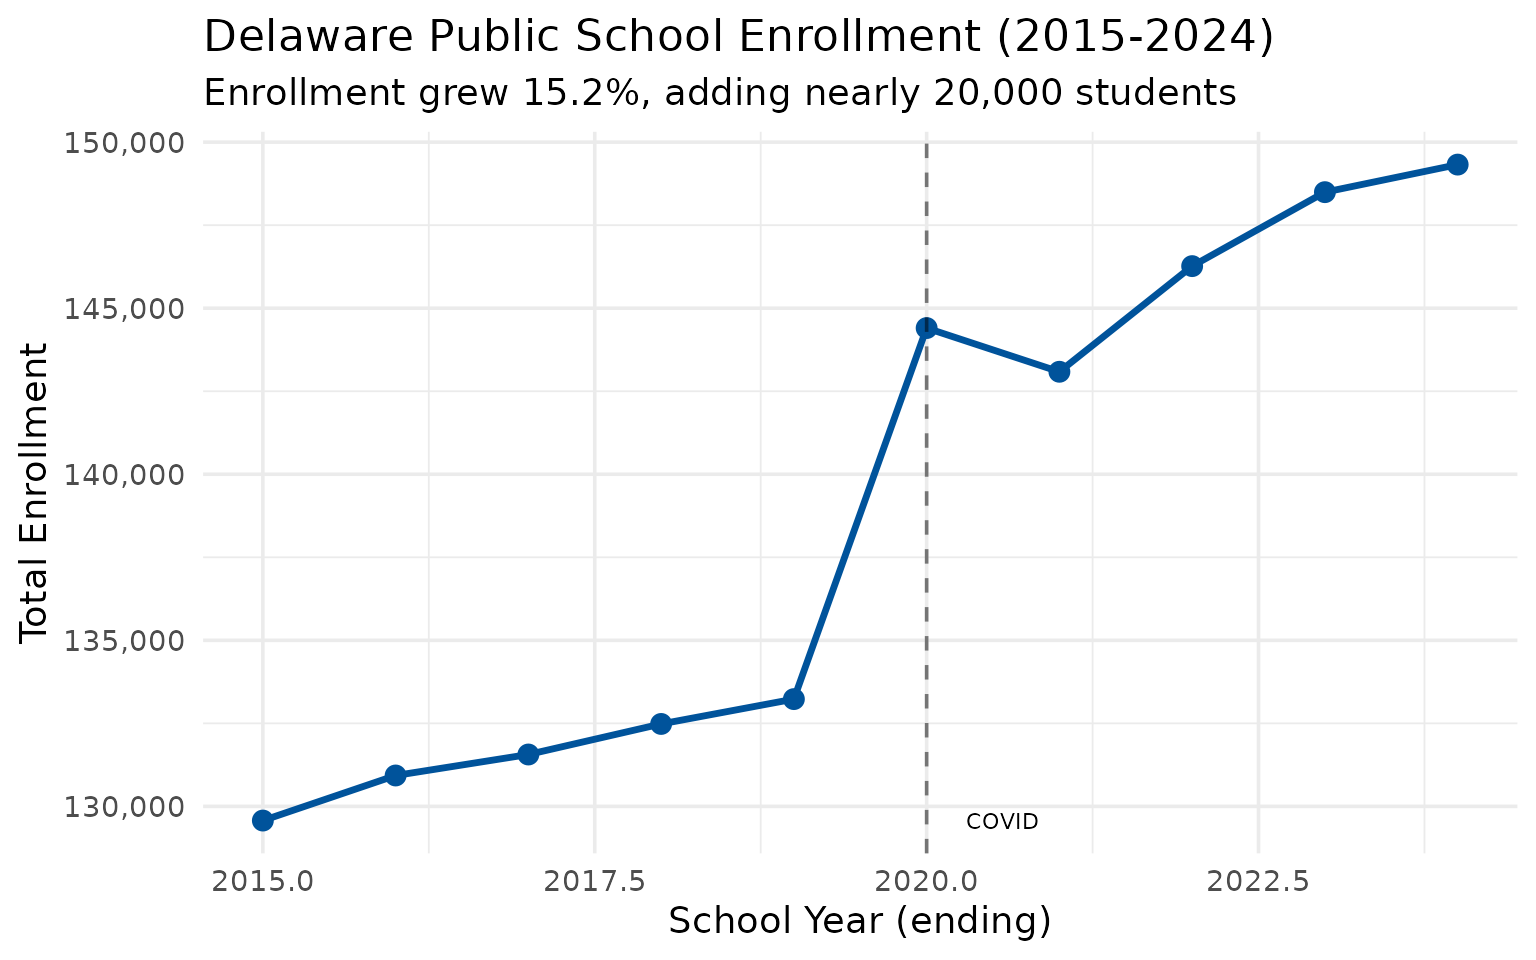
5. Charter schools now serve nearly 10% of Delaware students
Delaware was one of the first states to authorize charter schools (1995). Today 18 charter schools enroll about 14,400 students.
charter_summary <- enr_2024 |>
  filter(is_district, subgroup == "total_enrollment", grade_level == "TOTAL") |>
  group_by(is_charter) |>
  summarize(
    n_districts = n(),
    total_students = sum(n_students, na.rm = TRUE),
    .groups = "drop"
  ) |>
  mutate(pct = round(total_students / sum(total_students) * 100, 1))

stopifnot(nrow(charter_summary) == 2)
charter_summary
#> # A tibble: 2 x 4
#> is_charter n_districts total_students pct
#> <lgl> <int> <dbl> <dbl>
#> 1 FALSE 22 137570 90.5
#> 2 TRUE 18 14377 9.5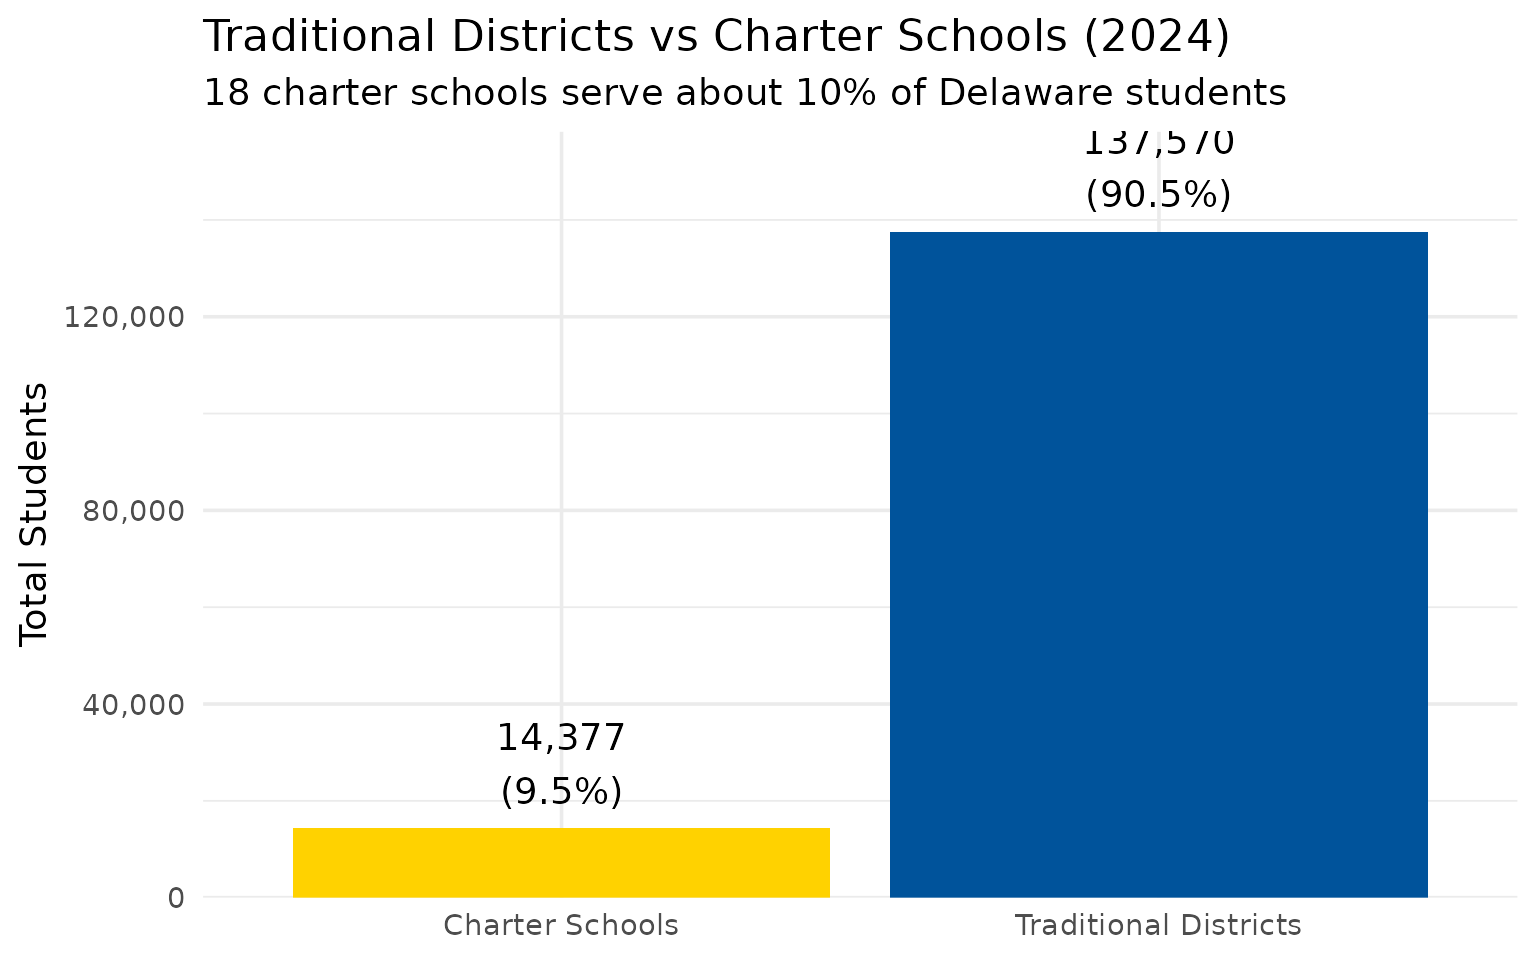
6. Red Clay Consolidated leads Delaware’s 40 districts
With 17,182 students, Red Clay Consolidated is the state’s largest district. The top 10 include both New Castle County giants and a charter school.
top_districts <- enr_2024 |>
  filter(is_district, subgroup == "total_enrollment", grade_level == "TOTAL") |>
  arrange(desc(n_students)) |>
  head(10) |>
  select(district_name, n_students, is_charter)

stopifnot(nrow(top_districts) == 10)
top_districts
#> district_name n_students is_charter
#> 1 Red Clay Consolidated School District 17182 FALSE
#> 2 Christina School District 14857 FALSE
#> 3 Appoquinimink School District 13604 FALSE
#> 4 Indian River School District 11445 FALSE
#> 5 Brandywine School District 11334 FALSE
#> 6 Colonial School District 9849 FALSE
#> 7 Caesar Rodney School District 8887 FALSE
#> 8 Capital School District 7367 FALSE
#> 9 Cape Henlopen School District 6997 FALSE
#> 10 Smyrna School District 6299 FALSE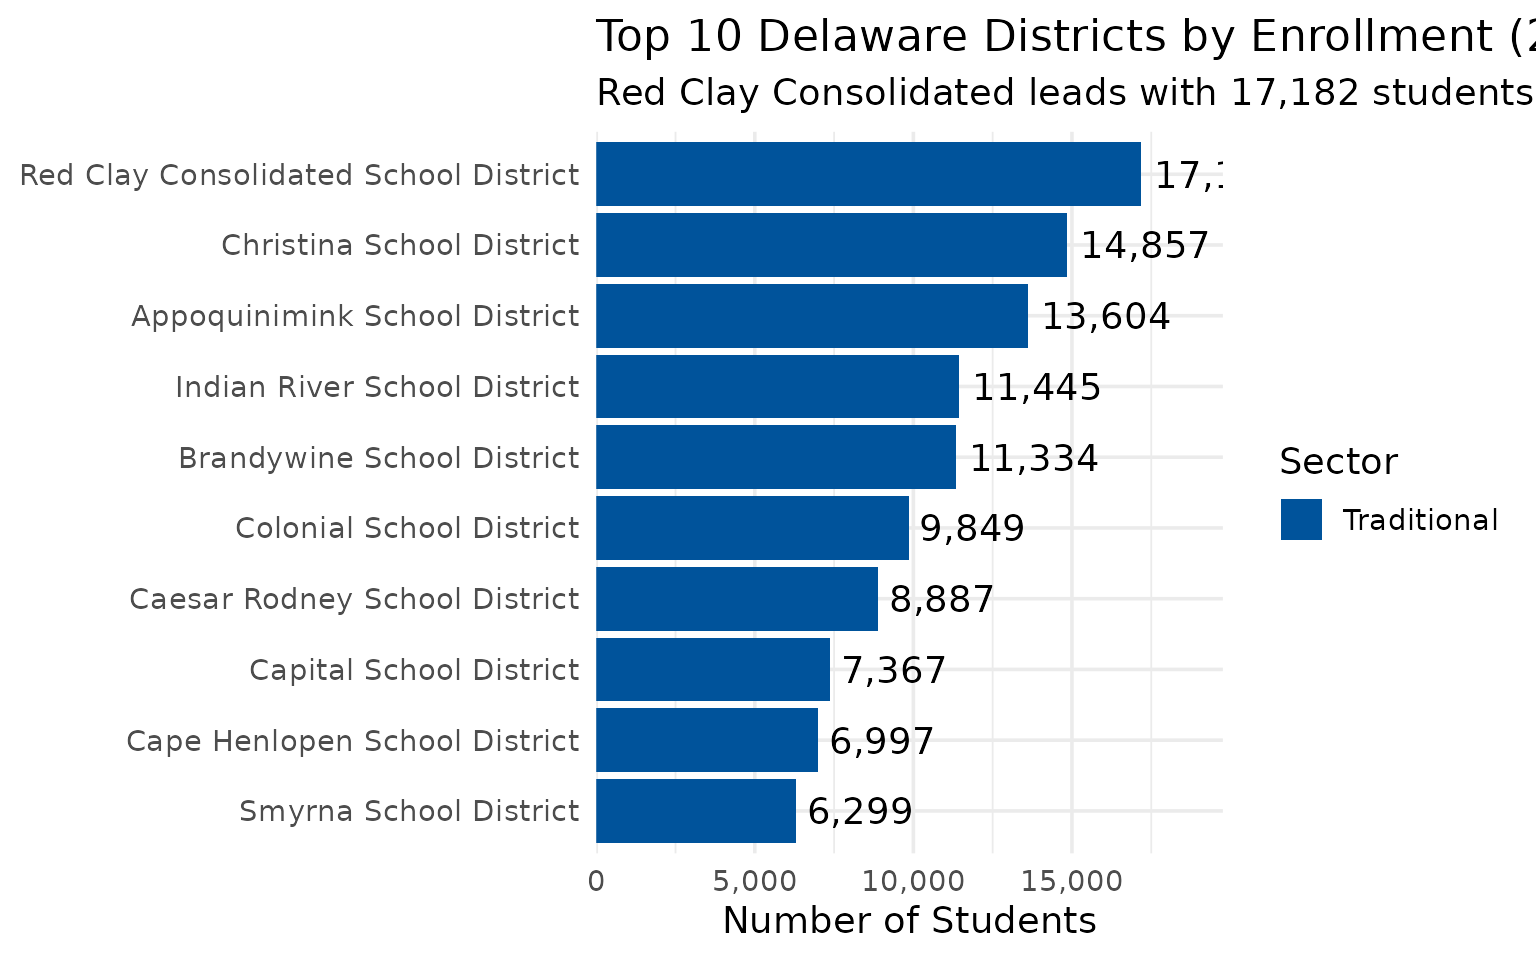
7. Hispanic enrollment grew from 17% to 20% in a decade
Hispanic students went from 21,902 (16.9%) in 2015 to 30,395 (20.4%) in 2024, an increase of nearly 8,500 students.
hispanic_trend <- enr |>
  filter(is_state, subgroup == "hispanic", grade_level == "TOTAL") |>
  mutate(pct = round(pct * 100, 1)) |>
  select(end_year, n_students, pct)

stopifnot(nrow(hispanic_trend) > 0)
hispanic_trend
#> end_year n_students pct
#> 1 2015 21902 16.9
#> 2 2016 23269 17.8
#> 3 2017 24604 18.7
#> 4 2018 25714 19.4
#> 5 2019 26313 19.8
#> 6 2020 26947 18.7
#> 7 2021 26882 18.8
#> 8 2022 28299 19.3
#> 9 2023 29245 19.7
#> 10 2024 30395 20.4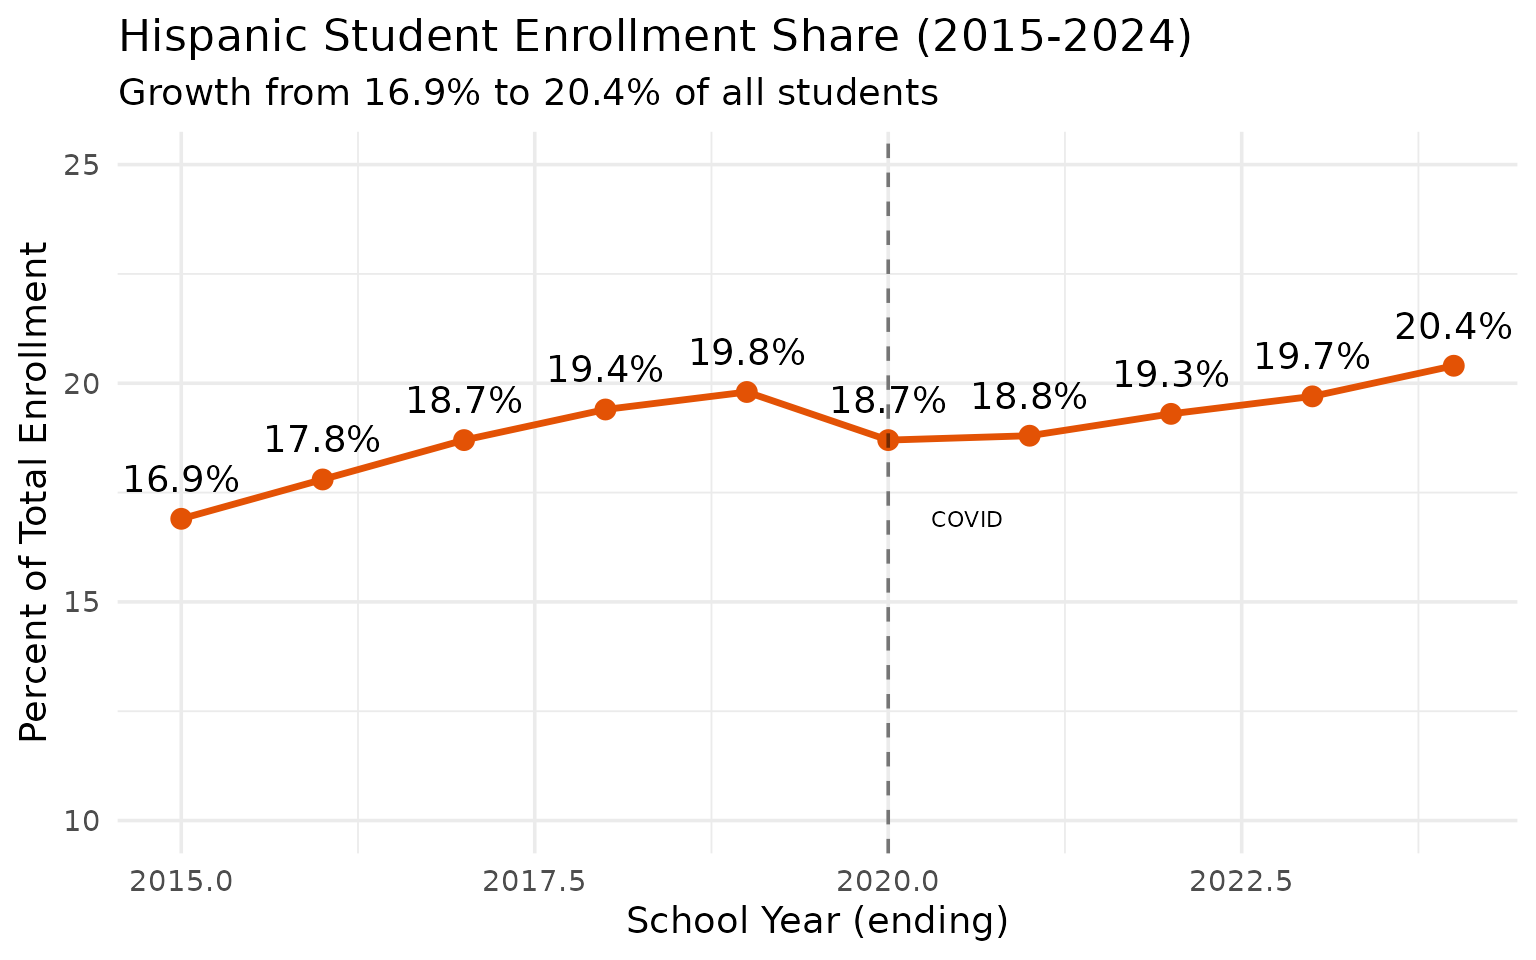
8. Christina School District lost nearly 2,000 students
Christina dropped from 16,761 to 14,857 students between 2015 and 2024, a decline of 11.4% even as the state grew.
christina <- enr |>
  filter(is_district, subgroup == "total_enrollment", grade_level == "TOTAL",
         grepl("Christina", district_name)) |>
  select(end_year, district_name, n_students) |>
  mutate(change = n_students - lag(n_students))

stopifnot(nrow(christina) > 0)
christina
#> end_year district_name n_students change
#> 1 2015 Christina School District 16761 NA
#> 2 2016 Christina School District 16202 -559
#> 3 2017 Christina School District 15586 -616
#> 4 2018 Christina School District 15539 -47
#> 5 2019 Christina School District 15102 -437
#> 6 2020 Christina School District 15357 255
#> 7 2021 Christina School District 14545 -812
#> 8 2022 Christina School District 15119 574
#> 9 2023 Christina School District 14841 -278
#> 10 2024 Christina School District 14857 16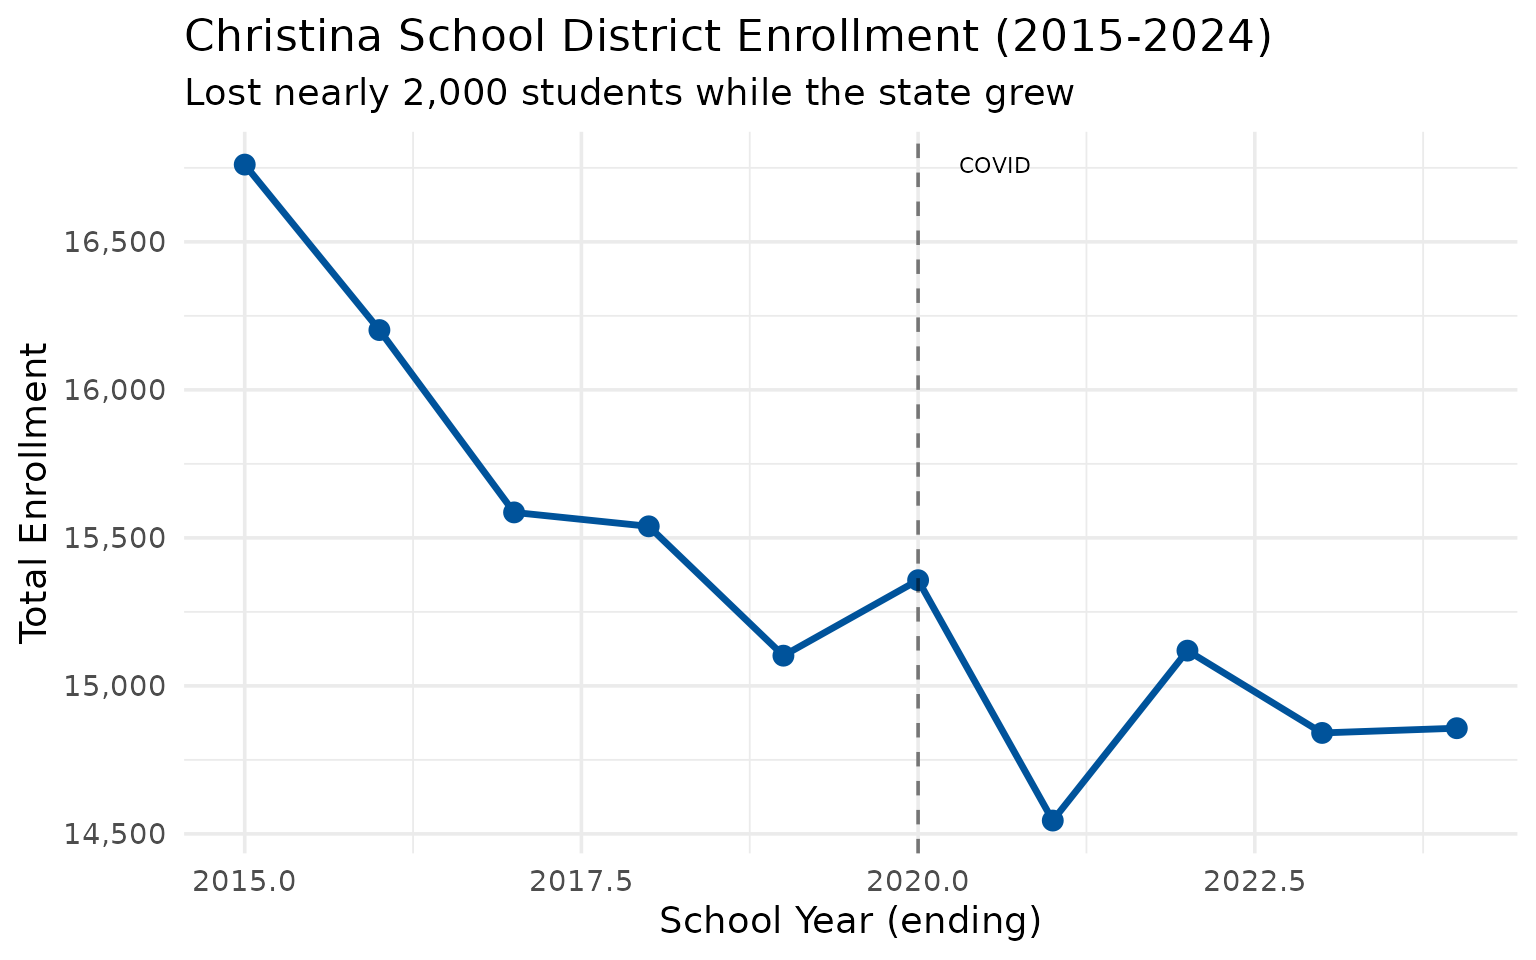
9. Kindergarten enrollment has softened
Delaware’s kindergarten enrollment dropped from 11,004 in 2015 to 10,582 in 2024, even as total enrollment grew. A potential early warning sign.
grade_trends <- enr |>
  filter(is_state, subgroup == "total_enrollment",
         grade_level %in% c("K", "01", "05", "09")) |>
  select(end_year, grade_level, n_students) |>
  pivot_wider(names_from = grade_level, values_from = n_students)

stopifnot(nrow(grade_trends) > 0)
grade_trends
#> # A tibble: 10 x 5
#> end_year K 01 05 09
#> <dbl> <dbl> <dbl> <dbl> <dbl>
#> 1 2015 11004 11376 10686 12500
#> 2 2016 10761 11201 10810 12554
#> 3 2017 10558 10851 11073 12433
#> 4 2018 10618 10716 11267 12630
#> 5 2019 10509 10841 11493 12771
#> 6 2020 10457 10582 11418 13009
#> 7 2021 10168 10339 11031 12778
#> 8 2022 10756 10361 11221 14164
#> 9 2023 10436 11026 11098 13744
#> 10 2024 10582 10536 11100 13624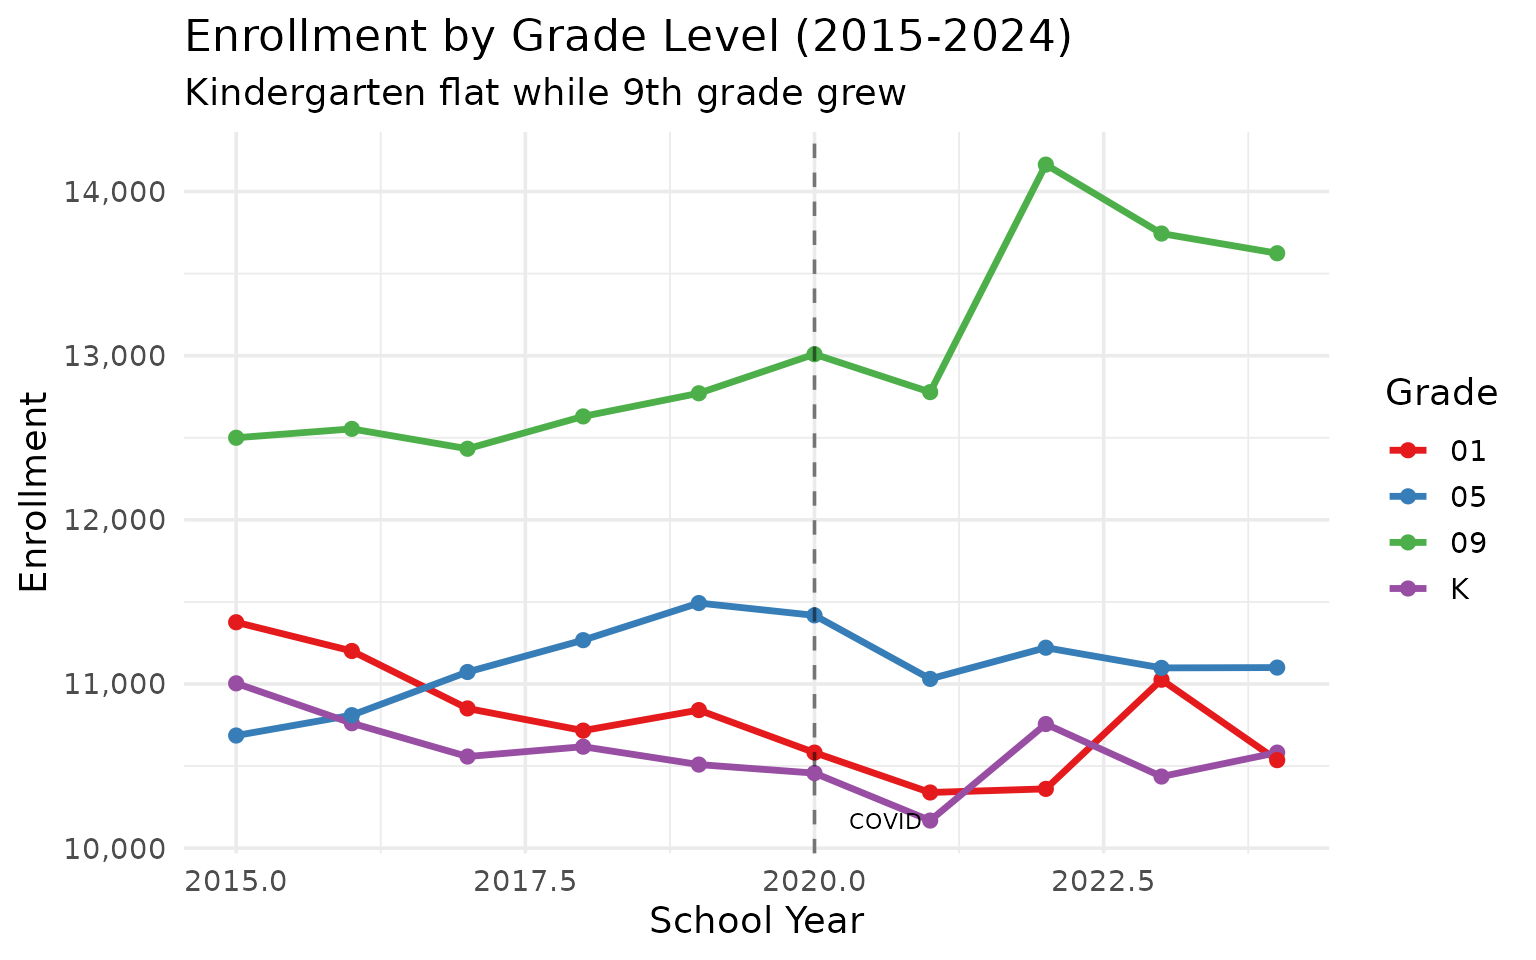
10. Appoquinimink is Delaware’s fastest-growing large district
Appoquinimink grew from 9,614 to 13,604 students (+41.5%), driven by suburban growth south of Wilmington.
appo <- enr |>
  filter(is_district, subgroup == "total_enrollment", grade_level == "TOTAL",
         grepl("Appoquinimink", district_name)) |>
  select(end_year, district_name, n_students) |>
  mutate(change = n_students - lag(n_students))

stopifnot(nrow(appo) > 0)
appo
#> end_year district_name n_students change
#> 1 2015 Appoquinimink School District 9614 NA
#> 2 2016 Appoquinimink School District 9989 375
#> 3 2017 Appoquinimink School District 10224 235
#> 4 2018 Appoquinimink School District 10470 246
#> 5 2019 Appoquinimink School District 10827 357
#> 6 2020 Appoquinimink School District 12058 1231
#> 7 2021 Appoquinimink School District 12298 240
#> 8 2022 Appoquinimink School District 12953 655
#> 9 2023 Appoquinimink School District 13536 583
#> 10 2024 Appoquinimink School District 13604 68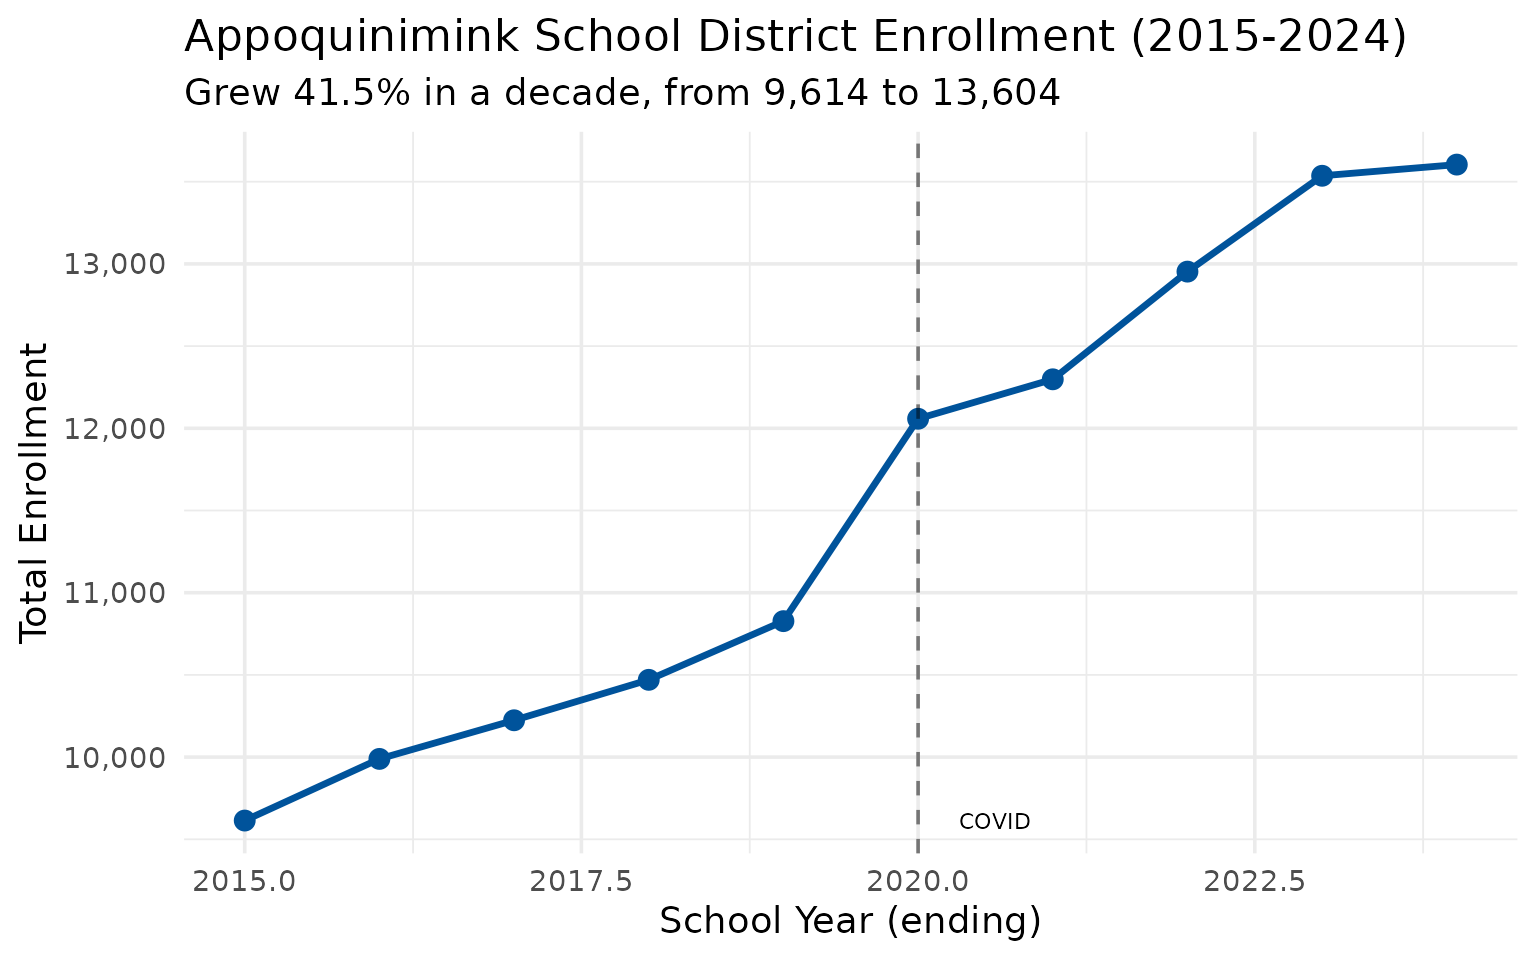
11. Sussex County schools are booming
Southern Delaware’s Sussex County districts have grown faster than the rest of the state, led by Cape Henlopen (+41%) and Indian River (+18%).
sussex_districts <- enr |>
  filter(is_district, subgroup == "total_enrollment", grade_level == "TOTAL",
         grepl("Sussex|Cape Henlopen|Indian River", district_name)) |>
  group_by(district_name) |>
  filter(n() > 5) |>
  summarize(
    earliest = n_students[end_year == min(end_year)],
    latest = n_students[end_year == max(end_year)],
    pct_change = round((latest / earliest - 1) * 100, 1),
    .groups = "drop"
  ) |>
  arrange(desc(pct_change))

stopifnot(nrow(sussex_districts) > 0)
sussex_districts
#> # A tibble: 4 x 4
#> district_name earliest latest pct_change
#> <chr> <dbl> <dbl> <dbl>
#> 1 Sussex Academy 609 1181 93.9
#> 2 Cape Henlopen School District 4960 6997 41.1
#> 3 Indian River School District 9684 11445 18.2
#> 4 Sussex Technical School District 1289 980 -24.012. Wilmington-area districts serve more low-income students
The four largest New Castle County districts – Christina, Red Clay, Colonial, and Brandywine – all have substantial economically disadvantaged populations, ranging from 29% to 40%.
wilmington_area <- enr_2024 |>
  filter(is_district, grade_level == "TOTAL",
         grepl("Brandywine|Red Clay|Christina|Colonial", district_name),
         subgroup %in% c("total_enrollment", "econ_disadv")) |>
  select(district_name, subgroup, n_students, pct) |>
  pivot_wider(names_from = subgroup, values_from = c(n_students, pct))

stopifnot(nrow(wilmington_area) > 0)
wilmington_area
#> # A tibble: 4 x 5
#> district_name n_students_total_enrollment n_students_econ_disadv pct_total_enrollment pct_econ_disadv
#> <chr> <dbl> <dbl> <dbl> <dbl>
#> 1 Brandywine School District 11334 3330 1 0.294
#> 2 Red Clay Consolidated School District 17182 5538 1 0.322
#> 3 Christina School District 14857 5975 1 0.402
#> 4 Colonial School District 9849 3820 1 0.388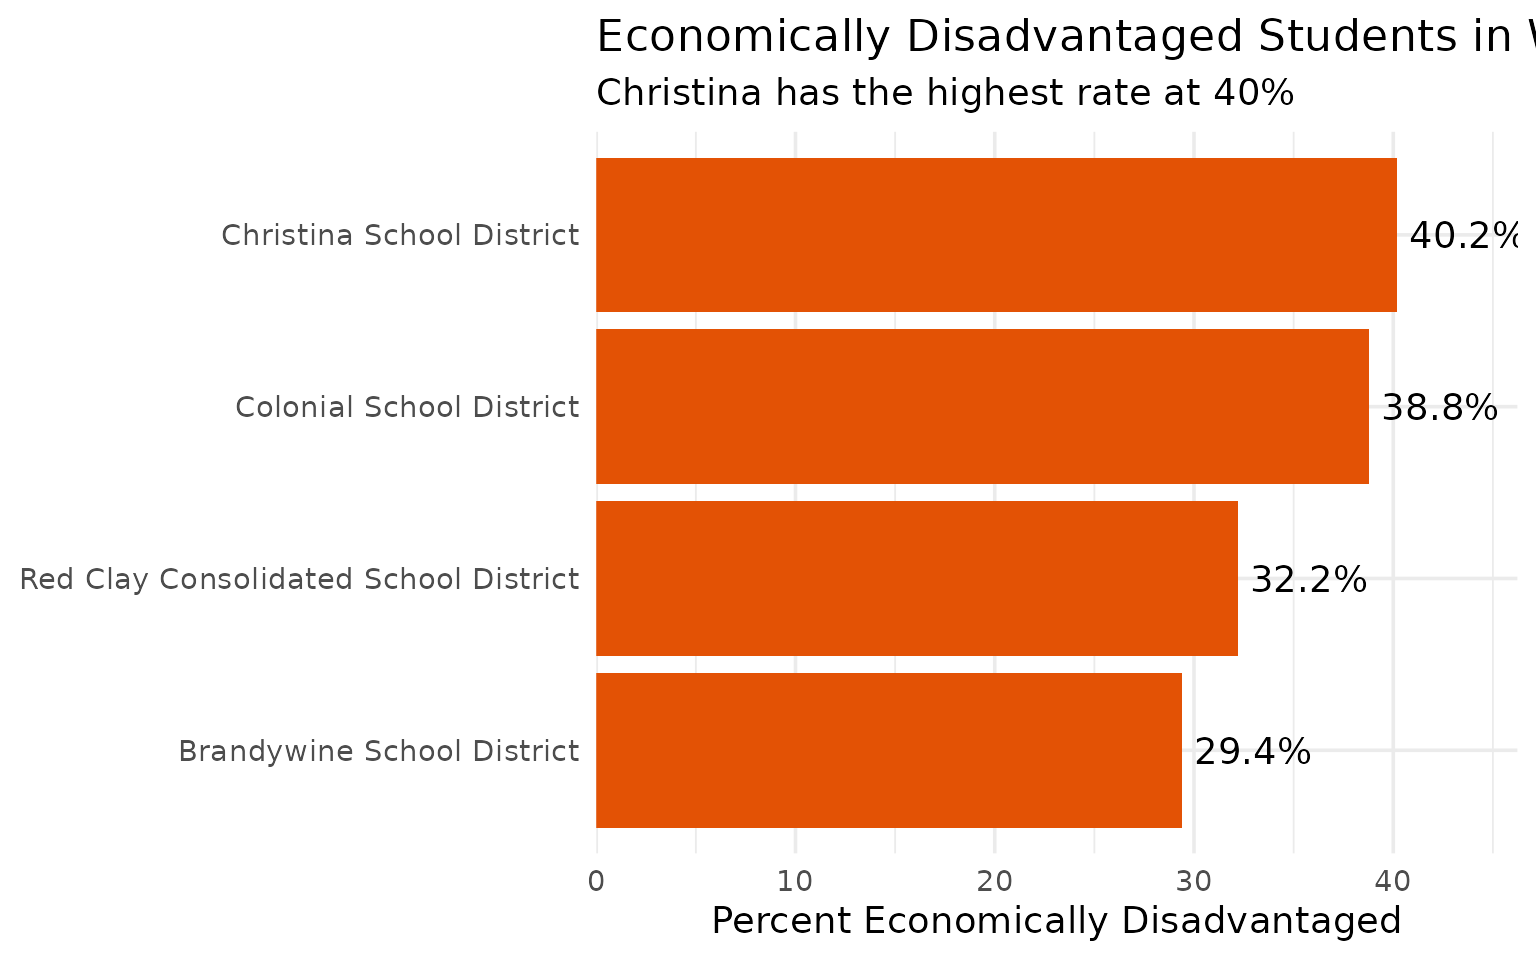
13. Brandywine holds steady while neighbors shrink
Brandywine School District has maintained relatively stable enrollment around 10,200-11,300 while Christina lost nearly 2,000 students.
brandywine <- enr |>
  filter(is_district, subgroup == "total_enrollment", grade_level == "TOTAL",
         grepl("Brandywine", district_name)) |>
  select(end_year, district_name, n_students) |>
  mutate(change = n_students - lag(n_students),
         pct_change = round(change / lag(n_students) * 100, 1))

stopifnot(nrow(brandywine) > 0)
brandywine
#> end_year district_name n_students change pct_change
#> 1 2015 Brandywine School District 10539 NA NA
#> 2 2016 Brandywine School District 10487 -52 -0.5
#> 3 2017 Brandywine School District 10176 -311 -3.0
#> 4 2018 Brandywine School District 10200 24 0.2
#> 5 2019 Brandywine School District 10217 17 0.2
#> 6 2020 Brandywine School District 11457 1240 12.1
#> 7 2021 Brandywine School District 10859 -598 -5.2
#> 8 2022 Brandywine School District 11081 222 2.0
#> 9 2023 Brandywine School District 11359 278 2.5
#> 10 2024 Brandywine School District 11334 -25 -0.2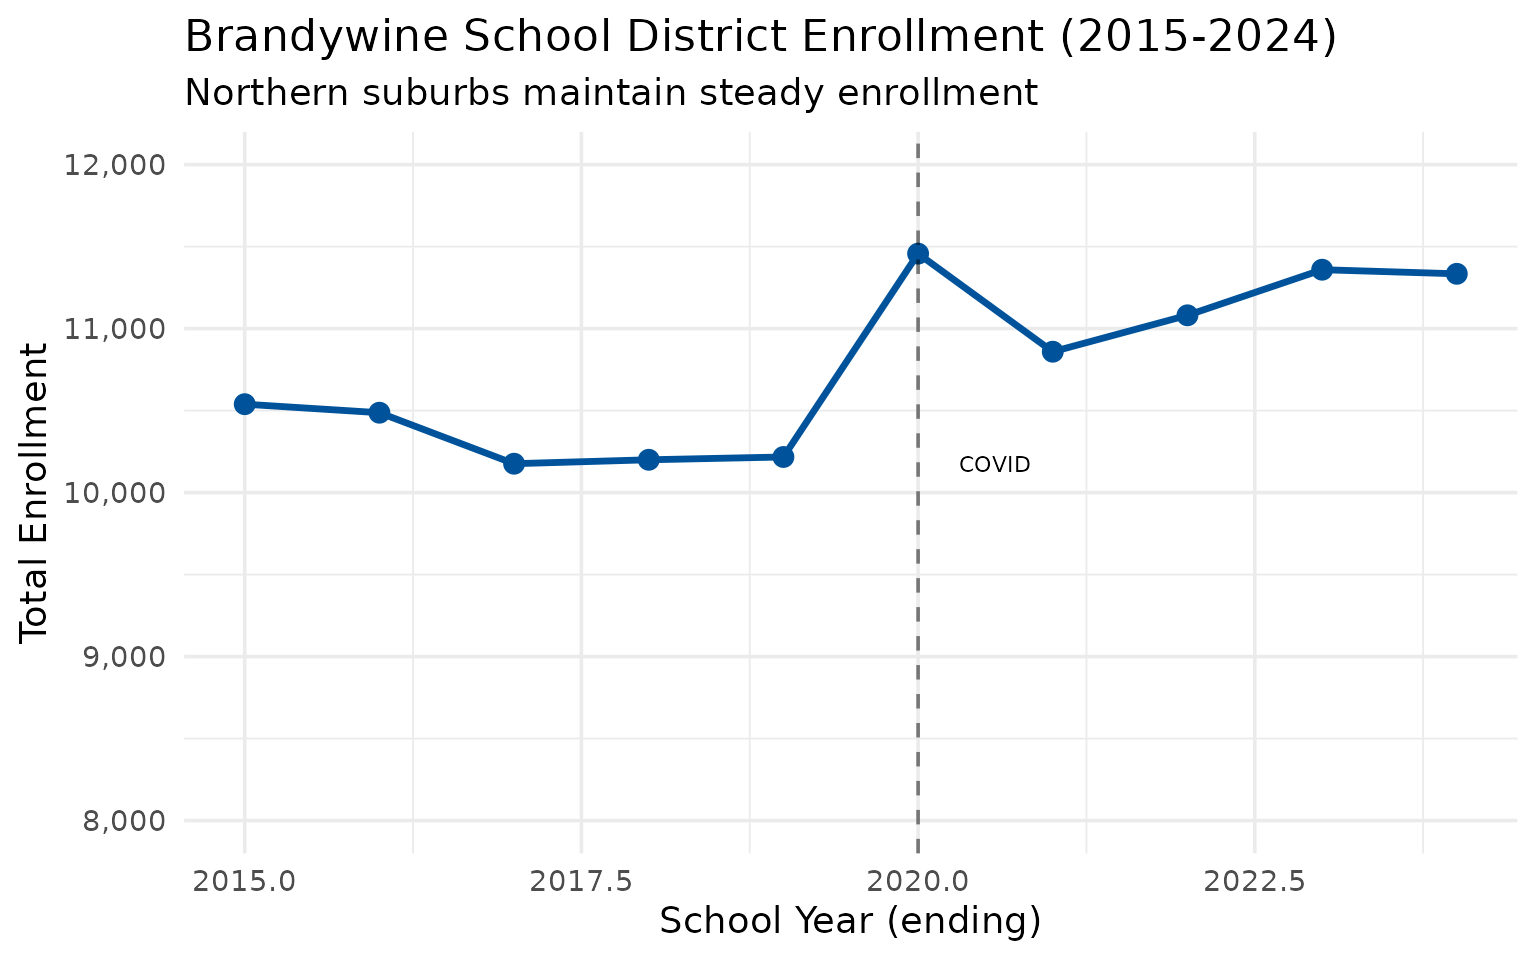
14. Black student share is declining even as numbers rise
Black student enrollment actually grew from 44,700 to 47,582 (+6.4%), but their share of total enrollment fell from 34.5% to 31.9% as Hispanic and other groups grew faster.
black_trend <- enr |>
  filter(is_state, subgroup == "black", grade_level == "TOTAL") |>
  mutate(pct = round(pct * 100, 1)) |>
  select(end_year, n_students, pct)

stopifnot(nrow(black_trend) > 0)
black_trend
#> end_year n_students pct
#> 1 2015 44700 34.5
#> 2 2016 44644 34.1
#> 3 2017 44603 33.9
#> 4 2018 44970 33.9
#> 5 2019 45112 33.9
#> 6 2020 45227 31.3
#> 7 2021 44708 31.2
#> 8 2022 46822 32.0
#> 9 2023 47108 31.7
#> 10 2024 47582 31.9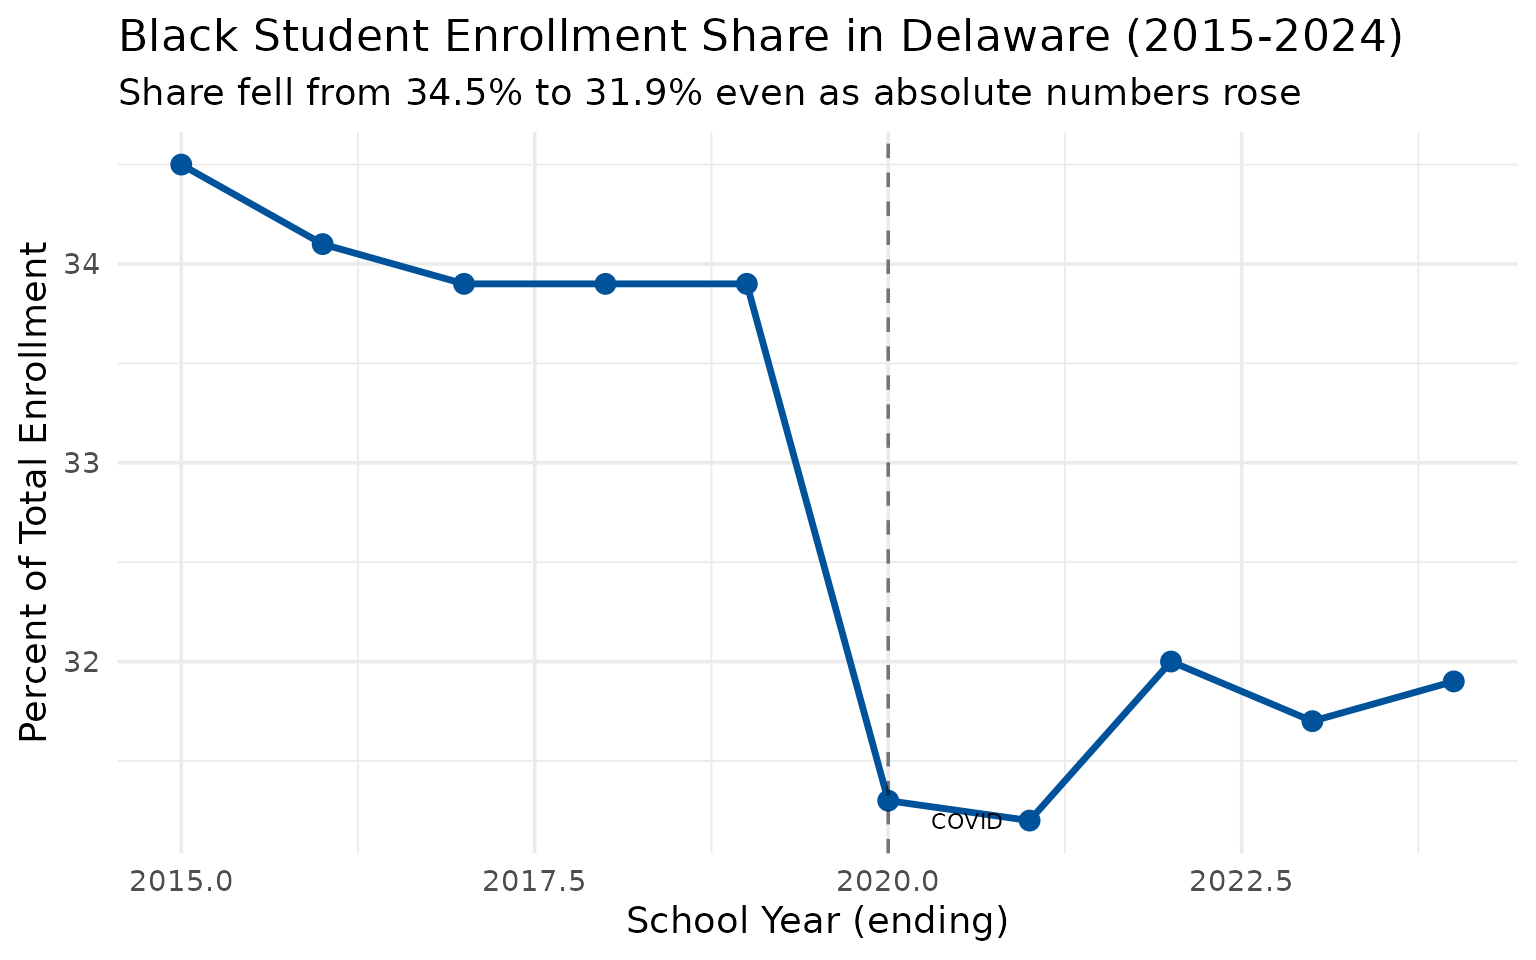
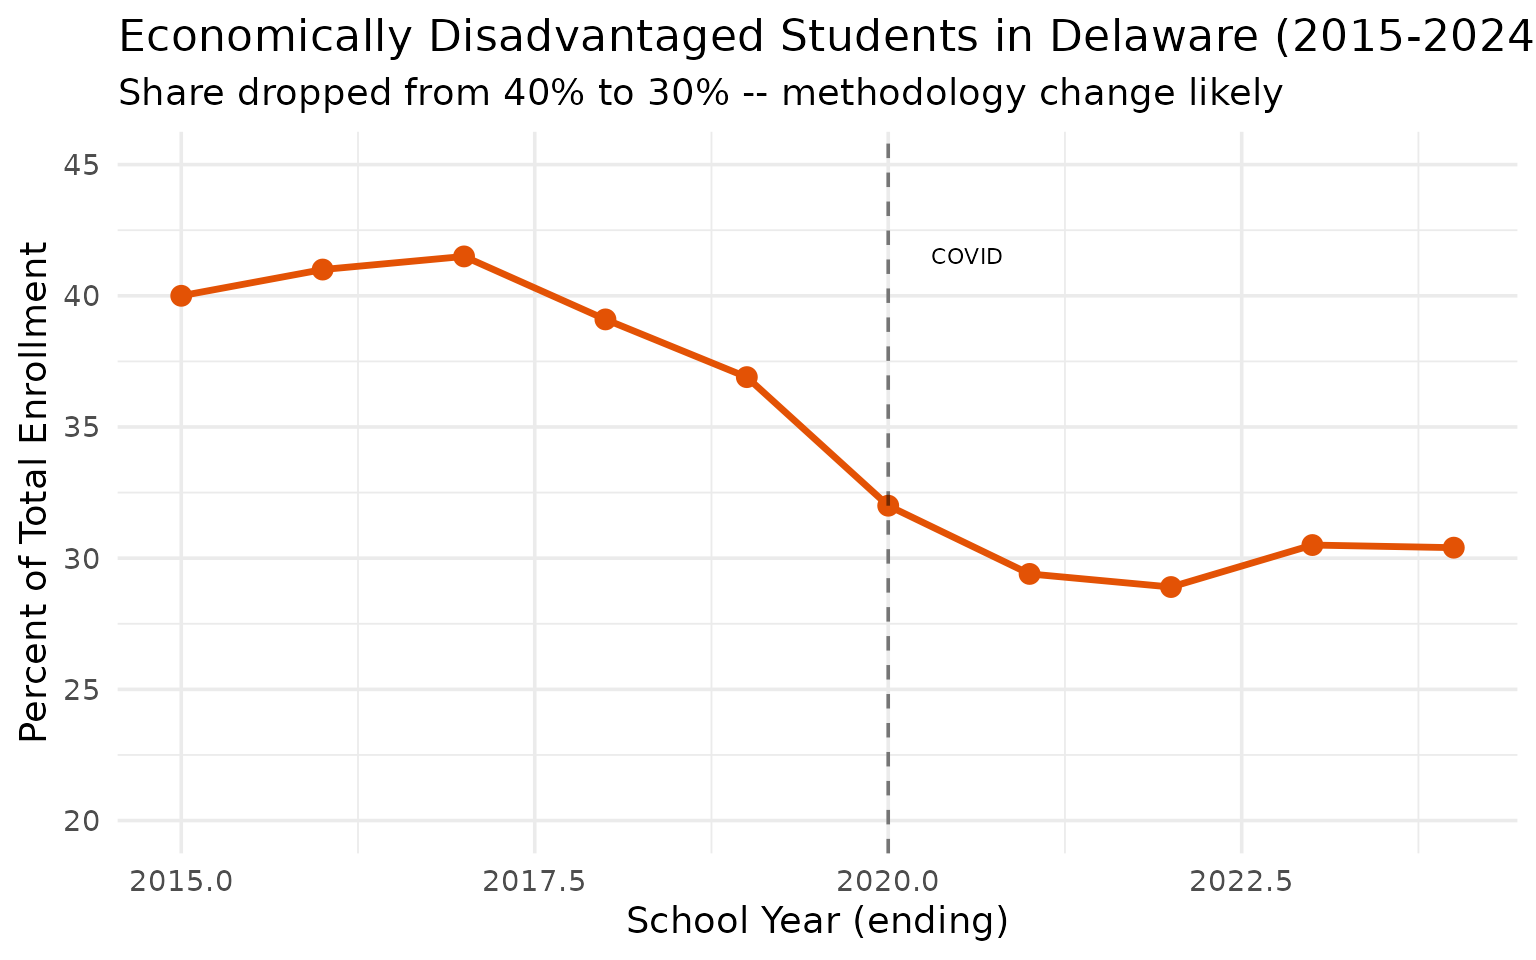
15. Economically disadvantaged share dropped from 40% to 30%
The share of students classified as economically disadvantaged fell from 40.0% in 2015 to 30.4% in 2024. This may reflect changes in reporting methodology rather than actual income gains.
econ_trend <- enr |>
  filter(is_state, grade_level == "TOTAL", subgroup == "econ_disadv") |>
  mutate(pct = round(pct * 100, 1)) |>
  select(end_year, n_students, pct)

stopifnot(nrow(econ_trend) > 0)
econ_trend
#> end_year n_students pct
#> 1 2015 51854 40.0
#> 2 2016 53712 41.0
#> 3 2017 54564 41.5
#> 4 2018 51759 39.1
#> 5 2019 49102 36.9
#> 6 2020 46186 32.0
#> 7 2021 42138 29.4
#> 8 2022 42250 28.9
#> 9 2023 45255 30.5
#> 10 2024 45467 30.4