Fetch and analyze Illinois school enrollment and assessment data from the Illinois State Board of Education (ISBE) in R or Python. 28 years of enrollment data (1997-2025). 19 years of assessment data (2006-2025). 1.85 million students today. Over 860 districts.
Part of the njschooldata family.
Full documentation — all 21 stories with interactive charts, getting-started guide, and complete function reference.
Highlights
library(ilschooldata)
library(dplyr)
library(tidyr)
library(ggplot2)
library(scales)
library(purrr)

theme_set(theme_minimal(base_size = 12))

# Fetch multi-year data spanning 26 years
key_years <- c(1999, 2005, 2010, 2015, 2017, 2019:2025)
all_enr <- map_df(key_years, ~fetch_enr(.x, use_cache = TRUE))

# Most recent year for demographic analysis
enr_2025 <- all_enr %>% filter(end_year == 2025)
enr_2019 <- all_enr %>% filter(end_year == 2019)
1. The COVID Cliff That Never Recovered
2020-2021 saw nearly 100,000 students disappear from Illinois schools. Five years later, the state is still down 136,000.
covid_impact <- all_enr %>%
  filter(
    is_state,
    subgroup == "total_enrollment",
    grade_level == "TOTAL",
    end_year >= 2019
  ) %>%
  select(end_year, n_students) %>%
  distinct() %>%
  mutate(
    change_from_2019 = n_students - n_students[end_year == 2019],
    pct_from_2019 = change_from_2019 / n_students[end_year == 2019] * 100
  )

stopifnot(nrow(covid_impact) > 0)
print(covid_impact)
#>   end_year n_students change_from_2019 pct_from_2019
#> 1     2019    1984519                0           0.0
#> 2     2020    1957018           -27501          -1.4
#> 3     2021    1887316           -97203          -4.9
#> 4     2022    1869325          -115194          -5.8
#> 5     2023    1857790          -126729          -6.4
#> 6     2024    1851290          -133229          -6.7
#> 7     2025    1848560          -135959          -6.9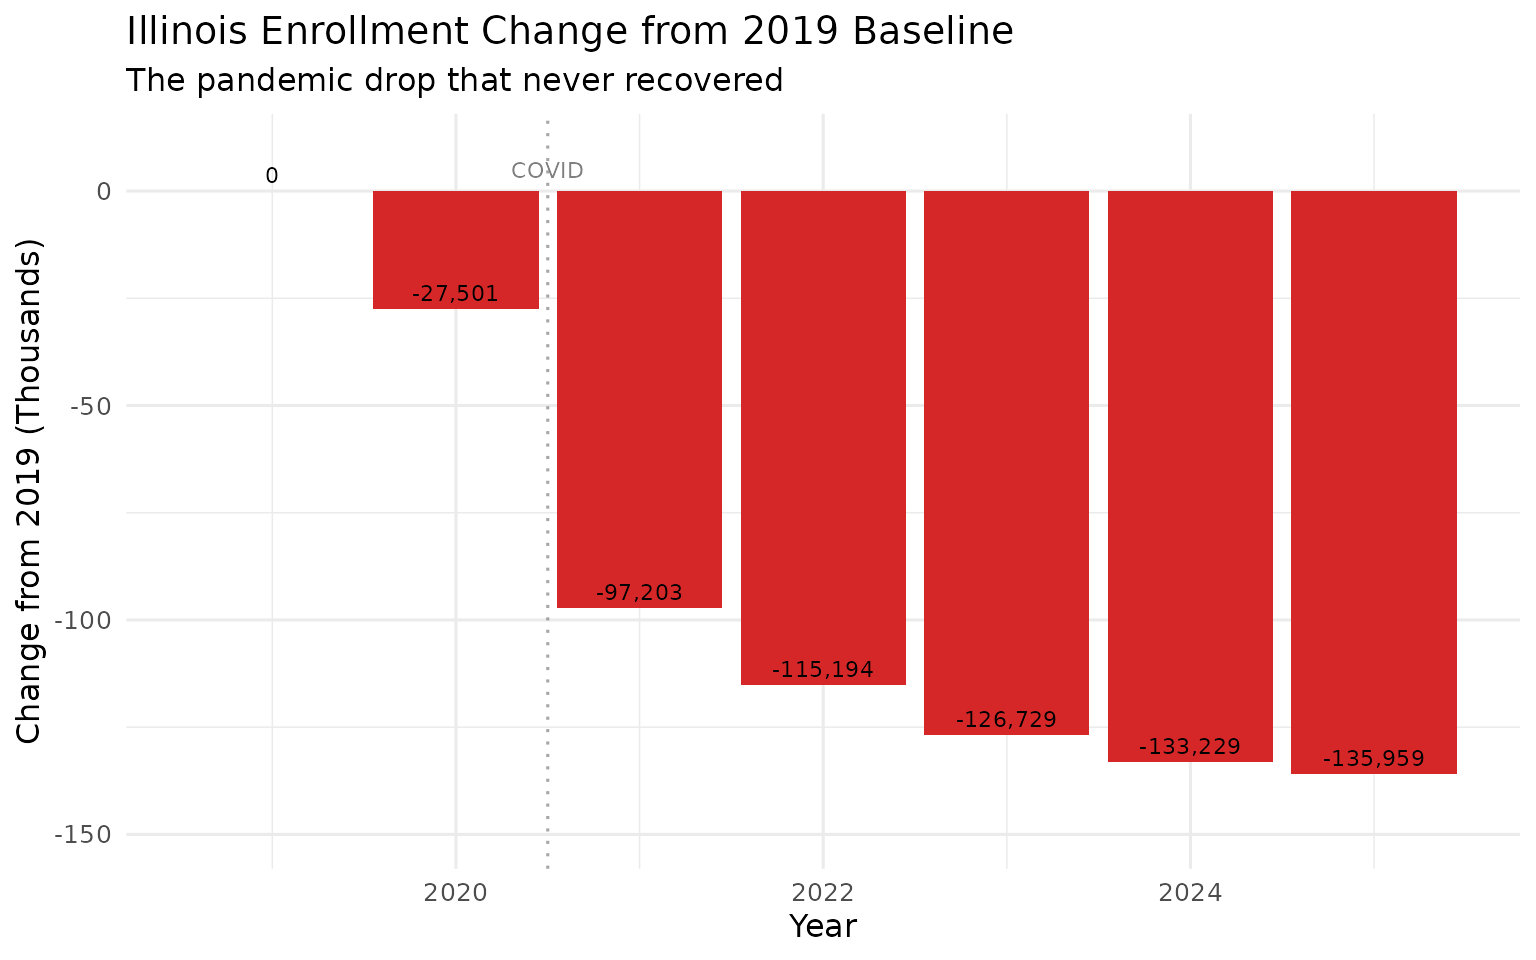
2. The ELL Explosion—English Learners Up 35%
While overall enrollment declines, English Language Learners have surged 35% since 2019—adding 83,000 students. Immigration is transforming Illinois schools.
ell_trend <- all_enr %>%
  filter(
    is_state,
    grade_level == "TOTAL",
    subgroup == "lep",
    end_year >= 2019
  ) %>%
  select(end_year, n_students) %>%
  distinct()

stopifnot(nrow(ell_trend) > 0)

ell_change <- ell_trend %>%
  mutate(
    change = n_students - n_students[end_year == 2019],
    pct_change = change / n_students[end_year == 2019] * 100
  )

print(ell_change)
#>   end_year n_students change pct_change
#> 1     2019     240127      0        0.0
#> 2     2020     244627   4500        1.9
#> 3     2021     243464   3337        1.4
#> 4     2022     256098  15971        6.7
#> 5     2023     271237  31110       13.0
#> 6     2024     303612  63485       26.4
#> 7     2025     323498  83371       34.7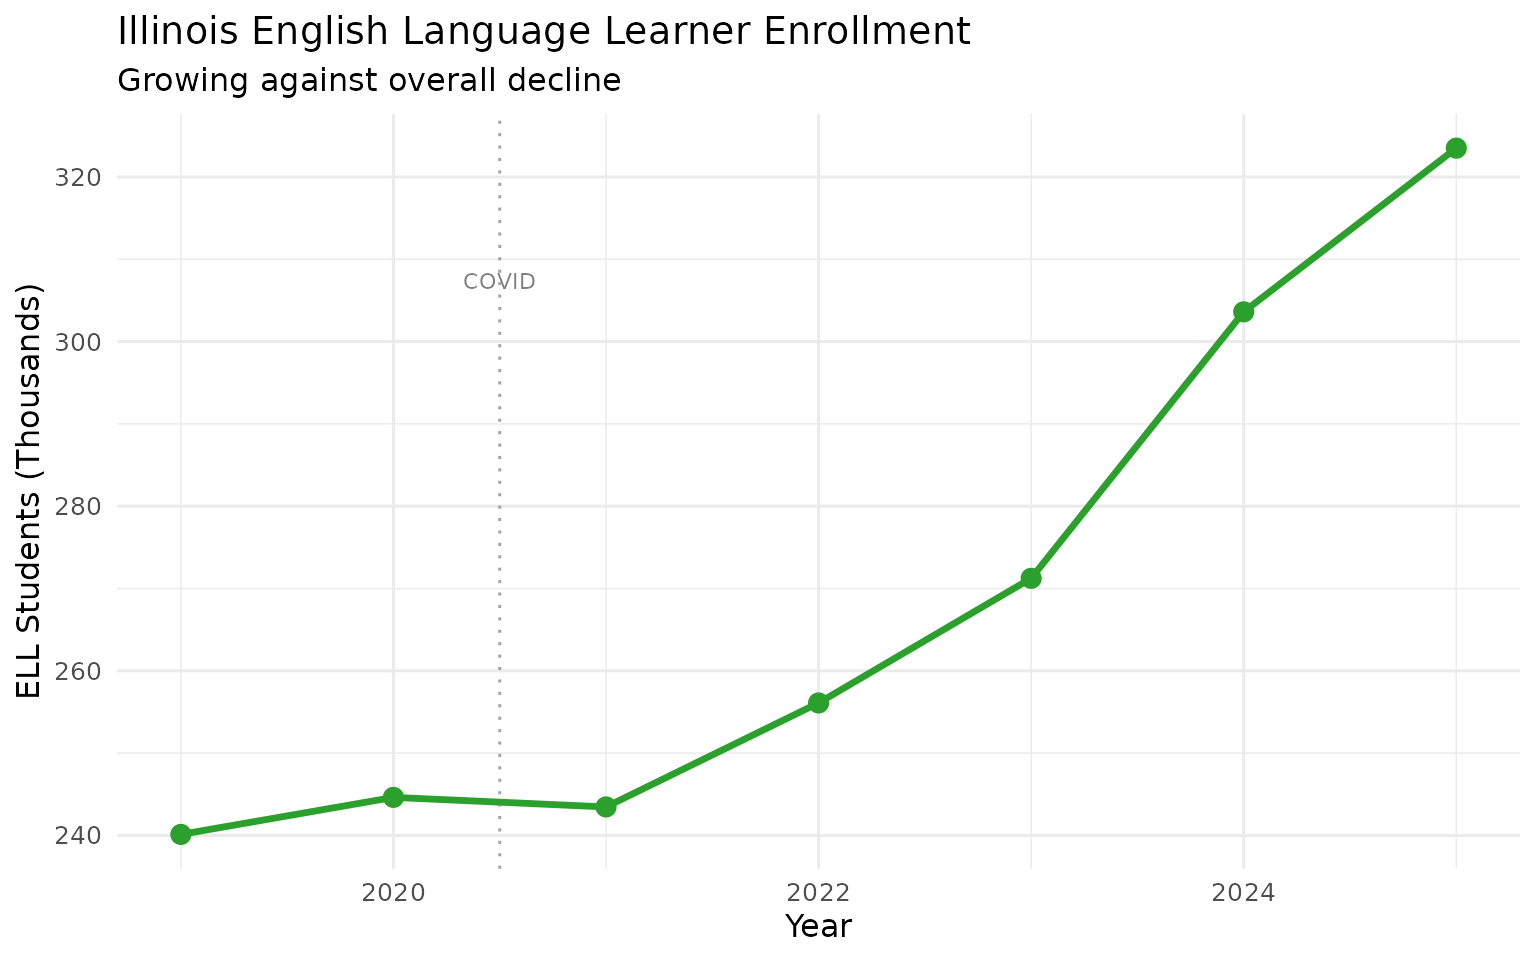
3. District Proficiency Ranges from 0% to Over 90%
Illinois districts show enormous variation in assessment outcomes, reflecting the state’s economic and demographic diversity.
# Get 2017 assessment data
assess_2017 <- fetch_assessment(2017, use_cache = TRUE)

# ELA proficiency range across districts
ela_districts <- assess_2017 %>%
  filter(is_district, subject == "ELA")

ela_summary <- ela_districts %>%
  summarize(
    n_districts = n(),
    min_proficiency = min(pct_proficient, na.rm = TRUE),
    median_proficiency = median(pct_proficient, na.rm = TRUE),
    mean_proficiency = mean(pct_proficient, na.rm = TRUE),
    max_proficiency = max(pct_proficient, na.rm = TRUE)
  )

stopifnot(nrow(ela_summary) > 0)
print(ela_summary)
#>   n_districts min_proficiency median_proficiency mean_proficiency max_proficiency
#> 1         712               0               36.2             37.7           92.3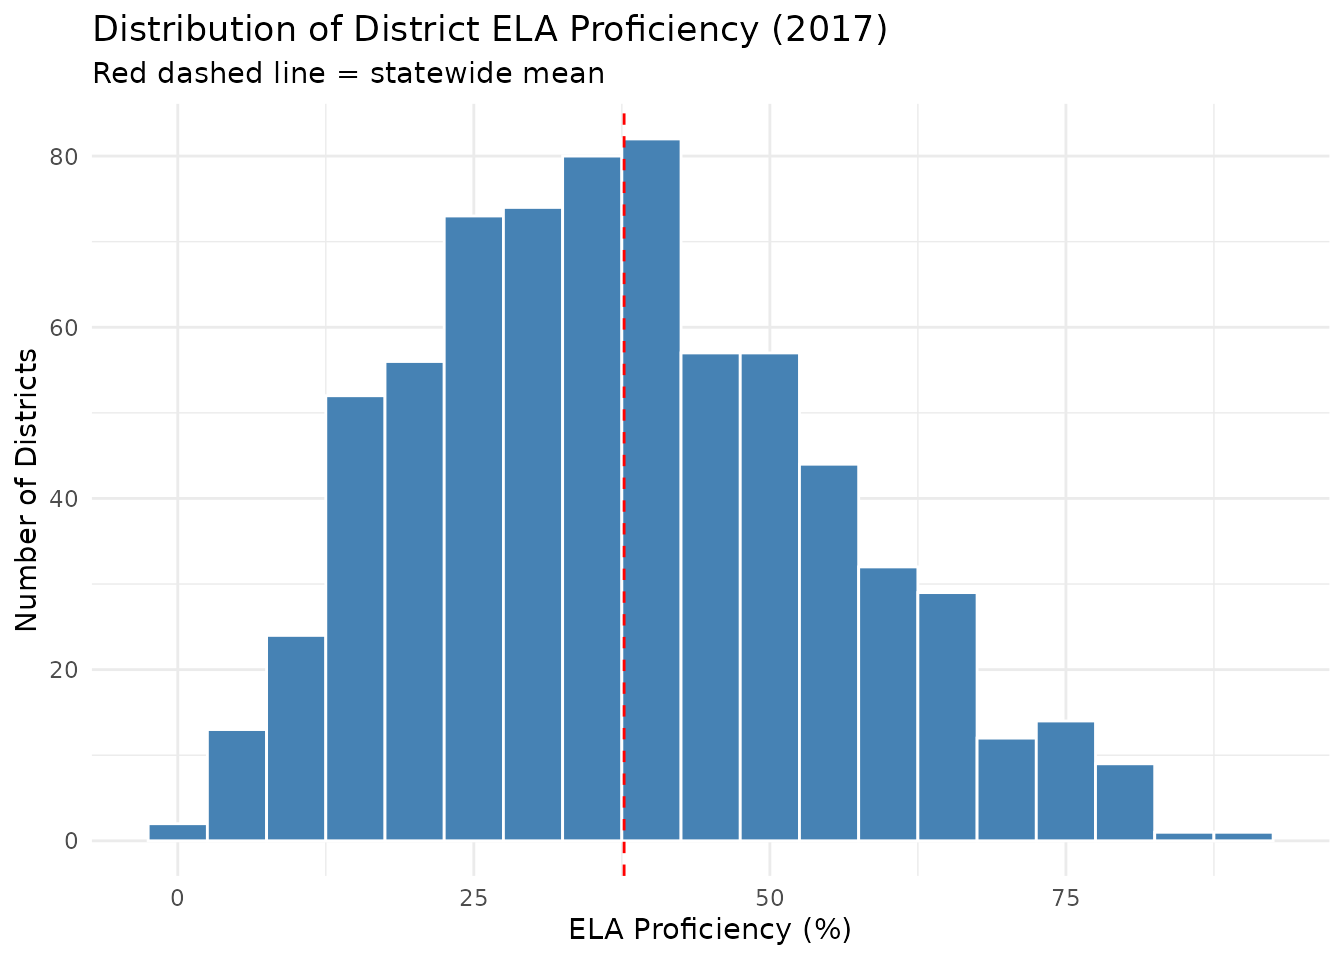
Data Taxonomy
| Category | Years | Function | Details |
|---|---|---|---|
| Enrollment | 1997-2025 |
fetch_enr() / fetch_enr_multi()
|
State, district, school. Race, gender, FRPL, SpEd, LEP, homeless |
| Assessments | 2006-2025 |
fetch_assessment() / fetch_assessment_multi()
|
State, district, school. ELA, Math. ISAT/PARCC/IAR eras |
| Graduation | — | — | Not yet available |
| Directory | Current | fetch_directory() |
District, school. Names, IDs, addresses, entity type |
| Per-Pupil Spending | — | — | Not yet available |
| Accountability | — | — | Not yet available |
| Chronic Absence | — | — | Not yet available |
| EL Progress | — | — | Not yet available |
| Special Ed | — | — | Not yet available |
See DATA-CATEGORY-TAXONOMY.md for what each category covers.
Quick Start
R
# install.packages("remotes")
remotes::install_github("almartin82/ilschooldata")

library(ilschooldata)
library(dplyr)

# Fetch one year
enr_2025 <- fetch_enr(2025)

# Fetch multiple years
enr_recent <- fetch_enr_multi(2019:2025)

# Fetch historical data
enr_historical <- fetch_enr_multi(1997:2017)

# State totals
enr_2025 %>%
  filter(is_state, subgroup == "total_enrollment", grade_level == "TOTAL") %>%
  pull(n_students)
#> [1] 1848560

# Top 10 districts
enr_2025 %>%
  filter(is_district, subgroup == "total_enrollment", grade_level == "TOTAL") %>%
  arrange(desc(n_students)) %>%
  select(district_name, city, n_students) %>%
  head(10)
#>                          district_name       city n_students
#> 1  Chicago Public Schools District 299    Chicago     323047
#> 2                              SD U-46      Elgin      33525
#> 3                      Rockford SD 205   Rockford      28162
#> 4              Indian Prairie CUSD 204     Aurora      25932
#> 5                    Plainfield SD 202 Plainfield      24411
#> ...

# Demographics statewide
enr_2025 %>%
  filter(is_state, grade_level == "TOTAL",
         subgroup %in% c("white", "black", "hispanic", "asian")) %>%
  select(subgroup, n_students, pct)
#>   subgroup n_students  pct
#> 1    white     818912 0.443
#> 2    black     301315 0.163
#> 3 hispanic     528688 0.286
#> 4    asian     105368 0.057
Python
import pyilschooldata as il

# Check available years
years = il.get_available_years()
print(f"Data available from {years['min_year']} to {years['max_year']}")

# Fetch one year
df = il.fetch_enr(2025)

# Fetch multiple years
df_multi = il.fetch_enr_multi([2019, 2020, 2021, 2022, 2023, 2024, 2025])

# State totals
state_total = df[(df['is_state'] == True) &
                 (df['subgroup'] == 'total_enrollment') &
                 (df['grade_level'] == 'TOTAL')]
print(state_total['n_students'].values[0])

# Top 10 districts
districts = df[(df['is_district'] == True) &
               (df['subgroup'] == 'total_enrollment') &
               (df['grade_level'] == 'TOTAL')]
top_10 = districts.nlargest(10, 'n_students')[['district_name', 'city', 'n_students']]
print(top_10)
Explore More
Full analysis across two vignettes: - Enrollment trends — 15 stories - Assessment analysis — 15 stories - Function reference
Data Notes
Data Source: Illinois State Board of Education (ISBE) Illinois Report Card and Report Card Data Library
Census Day: Fall enrollment counts are taken on the first school day in October, consistent with federal reporting requirements.
Suppression Rules: - Counts fewer than 10 students may be suppressed to protect student privacy - Suppressed cells appear as NA in the data - Percentages are not calculated when underlying counts are suppressed
Known Data Issues: - 2018 enrollment data is unavailable due to a source error at ISBE - Historical enrollment data (1997-2017) uses semicolon-delimited text files with only total enrollment (no demographics) - 2020 assessment data does not exist due to COVID-19 testing cancellation - Some district names changed over time due to consolidation or renaming
Assessment Definitions: - Proficiency: Levels 4+5 on PARCC/IAR (Meeting + Exceeding Standards); “Meets” and “Exceeds” on ISAT - Cross-era comparisons: Not valid—ISAT, PARCC, and IAR measured different standards with different difficulty levels - Grade 11: Students take SAT instead of IAR (not included in this dataset)
Subgroup Definitions: - Economically disadvantaged: Students from families receiving public assistance, living in substitute care, or eligible for free/reduced lunch - LEP (Limited English Proficient): English Language Learners receiving language services - Homeless: Students meeting McKinney-Vento Act definition (doubled-up, shelters, unsheltered, hotels/motels)
Deeper Dive
4. The Disappearing South Suburbs
South suburban Cook County has experienced population collapse unlike anywhere else in Illinois. Country Club Hills SD 160 lost 35% of its students in just six years.
south_suburbs <- c(
  "Country Club Hills SD 160", "Dolton SD 149", "Ford Heights SD 169",
  "Harvey SD 152", "Calumet City SD 155", "Thornton Twp HSD 205"
)

south_sub_trend <- all_enr %>%
  filter(
    is_district,
    district_name %in% south_suburbs,
    subgroup == "total_enrollment",
    grade_level == "TOTAL",
    end_year >= 2019
  ) %>%
  select(end_year, district_name, n_students)

stopifnot(nrow(south_sub_trend) > 0)
south_sub_trend %>% filter(district_name == "Country Club Hills SD 160")
#>   end_year             district_name n_students
#> 1     2019 Country Club Hills SD 160       1267
#> 2     2020 Country Club Hills SD 160       1321
#> 3     2021 Country Club Hills SD 160       1229
#> 4     2022 Country Club Hills SD 160       1236
#> 5     2023 Country Club Hills SD 160       1110
#> 6     2024 Country Club Hills SD 160        993
#> 7     2025 Country Club Hills SD 160        827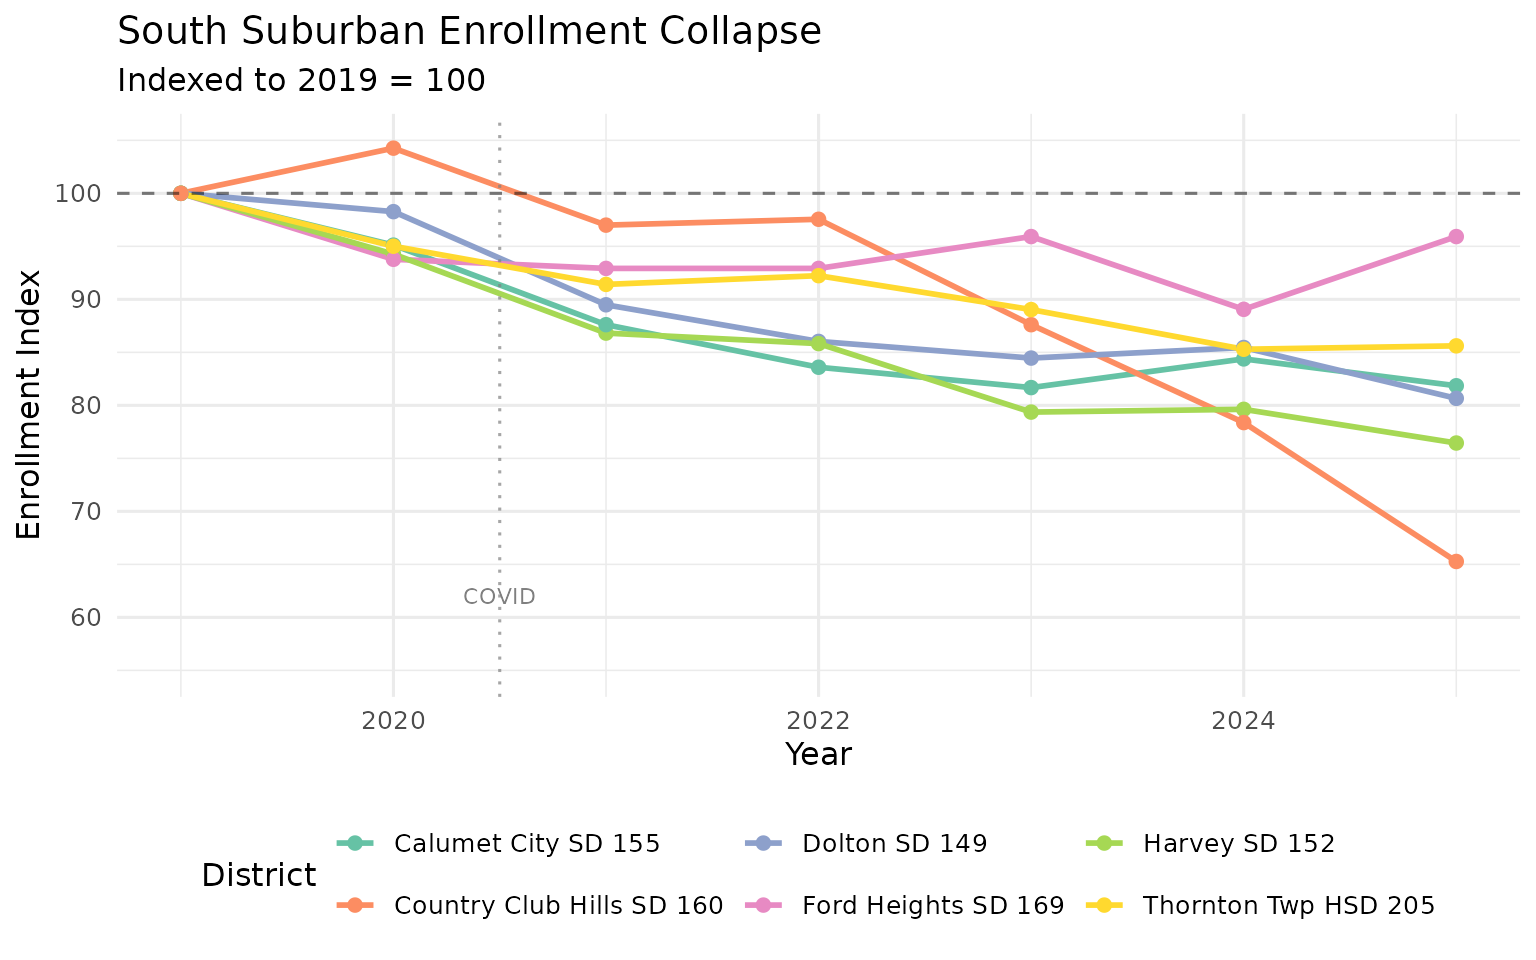
5. Manhattan’s Boom Town
While the south suburbs collapse, Manhattan SD 114 in Will County has grown 26% since 2019—one of the fastest-growing districts in the state.
will_county <- all_enr %>%
  filter(
    is_district,
    county == "Will",
    subgroup == "total_enrollment",
    grade_level == "TOTAL",
    end_year %in% c(2019, 2025)
  ) %>%
  select(district_name, end_year, n_students) %>%
  pivot_wider(names_from = end_year, values_from = n_students, names_prefix = "y") %>%
  filter(y2019 >= 500) %>%
  mutate(pct_change = (y2025 - y2019) / y2019 * 100) %>%
  arrange(desc(pct_change))

stopifnot(nrow(will_county) > 0)
head(will_county, 5)
#> # A tibble: 5 x 4
#>   district_name         y2019 y2025 pct_change
#>   <chr>                 <dbl> <dbl>      <dbl>
#> 1 Manhattan SD 114       1557  1968       26.4
#> 2 Frankfort CCSD 157C    2519  2634        4.6
#> 3 Mokena SD 159          1525  1563        2.5
#> 4 Joliet Twp HSD 204     6769  6621       -2.2
#> 5 Crete Monee CUSD 201U  4639  4486       -3.3
6. The Near-100% Economically Disadvantaged District
Dolton SD 149 has a 99.7% economically disadvantaged rate—nearly every student qualifies. Contrast this with Lake Forest SD 67 at just 1.3%.
districts_wide <- enr_2025 %>%
  filter(is_district, grade_level == "TOTAL") %>%
  select(district_name, city, county, subgroup, n_students) %>%
  pivot_wider(names_from = subgroup, values_from = n_students) %>%
  filter(total_enrollment >= 1000) %>%
  mutate(pct_econ_disadv = econ_disadv / total_enrollment * 100)

stopifnot(nrow(districts_wide) > 0)
bind_rows(
  districts_wide %>% arrange(desc(pct_econ_disadv)) %>% head(3),
  districts_wide %>% arrange(pct_econ_disadv) %>% head(3)
) %>% select(district_name, pct_econ_disadv)
#> # A tibble: 6 x 2
#>   district_name        pct_econ_disadv
#>   <chr>                          <dbl>
#> 1 Dolton SD 149                   99.7
#> 2 South Holland SD 151            99.6
#> 3 Bellwood SD 88                  99.3
#> 4 Lake Forest SD 67                1.3
#> 5 Frankfort CCSD 157C              1.4
#> 6 Hinsdale CCSD 181                1.8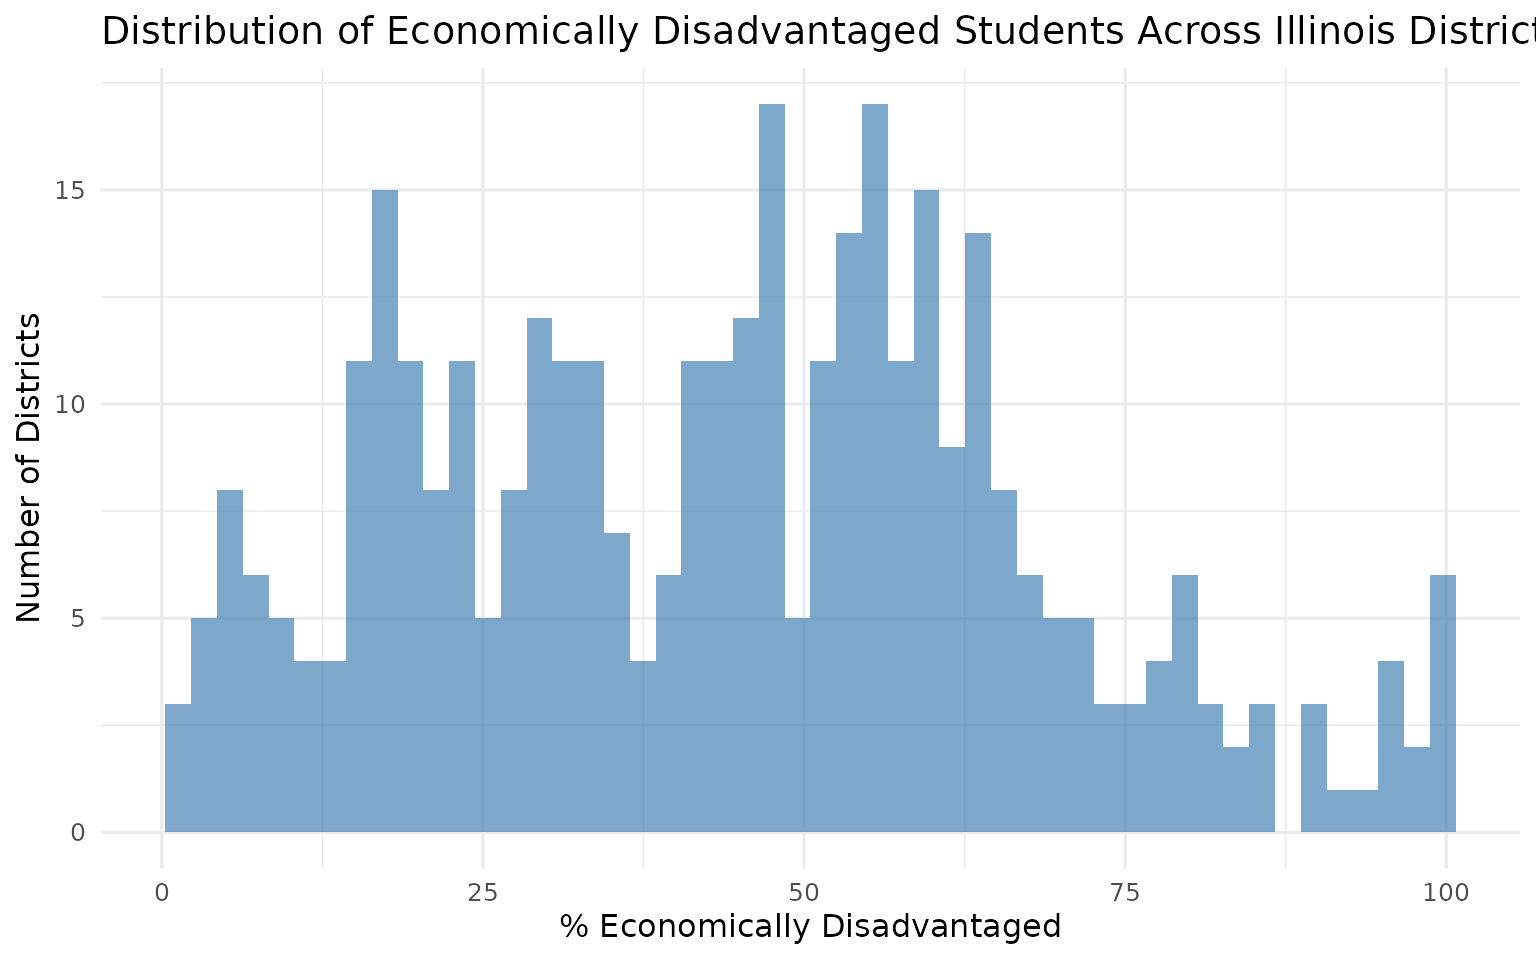
7. Declining Black Enrollment, Rising Hispanic Enrollment
Since 2017, Black student enrollment in Illinois has declined by over 43,000—a 13% drop—while Hispanic enrollment has grown modestly. (Race data available 2017 and 2019-2025.)
state_race <- all_enr %>%
  filter(
    is_state,
    grade_level == "TOTAL",
    subgroup %in% c("black", "hispanic", "white", "asian"),
    end_year >= 2017
  ) %>%
  select(end_year, subgroup, n_students) %>%
  distinct()

stopifnot(nrow(state_race) > 0)
state_race %>% filter(subgroup %in% c("black", "hispanic"), end_year %in% c(2017, 2025))
#>   end_year subgroup n_students
#> 1     2017    black     344788
#> 2     2017 hispanic     521238
#> 3     2025    black     301315
#> 4     2025 hispanic     528688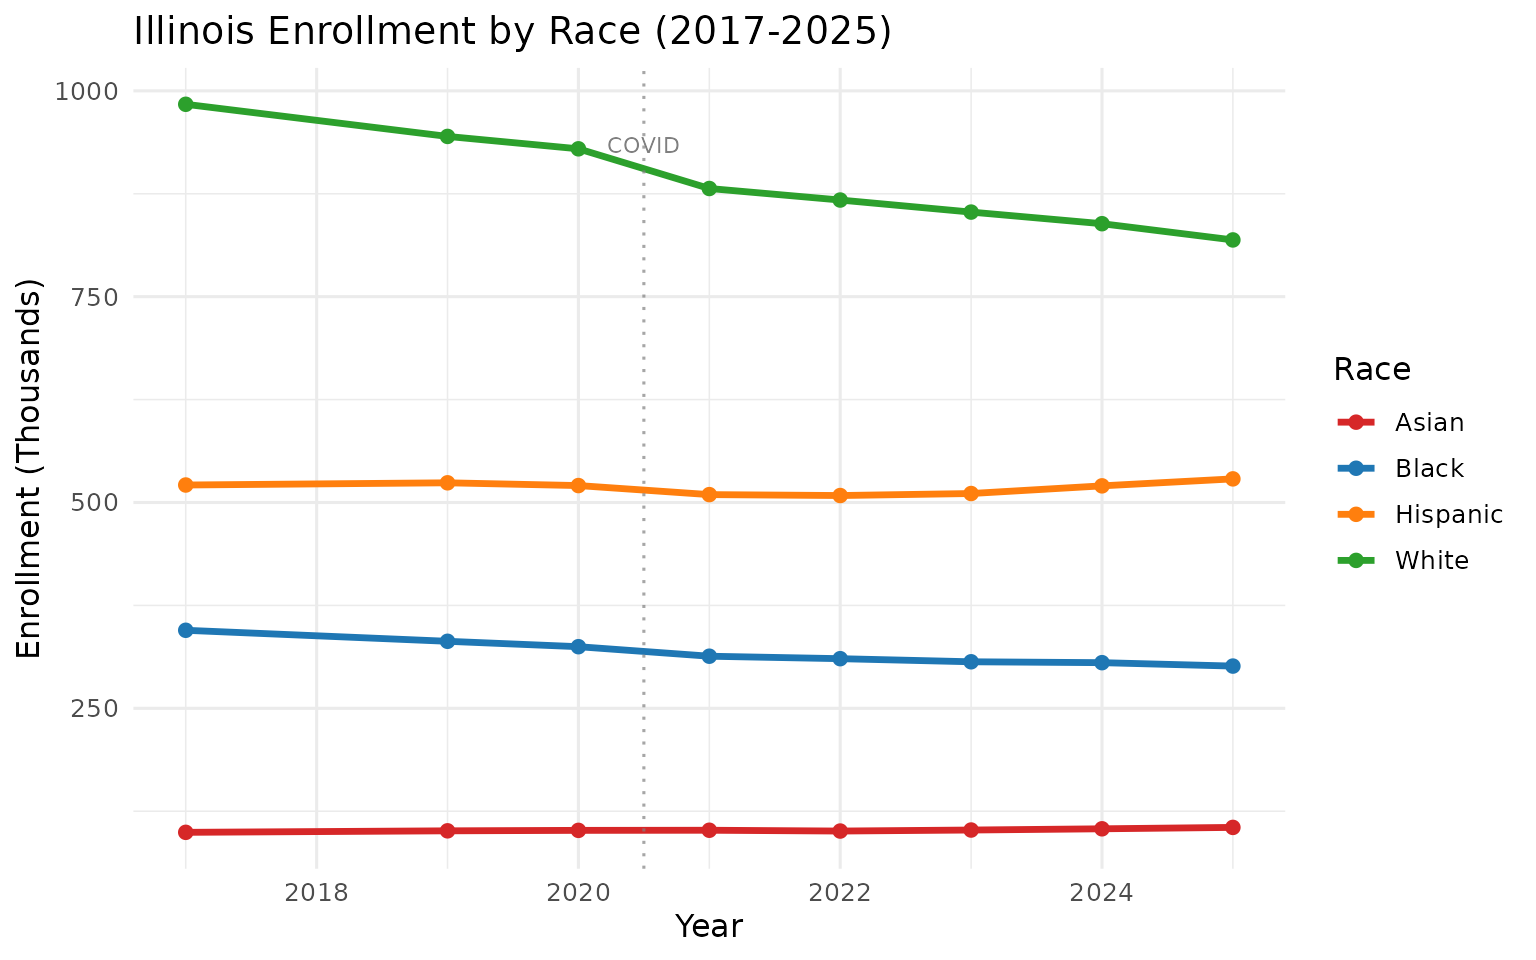
8. The 1-in-37 Homeless Student Crisis
Illinois schools serve nearly 50,000 homeless students—1 in every 37 students. Some districts approach 19% homeless enrollment.
homeless_districts <- districts_wide %>%
  mutate(pct_homeless = homeless / total_enrollment * 100) %>%
  arrange(desc(pct_homeless)) %>%
  filter(!is.na(pct_homeless)) %>%
  head(5) %>%
  select(district_name, city, total_enrollment, homeless, pct_homeless)

stopifnot(nrow(homeless_districts) > 0)
homeless_districts
#> # A tibble: 5 x 5
#>   district_name       city         total_enrollment homeless pct_homeless
#>   <chr>               <chr>                   <dbl>    <dbl>        <dbl>
#> 1 Flora CUSD 35       Flora                    1305      251         19.2
#> 2 Eldorado CUSD 4     Eldorado                 1097      179         16.3
#> 3 Harrisburg CUSD 3   Harrisburg               1760      287         16.3
#> 4 Harvey SD 152       Harvey                   1467      230         15.7
#> 5 Hamilton Co CUSD 10 Mc Leansboro             1081      155         14.3
9. Special Education at Nearly 20%
Nearly one in five Illinois students (19.8%) receives special education services. Some high school districts exceed 35%.
sped_districts <- districts_wide %>%
  mutate(pct_sped = special_ed / total_enrollment * 100) %>%
  arrange(desc(pct_sped)) %>%
  filter(!is.na(pct_sped), total_enrollment >= 500) %>%
  select(district_name, city, total_enrollment, special_ed, pct_sped) %>%
  head(5)

stopifnot(nrow(sped_districts) > 0)
sped_districts
#> # A tibble: 5 x 5
#>   district_name         city          total_enrollment special_ed pct_sped
#>   <chr>                 <chr>                    <dbl>      <dbl>    <dbl>
#> 1 Lake Forest CHSD 115  Lake Forest               1348        511     37.9
#> 2 New Trier Twp HSD 203 Northfield                3610       1260     34.9
#> 3 Twp HSD 113           Highland Park             3000       1008     33.6
#> 4 East Peoria SD 86     East Peoria               1372        431     31.4
#> 5 Evanston Twp HSD 202  Evanston                  3476       1091     31.4
10. Cicero’s 97% Hispanic Enrollment
Cicero SD 99 is 97% Hispanic—one of the most demographically concentrated districts in Illinois. Just 30 years ago, it was majority white.
concentrated <- districts_wide %>%
  filter(total_enrollment >= 2000) %>%
  mutate(
    pct_hispanic = hispanic / total_enrollment * 100,
    pct_black = black / total_enrollment * 100,
    pct_white = white / total_enrollment * 100
  )

most_hispanic <- concentrated %>%
  arrange(desc(pct_hispanic)) %>%
  head(5) %>%
  select(district_name, city, total_enrollment, pct_hispanic)

stopifnot(nrow(most_hispanic) > 0)
most_hispanic
#> # A tibble: 5 x 4
#>   district_name       city          total_enrollment pct_hispanic
#>   <chr>               <chr>                    <dbl>        <dbl>
#> 1 Cicero SD 99        Cicero                    8621         97.0
#> 2 J S Morton HSD 201  Cicero                    7572         91.1
#> 3 Mannheim SD 83      Franklin Park             2390         88.1
#> 4 Aurora East USD 131 Aurora                   12043         87.4
#> 5 Berwyn South SD 100 Berwyn                    3002         83.8
11. Rockford’s Quiet Stabilization
Illinois’ third-largest district (Rockford SD 205) has actually stabilized after a COVID dip, recovering to around 28,000 students.
mid_districts <- all_enr %>%
  filter(
    is_district,
    grepl("^(Rockford|SD U-46|Indian Prairie)", district_name),
    subgroup == "total_enrollment",
    grade_level == "TOTAL"
  ) %>%
  select(end_year, district_name, n_students)

stopifnot(nrow(mid_districts) > 0)
mid_districts %>% filter(grepl("Rockford", district_name), end_year >= 2019)
#>   end_year   district_name n_students
#> 1     2019 Rockford SD 205      28679
#> 2     2020 Rockford SD 205      28194
#> 3     2021 Rockford SD 205      26089
#> 4     2022 Rockford SD 205      27328
#> 5     2023 Rockford SD 205      27173
#> 6     2024 Rockford SD 205      27268
#> 7     2025 Rockford SD 205      28162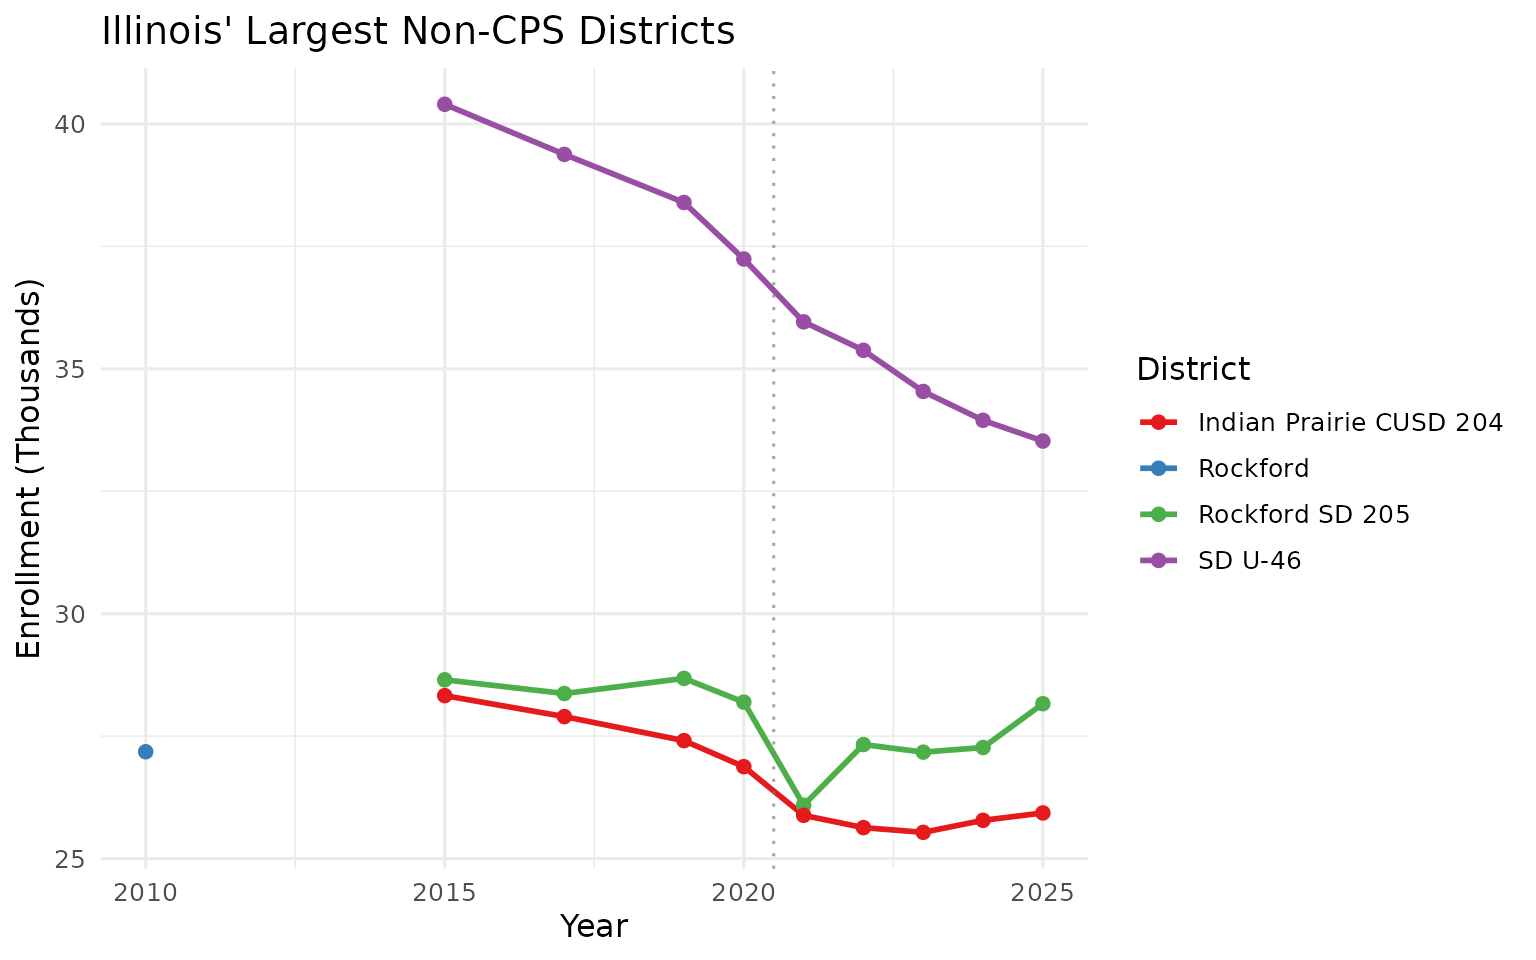
12. The 23 Vanished Districts
Since 1999, Illinois has consolidated or closed 23 school districts. The state went from 887 districts to 864.
district_counts <- all_enr %>%
  filter(is_district, subgroup == "total_enrollment", grade_level == "TOTAL") %>%
  group_by(end_year) %>%
  summarize(n_districts = n(), .groups = "drop")

stopifnot(nrow(district_counts) > 0)
district_counts %>% filter(end_year %in% c(1999, 2010, 2025))
#> # A tibble: 3 x 2
#>   end_year n_districts
#>      <dbl>       <int>
#> 1     1999         887
#> 2     2010         868
#> 3     2025         864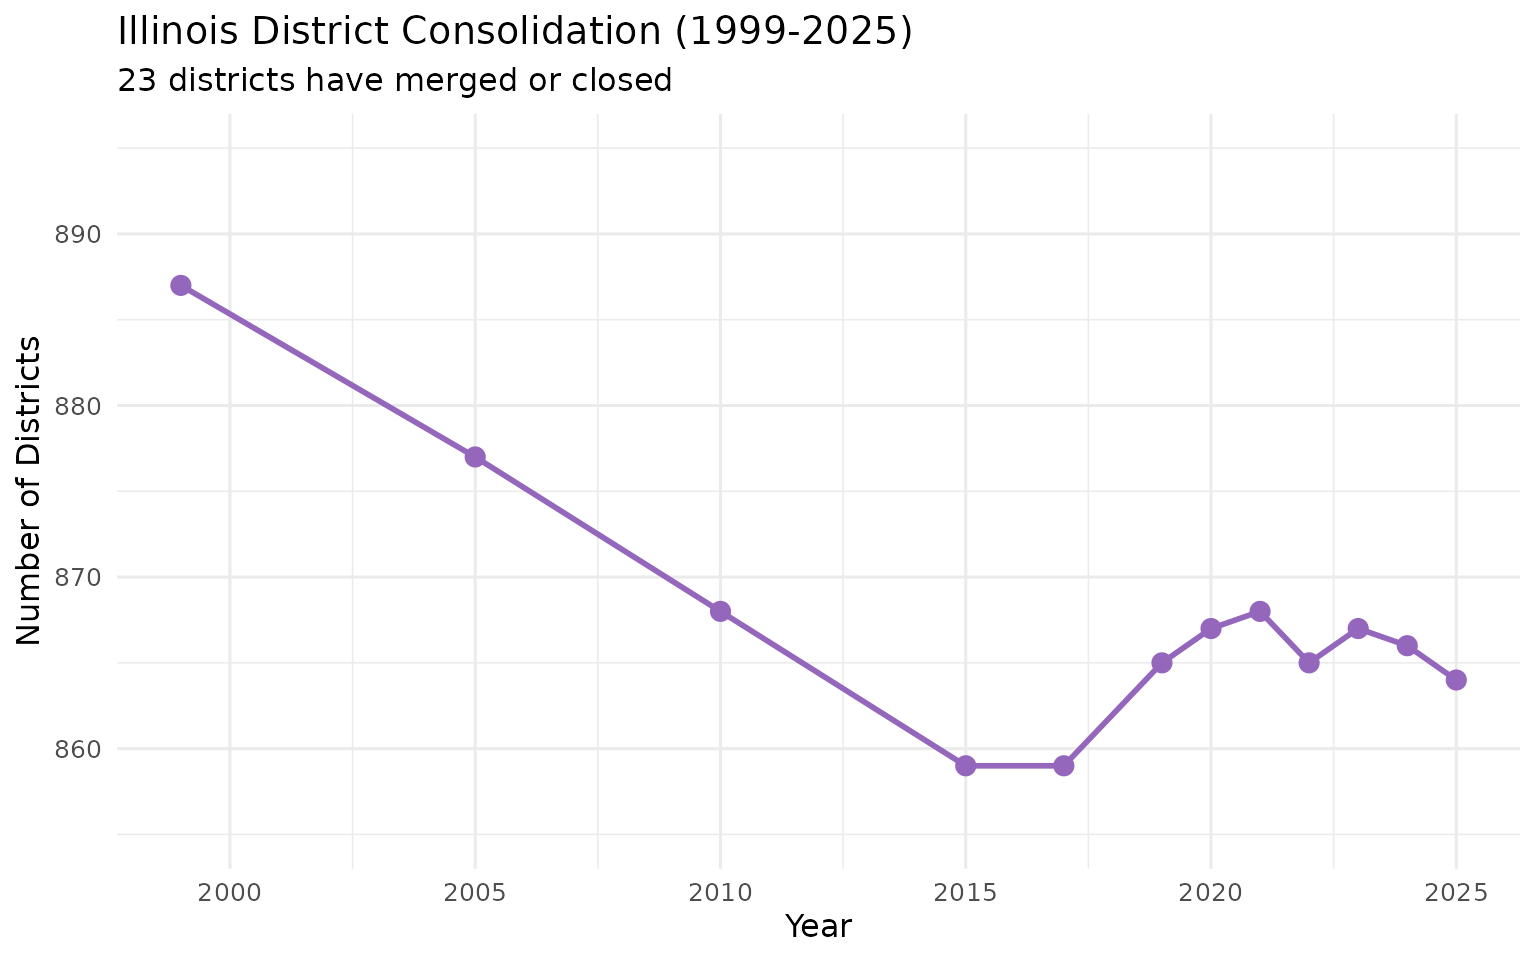
13. CPS Dominates Illinois—One District, 17% of All Students
Chicago Public Schools District 299 enrolls 323,047 students—nearly 1 in 6 Illinois students attend a single district. The next-largest district (SD U-46 in Elgin) has barely a tenth of that.
cps_share <- enr_2025 %>%
  filter(
    is_district,
    subgroup == "total_enrollment",
    grade_level == "TOTAL"
  ) %>%
  arrange(desc(n_students)) %>%
  head(5) %>%
  select(district_name, city, n_students)

stopifnot(nrow(cps_share) > 0)

state_total <- enr_2025 %>%
  filter(is_state, subgroup == "total_enrollment", grade_level == "TOTAL") %>%
  pull(n_students)

cps_share <- cps_share %>%
  mutate(pct_of_state = round(n_students / state_total * 100, 1))

cps_share
#>                          district_name       city n_students pct_of_state
#> 1  Chicago Public Schools District 299    Chicago     323047         17.5
#> 2                              SD U-46      Elgin      33525          1.8
#> 3                      Rockford SD 205   Rockford      28162          1.5
#> 4              Indian Prairie CUSD 204     Aurora      25932          1.4
#> 5                    Plainfield SD 202 Plainfield      24411          1.3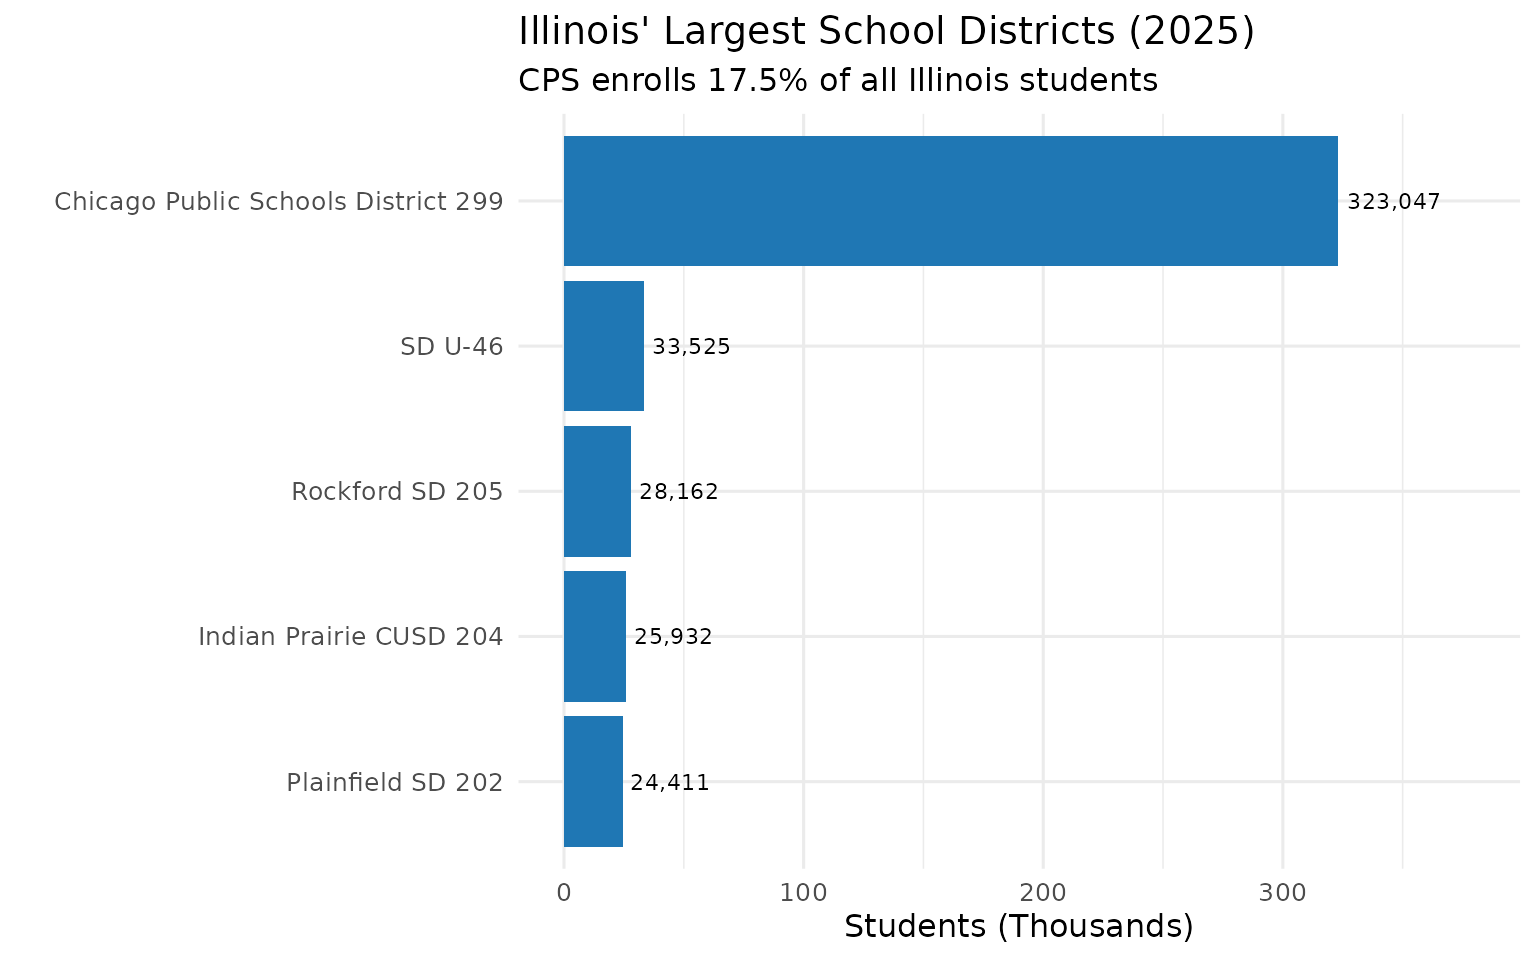
14. Downstate Decline—Rural Counties Losing 20% of Students
While Chicago dominates headlines, downstate Illinois is experiencing a quiet crisis. Counties like Alexander and Schuyler have lost over 20% of students since 2019.
county_change <- all_enr %>%
  filter(
    is_district,
    subgroup == "total_enrollment",
    grade_level == "TOTAL",
    end_year %in% c(2019, 2025),
    !grepl("Dept Of Corrections", county)
  ) %>%
  group_by(county, end_year) %>%
  summarize(total = sum(n_students, na.rm = TRUE), .groups = "drop") %>%
  pivot_wider(names_from = end_year, values_from = total, names_prefix = "y") %>%
  filter(!is.na(y2019), !is.na(y2025), y2019 > 0) %>%
  mutate(pct_change = (y2025 - y2019) / y2019 * 100) %>%
  arrange(pct_change)

stopifnot(nrow(county_change) > 0)
head(county_change, 5)
#> # A tibble: 5 x 4
#>   county    y2019 y2025 pct_change
#>   <chr>     <dbl> <dbl>      <dbl>
#> 1 Alexander   735   578      -21.4
#> 2 Schuyler   1038   825      -20.5
#> 3 Union      2951  2358      -20.1
#> 4 Bond       2251  1809      -19.6
#> 5 Fulton     4499  3836      -14.7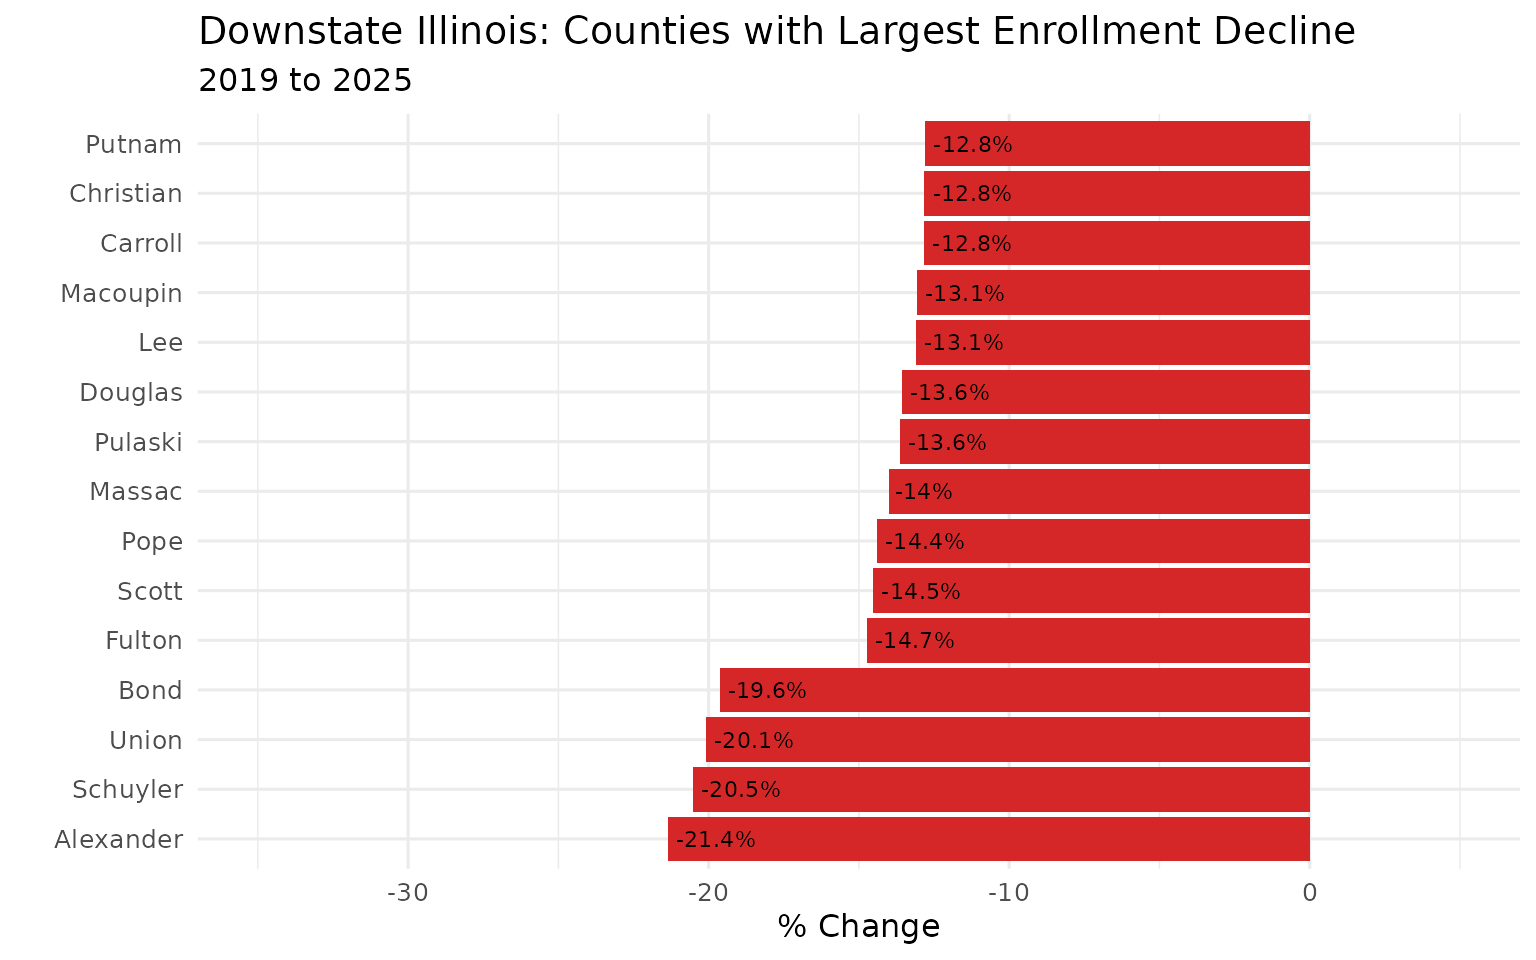
15. The Collar County Divide—All Declining, But at Different Rates
All six major Chicagoland counties have lost students since 2019, but Dupage has retained the most (93.3%) while Cook has declined the fastest (90.8%).
collar_trend <- all_enr %>%
  filter(
    is_district,
    county %in% c("Dupage", "Lake", "Kane", "Will", "McHenry", "Cook"),
    subgroup == "total_enrollment",
    grade_level == "TOTAL",
    end_year >= 2019
  ) %>%
  group_by(county, end_year) %>%
  summarize(total = sum(n_students, na.rm = TRUE), .groups = "drop")

collar_baseline <- collar_trend %>%
  filter(end_year == 2019) %>%
  select(county, base = total)

collar_indexed <- collar_trend %>%
  left_join(collar_baseline, by = "county") %>%
  mutate(index = total / base * 100)

stopifnot(nrow(collar_indexed) > 0)
collar_indexed %>% filter(end_year == 2025) %>% arrange(desc(index))
#> # A tibble: 6 x 5
#>   county  end_year  total   base index
#>   <chr>      <dbl>  <dbl>  <dbl> <dbl>
#> 1 Dupage      2025 142148 152346  93.3
#> 2 McHenry     2025  45013  48365  93.1
#> 3 Will        2025 101247 109906  92.1
#> 4 Lake        2025 120681 131769  91.6
#> 5 Kane        2025 108003 118346  91.3
#> 6 Cook        2025 673040 741187  90.8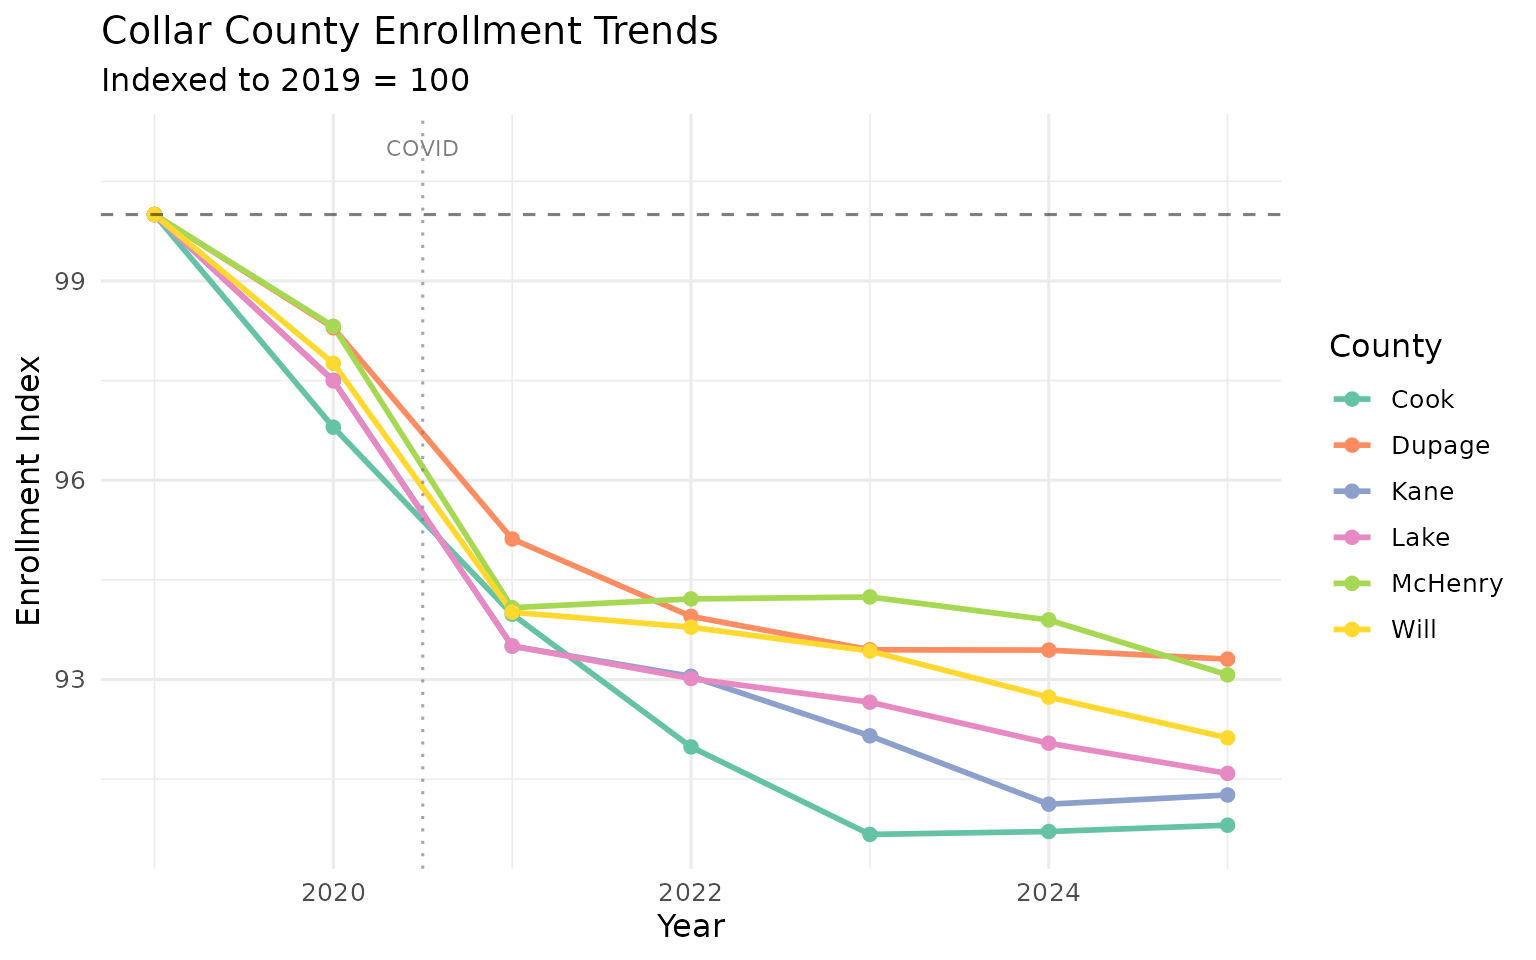
16. The Multiracial Surge—Fastest Growing Demographic
Multiracial students are the fastest-growing demographic in Illinois schools. From 2017 to 2025, multiracial enrollment grew 21% while White enrollment fell 17% and Black enrollment fell 13%.
race_trend <- all_enr %>%
  filter(
    is_state,
    grade_level == "TOTAL",
    subgroup %in% c("white", "black", "hispanic", "multiracial"),
    end_year %in% c(2017, 2025)
  ) %>%
  select(end_year, subgroup, n_students) %>%
  distinct()

stopifnot(nrow(race_trend) > 0)

race_wide <- race_trend %>%
  pivot_wider(names_from = end_year, values_from = n_students, names_prefix = "y")

race_wide
#> # A tibble: 4 x 3
#>   subgroup      y2017  y2025
#>   <chr>         <dbl>  <dbl>
#> 1 white        983659 818912
#> 2 black        344788 301315
#> 3 hispanic     521238 528688
#> 4 multiracial   68958  83185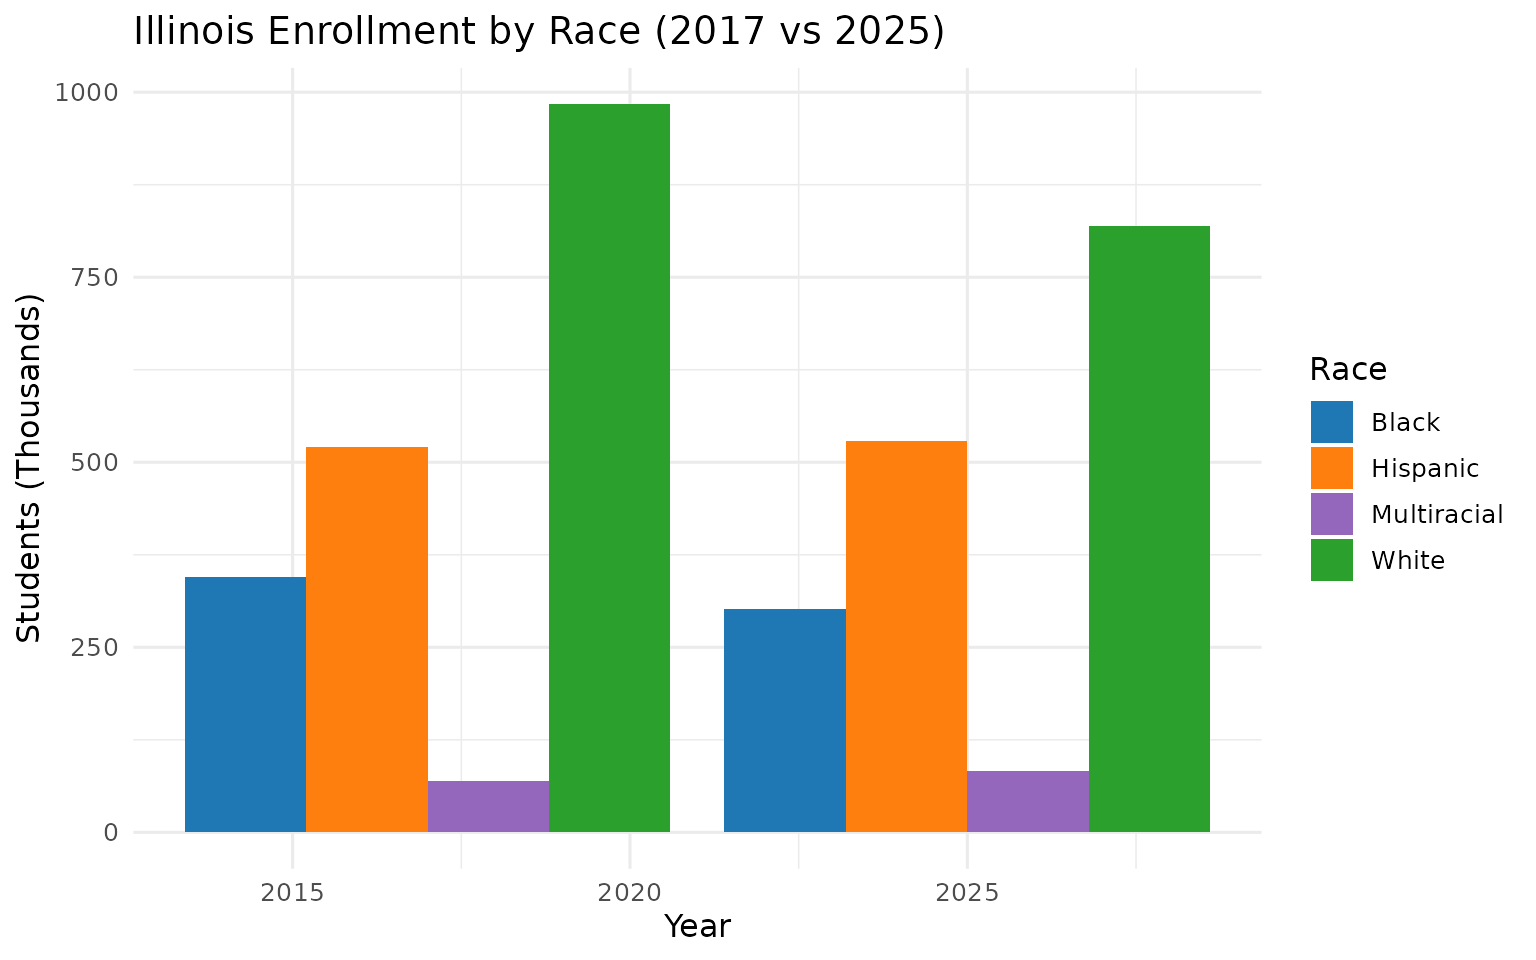
17. Steady Math Proficiency During PARCC Era (2016-2017)
Illinois showed steady math proficiency during the PARCC era, with district-average math proficiency holding at about 40%.
library(ilschooldata)
library(dplyr)
library(ggplot2)
library(tidyr)

# Compare PARCC 2016 to PARCC 2017 at district level
parcc_2016 <- fetch_assessment(2016, use_cache = TRUE)
parcc_2017 <- fetch_assessment(2017, use_cache = TRUE)

# State average proficiency (Math)
parcc_2016_dist <- parcc_2016 %>%
  filter(is_district, subject == "Math") %>%
  summarize(
    year = 2016,
    assessment = "PARCC",
    mean_proficiency = mean(pct_proficient, na.rm = TRUE)
  )

parcc_2017_dist <- parcc_2017 %>%
  filter(is_district, subject == "Math") %>%
  summarize(
    year = 2017,
    assessment = "PARCC",
    mean_proficiency = mean(pct_proficient, na.rm = TRUE)
  )

stopifnot(nrow(parcc_2016_dist) > 0, nrow(parcc_2017_dist) > 0)
bind_rows(parcc_2016_dist, parcc_2017_dist)
#>   year assessment mean_proficiency
#> 1 2016      PARCC             40.4
#> 2 2017      PARCC             40.5
18. Top Districts in ELA Include Small Rural and Affluent Suburban
The highest-performing districts in English Language Arts include a mix of small rural districts and affluent suburban districts.
assess_2017 %>%
  filter(is_district, subject == "ELA") %>%
  arrange(desc(pct_proficient)) %>%
  select(district_name, city, pct_proficient) %>%
  head(10)
#>               district_name         city pct_proficient
#> 1             Lisbon CCSD 90       Newark           92.3
#> 2           St Elmo CUSD 202   Saint Elmo           83.4
#> 3  Northbrook/Glenview SD 30   Northbrook           81.3
#> 4          Northbrook ESD 27   Northbrook           81.0
#> 5  Lowpoint-Washburn CUSD 21     Washburn           81.0
#> 6            Oak Grove SD 68 Libertyville           80.4
#> 7          Grant Park CUSD 6   Grant Park           80.0
#> 8                Gower SD 62   Burr Ridge           79.6
#> 9           Deerfield SD 109    Deerfield           79.5
#> 10          Tremont CUSD 702      Tremont           78.7
19. Math Proficiency Slightly Higher Than ELA in Illinois
In Illinois on the 2017 PARCC assessment, district-average math proficiency (40.5%) slightly exceeded ELA proficiency (37.7%). Only 36% of districts had higher ELA than Math.
# Compare ELA and Math at district level
ela_math <- assess_2017 %>%
  filter(is_district) %>%
  select(rcdts, district_name, subject, pct_proficient) %>%
  pivot_wider(names_from = subject, values_from = pct_proficient)

ela_math_summary <- ela_math %>%
  filter(!is.na(ELA) & !is.na(Math)) %>%
  summarize(
    n_districts = n(),
    mean_ela = mean(ELA, na.rm = TRUE),
    mean_math = mean(Math, na.rm = TRUE),
    ela_higher_count = sum(ELA > Math, na.rm = TRUE)
  ) %>%
  mutate(ela_higher_pct = round(ela_higher_count / n_districts * 100, 1))

stopifnot(nrow(ela_math_summary) > 0)
ela_math_summary
#> # A tibble: 1 x 5
#>   n_districts mean_ela mean_math ela_higher_count ela_higher_pct
#>         <int>    <dbl>     <dbl>            <int>          <dbl>
#> 1         712     37.7      40.5              254           35.7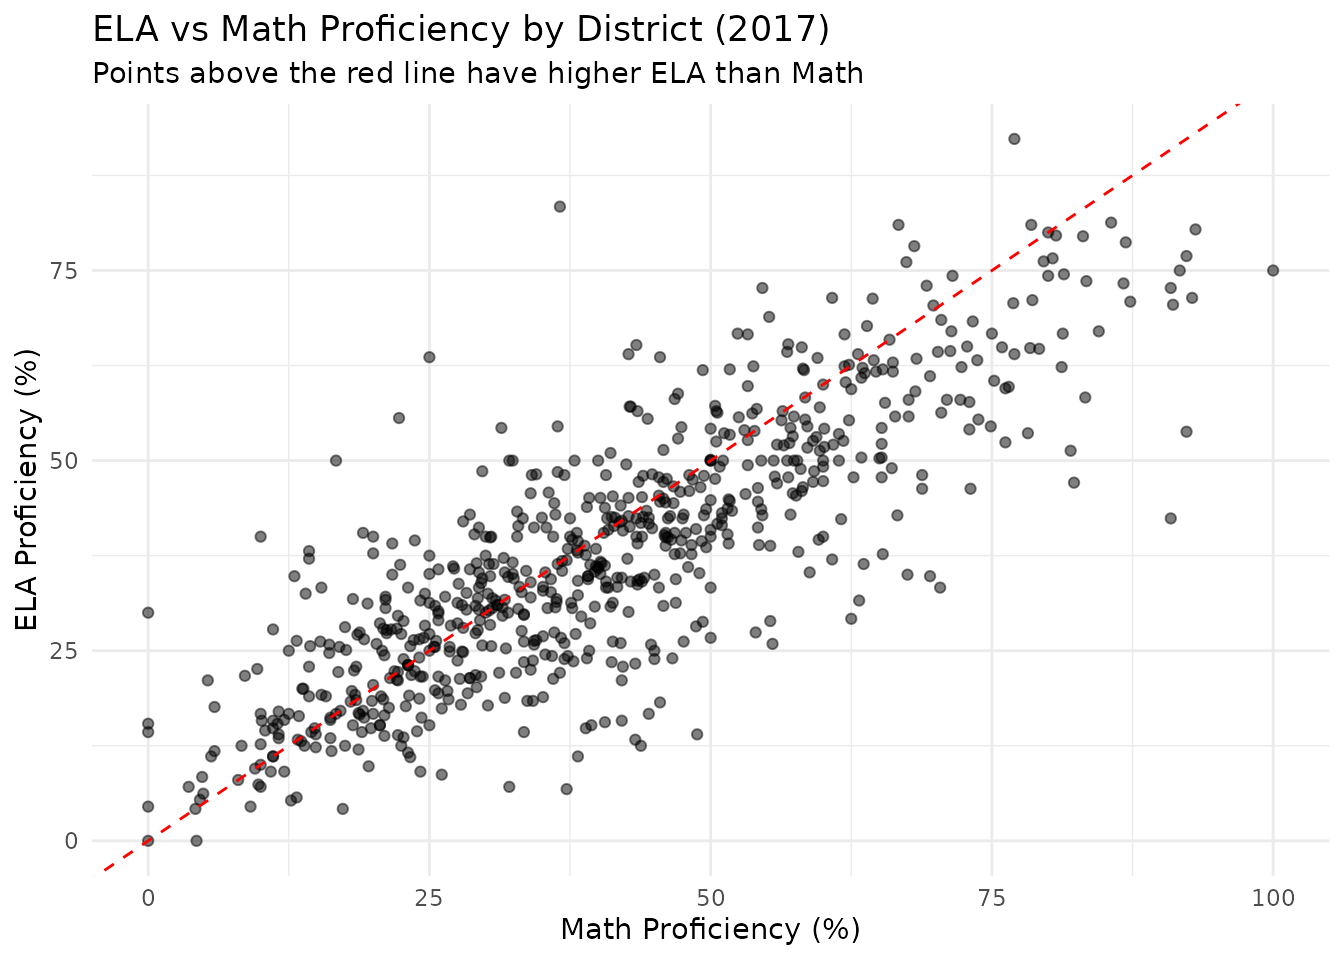
20. Top Counties by ELA Proficiency
Counties with 5+ districts vary widely in mean ELA proficiency. Rural Clinton County leads at 57.3%, while Cook County lags at 28.3%.
# Compare major counties
county_summary <- assess_2017 %>%
  filter(is_district, subject == "ELA") %>%
  group_by(county) %>%
  summarize(
    n_districts = n(),
    mean_proficiency = round(mean(pct_proficient, na.rm = TRUE), 1)
  ) %>%
  filter(n_districts >= 5) %>%
  arrange(desc(mean_proficiency))

stopifnot(nrow(county_summary) > 0)
# Show top counties
head(county_summary, 10)
#> # A tibble: 10 x 3
#>    county     n_districts mean_proficiency
#>    <chr>            <int>            <dbl>
#>  1 Clinton             11             57.3
#>  2 Wayne                5             53.6
#>  3 Kendall              5             51.7
#>  4 Woodford             8             50.1
#>  5 Grundy               5             48.8
#>  6 Effingham            5             48.2
#>  7 Dupage              35             47.9
#>  8 Morgan               5             46.9
#>  9 Stephenson           5             45.5
#> 10 Lake                37             44.9
21. Illinois Has Three Distinct Assessment Eras
Understanding Illinois assessment data requires recognizing the three distinct testing regimes. Direct comparisons across eras are not valid because the tests measured different standards.
# Check available years and assessment systems
available <- get_available_assessment_years()

cat("Available years:\n")
print(available$years)
#>  [1] 2006 2007 2008 2009 2010 2011 2012 2013 2014 2015 2016 2017 2018 2019 2021 2022 2023 2024 2025

cat("\nAssessment systems by year:\n")
print(available$systems[c("2014", "2017", "2024")])
#> $`2014`
#> [1] "ISAT"
#>
#> $`2017`
#> [1] "PARCC"
#>
#> $`2024`
#> [1] "IAR"| Era | Assessment | Years | Key Features |
|---|---|---|---|
| ISAT | Illinois Standards Achievement Test | 2006-2014 | Reading, Math, Science |
| PARCC | Partnership for Assessment of Readiness | 2015-2018 | Common Core aligned |
| IAR | Illinois Assessment of Readiness | 2019-present | PARCC successor |
Note: 2020 had no statewide testing due to the COVID-19 pandemic.