theme_readme <- function() {
  theme_minimal(base_size = 14) +
    theme(
      plot.title = element_text(face = "bold", size = 16),
      plot.subtitle = element_text(color = "gray40"),
      panel.grid.minor = element_blank(),
      legend.position = "bottom"
    )
}

colors <- c("ELA" = "#2C3E50", "Math" = "#3498DB", "Science" = "#27AE60",
            "Social Studies" = "#E74C3C", "below" = "#E74C3C",
            "approaching" = "#F39C12", "at" = "#3498DB", "above" = "#27AE60")
# Get available assessment years
years_info <- get_available_assessment_years()
available_years <- years_info$years

# Fetch recent years of data (corporation level to reduce load)
recent_years <- available_years[available_years >= 2019]
assess_multi <- fetch_assessment_multi(recent_years, level = "corporation", use_cache = TRUE)

# Get current year data (2024 for reliable data)
current_year <- 2024
assess_current <- fetch_assessment(current_year, level = "corporation", use_cache = TRUE)

# Flag for downstream chunks: data may be unavailable or malformed in CI
# Verify the expected filter values exist, not just that the data frame has rows
has_data <- nrow(assess_current) > 0 &&
  all(c("subject", "grade", "proficiency_level", "value") %in% names(assess_current)) &&
  "ELA" %in% assess_current$subject &&
  "All" %in% assess_current$grade &&
  "proficient" %in% assess_current$proficiency_level &&
  "total_tested" %in% assess_current$proficiency_level
has_multi <- nrow(assess_multi) > 0 &&
  all(c("subject", "grade", "proficiency_level", "value") %in% names(assess_multi)) &&
  "ELA" %in% assess_multi$subject
About ILEARN
Indiana’s Learning Evaluation and Assessment Readiness Network (ILEARN) is the state’s assessment for grades 3-8 in English/Language Arts (ELA), Math, Science, and Social Studies. ILEARN replaced ISTEP+ starting in 2019.
Proficiency Levels: - Below Proficiency: Student does not meet grade-level expectations - Approaching Proficiency: Student is nearing grade-level expectations - At Proficiency: Student meets grade-level expectations - Above Proficiency: Student exceeds grade-level expectations
A student is considered “proficient” if they score At or Above Proficiency.
1. Only 41% of Indiana students are proficient in ELA
Despite years of reform efforts, fewer than half of Indiana students demonstrate proficiency in English/Language Arts. The state faces a significant literacy challenge.
ela_state <- assess_current %>%
  filter(subject == "ELA", grade == "All") %>%
  group_by(proficiency_level) %>%
  summarize(total = sum(value, na.rm = TRUE), .groups = "drop") %>%
  filter(proficiency_level %in% c("total_tested", "proficient"))

stopifnot(nrow(ela_state) > 0)
stopifnot("proficient" %in% ela_state$proficiency_level)
stopifnot("total_tested" %in% ela_state$proficiency_level)

state_ela_pct <- ela_state$total[ela_state$proficiency_level == "proficient"] /
                 ela_state$total[ela_state$proficiency_level == "total_tested"] * 100

cat("Statewide ELA Proficiency:", round(state_ela_pct, 1), "%\n")
ela_dist <- assess_current %>%
  filter(subject == "ELA", grade == "All", proficiency_level %in% c("below", "approaching", "at", "above")) %>%
  group_by(proficiency_level) %>%
  summarize(n = sum(value, na.rm = TRUE), .groups = "drop") %>%
  mutate(pct = n / sum(n) * 100,
         level = factor(proficiency_level,
                       levels = c("below", "approaching", "at", "above"),
                       labels = c("Below", "Approaching", "At", "Above")))

stopifnot(nrow(ela_dist) > 0)

ela_dist %>% select(level, pct)

ggplot(ela_dist, aes(x = level, y = pct, fill = proficiency_level)) +
  geom_col() +
  geom_text(aes(label = paste0(round(pct, 1), "%")), vjust = -0.5, size = 4) +
  scale_fill_manual(values = c("below" = colors["below"], "approaching" = colors["approaching"],
                               "at" = colors["at"], "above" = colors["above"]), guide = "none") +
  labs(title = "Indiana ELA Proficiency Distribution",
       subtitle = paste0("Only ~", round(state_ela_pct), "% of students are proficient (At or Above)"),
       x = "Proficiency Level", y = "Percent of Students") +
  theme_readme()
2. Math proficiency is nearly identical to ELA
Math and ELA proficiency rates are nearly identical at about 41% statewide. Both subjects show a majority of students falling short of grade-level expectations.
math_state <- assess_current %>%
  filter(subject == "Math", grade == "All") %>%
  group_by(proficiency_level) %>%
  summarize(total = sum(value, na.rm = TRUE), .groups = "drop") %>%
  filter(proficiency_level %in% c("total_tested", "proficient"))

stopifnot(nrow(math_state) > 0)
stopifnot("proficient" %in% math_state$proficiency_level)
stopifnot("total_tested" %in% math_state$proficiency_level)

state_math_pct <- math_state$total[math_state$proficiency_level == "proficient"] /
                  math_state$total[math_state$proficiency_level == "total_tested"] * 100

cat("Statewide Math Proficiency:", round(state_math_pct, 1), "%\n")
cat("ELA vs Math gap:", round(state_ela_pct - state_math_pct, 1), "percentage points\n")

math_dist <- assess_current %>%
  filter(subject == "Math", grade == "All", proficiency_level %in% c("below", "approaching", "at", "above")) %>%
  group_by(proficiency_level) %>%
  summarize(n = sum(value, na.rm = TRUE), .groups = "drop") %>%
  mutate(pct = n / sum(n) * 100,
         level = factor(proficiency_level,
                       levels = c("below", "approaching", "at", "above"),
                       labels = c("Below", "Approaching", "At", "Above")))

stopifnot(nrow(math_dist) > 0)

ggplot(math_dist, aes(x = level, y = pct, fill = proficiency_level)) +
  geom_col() +
  geom_text(aes(label = paste0(round(pct, 1), "%")), vjust = -0.5, size = 4) +
  scale_fill_manual(values = c("below" = colors["below"], "approaching" = colors["approaching"],
                               "at" = colors["at"], "above" = colors["above"]), guide = "none") +
  labs(title = "Indiana Math Proficiency Distribution",
       subtitle = paste0("~", round(state_math_pct), "% of students are proficient"),
       x = "Proficiency Level", y = "Percent of Students") +
  theme_readme()
3. Math proficiency collapses in middle school
Grade 3 Math proficiency starts at 52% but falls to just 31% by Grade 8. ELA is more stable across grades. The Math decline suggests cumulative skill gaps that compound over time.
grade_prof <- assess_current %>%
  filter(subject %in% c("ELA", "Math"),
         grade %in% c("3", "4", "5", "6", "7", "8"),
         proficiency_level %in% c("proficient", "total_tested")) %>%
  pivot_wider(id_cols = c(corporation_id, subject, grade),
              names_from = proficiency_level,
              values_from = value) %>%
  group_by(subject, grade) %>%
  summarize(proficient = sum(proficient, na.rm = TRUE),
            tested = sum(total_tested, na.rm = TRUE),
            .groups = "drop") %>%
  mutate(pct = proficient / tested * 100)

stopifnot(nrow(grade_prof) > 0)

grade_prof %>% select(subject, grade, pct)

ggplot(grade_prof, aes(x = grade, y = pct, color = subject, group = subject)) +
  geom_line(linewidth = 1.5) +
  geom_point(size = 3) +
  scale_color_manual(values = c("ELA" = colors["ELA"], "Math" = colors["Math"])) +
  labs(title = "Math Proficiency Collapses in Middle School",
       subtitle = "Math drops from 52% in Grade 3 to 31% in Grade 8; ELA is more stable",
       x = "Grade", y = "Percent Proficient", color = "Subject") +
  theme_readme()
4. Fort Wayne proficiency is 12 points below state average
Fort Wayne Community Schools, Indiana’s largest district, has ELA proficiency rates well below the state average, reflecting the challenges facing urban districts.
fw_ela <- assess_current %>%
  filter(corporation_id == "0235", subject == "ELA", grade == "All",
         proficiency_level %in% c("proficient", "total_tested")) %>%
  pivot_wider(names_from = proficiency_level, values_from = value) %>%
  summarize(proficient = sum(proficient, na.rm = TRUE),
            tested = sum(total_tested, na.rm = TRUE)) %>%
  mutate(pct = proficient / tested * 100)

stopifnot(nrow(fw_ela) > 0)

cat("Fort Wayne ELA Proficiency:", round(fw_ela$pct, 1), "%\n")
cat("Difference from state:", round(fw_ela$pct - state_ela_pct, 1), "percentage points\n")
5. Carmel leads Indiana with nearly 70% proficiency
Carmel Clay Schools consistently posts the highest proficiency rates among large districts in Indiana. Nearly 70% of Carmel students are proficient in both ELA and Math.
carmel <- assess_current %>%
  filter(grepl("Carmel Clay", corporation_name, ignore.case = TRUE),
         grade == "All",
         subject %in% c("ELA", "Math"),
         proficiency_level %in% c("proficient", "total_tested")) %>%
  pivot_wider(id_cols = subject, names_from = proficiency_level, values_from = value) %>%
  mutate(pct = proficient / total_tested * 100)

stopifnot(nrow(carmel) > 0)

cat("Carmel Clay Schools Proficiency:\n")
print(carmel[, c("subject", "pct")])
6. The urban-suburban gap exceeds 40 percentage points
The gap between suburban Carmel (70% proficiency) and urban Indianapolis (21% proficiency) is nearly 50 percentage points in ELA. Indiana has one of the largest urban-suburban achievement gaps in the Midwest.
urban_suburban <- assess_current %>%
  filter(
    (corporation_id == "5385" |
     corporation_id == "0235" |
     grepl("Carmel Clay", corporation_name, ignore.case = TRUE) |
     grepl("Hamilton Southeastern", corporation_name, ignore.case = TRUE)),
    subject == "ELA", grade == "All",
    proficiency_level %in% c("proficient", "total_tested")) %>%
  pivot_wider(id_cols = corporation_name, names_from = proficiency_level, values_from = value) %>%
  mutate(pct = proficient / total_tested * 100) %>%
  arrange(desc(pct))

stopifnot(nrow(urban_suburban) > 0)

print(urban_suburban[, c("corporation_name", "pct")])
7. Science proficiency is tested in grades 3-5
Indiana tests Science in grades 3, 4, and 5 on ILEARN. Proficiency rates show a distribution similar to ELA and Math.
science_dist <- assess_current %>%
  filter(subject == "Science",
         proficiency_level %in% c("below", "approaching", "at", "above")) %>%
  group_by(proficiency_level) %>%
  summarize(n = sum(value, na.rm = TRUE), .groups = "drop") %>%
  filter(n > 0) %>%
  mutate(pct = n / sum(n) * 100,
         level = factor(proficiency_level,
                       levels = c("below", "approaching", "at", "above"),
                       labels = c("Below", "Approaching", "At", "Above")))

stopifnot(nrow(science_dist) > 0)

science_dist %>% select(level, pct)

ggplot(science_dist, aes(x = level, y = pct, fill = proficiency_level)) +
  geom_col() +
  geom_text(aes(label = paste0(round(pct, 1), "%")), vjust = -0.5, size = 4) +
  scale_fill_manual(values = c("below" = colors["below"], "approaching" = colors["approaching"],
                               "at" = colors["at"], "above" = colors["above"]), guide = "none") +
  labs(title = "Indiana Science Proficiency Distribution",
       subtitle = "Grades 3-5 combined",
       x = "Proficiency Level", y = "Percent of Students") +
  theme_readme()
8. Indianapolis has the lowest proficiency among large districts
Indianapolis Public Schools has the lowest proficiency rates among Indiana’s largest districts, with just 21% of students proficient in ELA.
large_districts <- assess_current %>%
filter(subject == "ELA", grade == "All",
proficiency_level %in% c("proficient", "total_tested")) %>%
pivot_wider(id_cols = c(corporation_id, corporation_name),
names_from = proficiency_level, values_from = value) %>%
filter(!is.na(proficient), !is.na(total_tested), total_tested > 5000) %>%
mutate(pct = proficient / total_tested * 100) %>%
arrange(desc(total_tested)) %>%
head(10) %>%
mutate(corp_label = reorder(corporation_name, pct))
stopifnot(nrow(large_districts) > 0)
large_districts %>% select(corporation_name, total_tested, pct)
ggplot(large_districts, aes(x = corp_label, y = pct)) +
geom_col(fill = colors["ELA"]) +
coord_flip() +
labs(title = "ELA Proficiency: Indiana's Largest Districts",
subtitle = "Districts with 5,000+ students tested",
x = "", y = "Percent Proficient") +
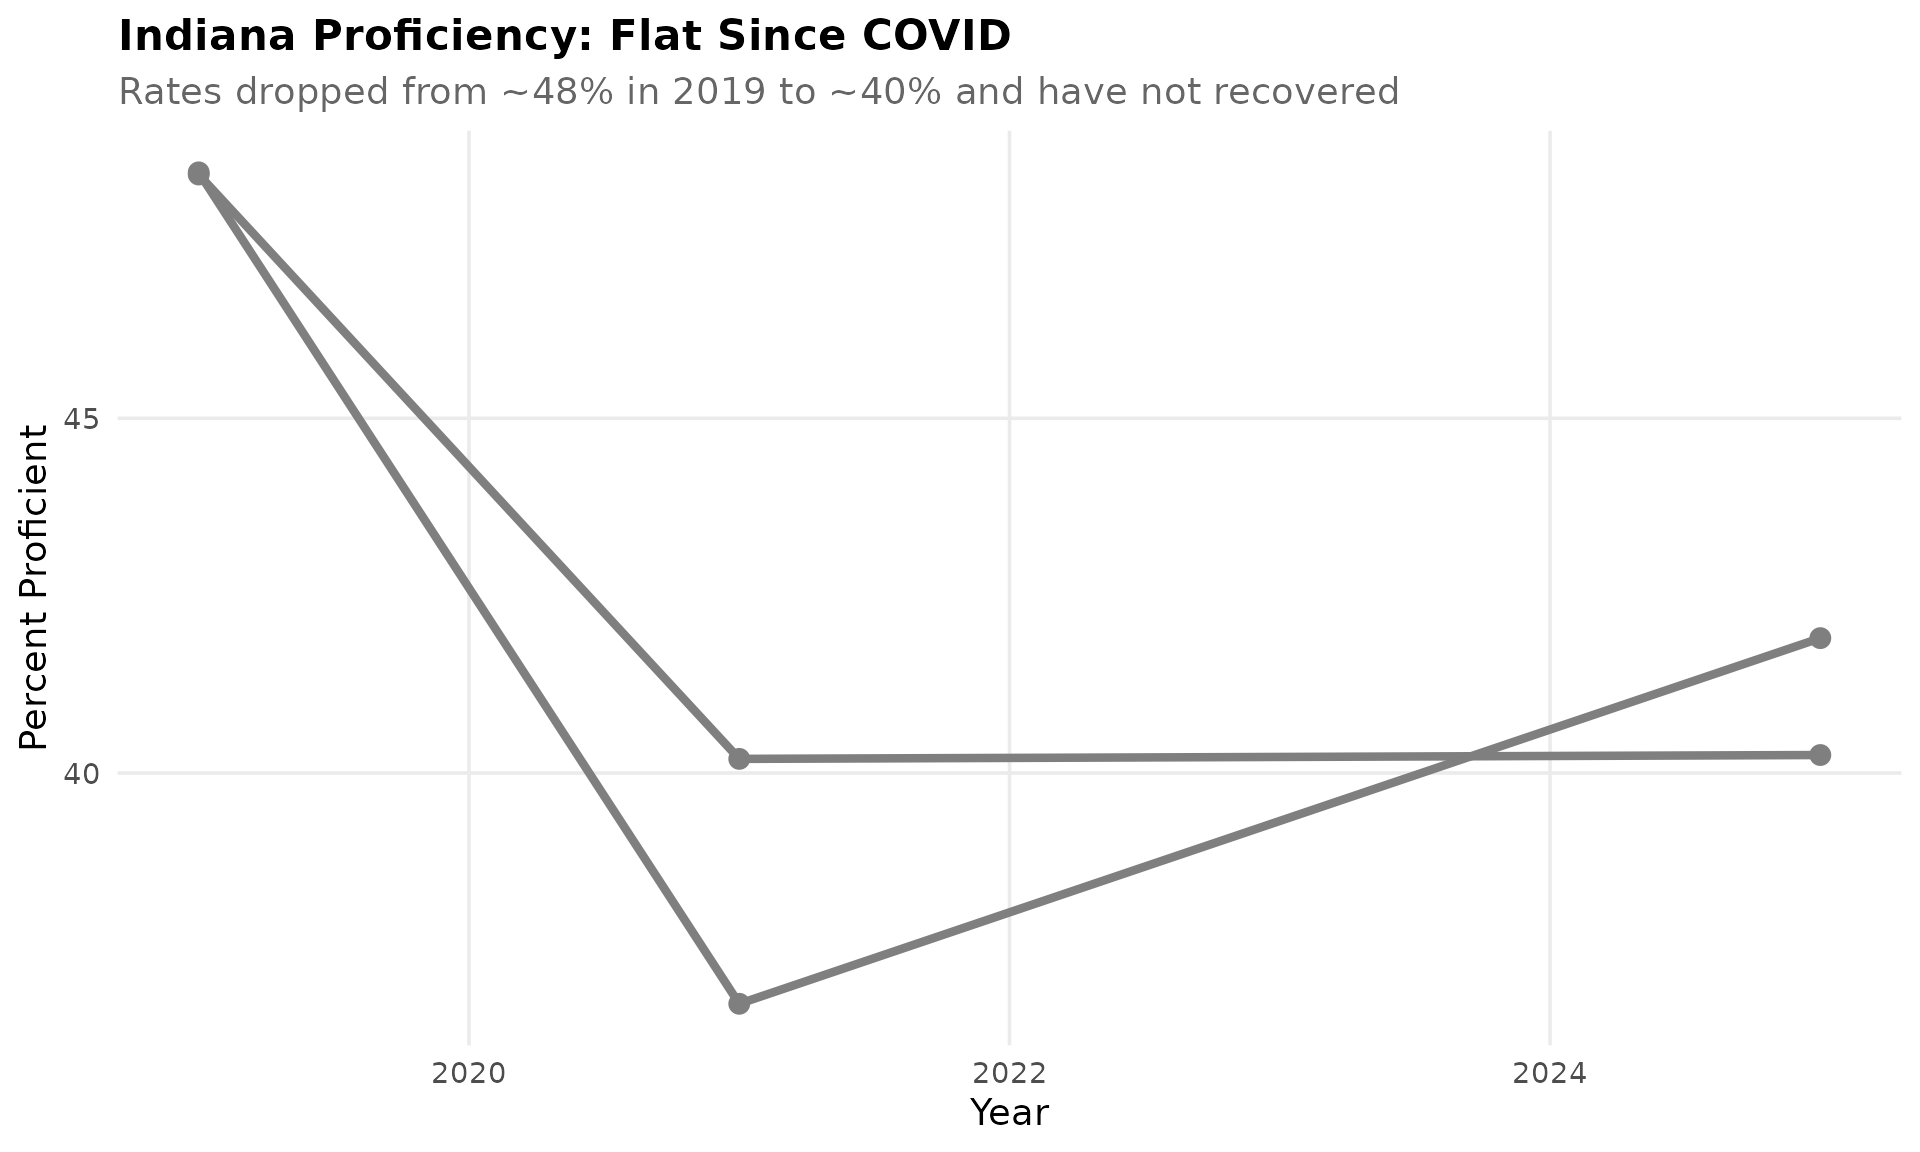
theme_readme()9. Proficiency crashed after ILEARN replaced ISTEP+ in 2019
Proficiency was near 48% in the first ILEARN year (2019), then dropped to 37-40% after the COVID disruption in 2020. Rates have remained flat since 2021, never recovering to pre-COVID levels.
if (length(recent_years) > 1) {
  trend <- assess_multi %>%
    filter(subject %in% c("ELA", "Math"), grade == "All",
           proficiency_level %in% c("proficient", "total_tested")) %>%
    group_by(end_year, subject, proficiency_level) %>%
    summarize(total = sum(value, na.rm = TRUE), .groups = "drop") %>%
    pivot_wider(names_from = proficiency_level, values_from = total) %>%
    mutate(pct = proficient / total_tested * 100)

  stopifnot(nrow(trend) > 0)

  trend %>% select(end_year, subject, pct)

  ggplot(trend, aes(x = end_year, y = pct, color = subject)) +
    geom_line(linewidth = 1.5) +
    geom_point(size = 3) +
    scale_color_manual(values = c("ELA" = colors["ELA"], "Math" = colors["Math"])) +
    labs(title = "Indiana Proficiency: Flat Since COVID",
         subtitle = "Rates dropped from ~48% in 2019 to ~40% and have not recovered",
         x = "Year", y = "Percent Proficient", color = "Subject") +
    theme_readme()
}
10. Social Studies is tested in grade 3 only
Indiana tests Social Studies on ILEARN in grade 3 only. Nearly 45% of students score Below Proficiency – the highest below-proficiency rate of any subject.
ss_dist <- assess_current %>%
  filter(subject == "Social Studies",
         proficiency_level %in% c("below", "approaching", "at", "above")) %>%
  group_by(proficiency_level) %>%
  summarize(n = sum(value, na.rm = TRUE), .groups = "drop") %>%
  filter(n > 0) %>%
  mutate(pct = n / sum(n) * 100,
         level = factor(proficiency_level,
                       levels = c("below", "approaching", "at", "above"),
                       labels = c("Below", "Approaching", "At", "Above")))

stopifnot(nrow(ss_dist) > 0)

ss_dist %>% select(level, pct)

if (nrow(ss_dist) > 0) {
  ggplot(ss_dist, aes(x = level, y = pct, fill = proficiency_level)) +
    geom_col() +
    geom_text(aes(label = paste0(round(pct, 1), "%")), vjust = -0.5, size = 4) +
    scale_fill_manual(values = c("below" = colors["below"], "approaching" = colors["approaching"],
                                 "at" = colors["at"], "above" = colors["above"]), guide = "none") +
    labs(title = "Indiana Social Studies Proficiency",
         subtitle = "Grade 3 only -- nearly 45% score Below Proficiency",
         x = "Proficiency Level", y = "Percent of Students") +
    theme_readme()
}
11. Over 36% of students score Below Proficiency
More than a third of Indiana students score Below Proficiency – the lowest level – in both ELA and Math. These students are significantly behind grade-level expectations.
below <- assess_current %>%
  filter(subject %in% c("ELA", "Math"), grade == "All",
         proficiency_level %in% c("below", "total_tested")) %>%
  group_by(subject, proficiency_level) %>%
  summarize(total = sum(value, na.rm = TRUE), .groups = "drop") %>%
  pivot_wider(names_from = proficiency_level, values_from = total) %>%
  mutate(pct = below / total_tested * 100)

stopifnot(nrow(below) > 0)

cat("Percent Below Proficiency:\n")
print(below[, c("subject", "pct")])
12. Brownsburg matches Carmel at the top
The top 10 highest-performing districts are dominated by suburban communities. Brownsburg Community School Corp ties Carmel Clay at nearly 70% ELA proficiency.
top_10 <- assess_current %>%
  filter(subject == "ELA", grade == "All",
         proficiency_level %in% c("proficient", "total_tested")) %>%
  pivot_wider(id_cols = c(corporation_id, corporation_name),
              names_from = proficiency_level, values_from = value) %>%
  filter(!is.na(proficient), !is.na(total_tested), total_tested > 1000) %>%
  mutate(pct = proficient / total_tested * 100) %>%
  arrange(desc(pct)) %>%
  head(10) %>%
  mutate(corp_label = reorder(corporation_name, pct))

stopifnot(nrow(top_10) > 0)

top_10 %>% select(corporation_name, pct)

ggplot(top_10, aes(x = corp_label, y = pct)) +
  geom_col(fill = colors["above"]) +
  coord_flip() +
  labs(title = "Top 10 Districts by ELA Proficiency",
       subtitle = "Districts with 1,000+ students tested",
       x = "", y = "Percent Proficient") +
  theme_readme()
13. Gary has lowest proficiency of any district
Gary Community School Corp has proficiency rates under 10% in both ELA and Math – among the lowest in the state for districts of any size.
gary <- assess_current %>%
  filter(grepl("Gary Community", corporation_name, ignore.case = TRUE),
         subject %in% c("ELA", "Math"), grade == "All",
         proficiency_level %in% c("proficient", "total_tested")) %>%
  pivot_wider(id_cols = subject, names_from = proficiency_level, values_from = value) %>%
  mutate(pct = proficient / total_tested * 100)

stopifnot(nrow(gary) > 0)

cat("Gary Community Schools Proficiency:\n")
print(gary[, c("subject", "pct")])
14. Grade 3 ELA proficiency is only 38%
Grade 3 reading proficiency is a critical milestone. More than 60% of Indiana third-graders are not reading proficiently – a warning sign for their academic futures.
g3_ela <- assess_current %>%
  filter(subject == "ELA", grade == "3",
         proficiency_level %in% c("proficient", "total_tested")) %>%
  group_by(proficiency_level) %>%
  summarize(total = sum(value, na.rm = TRUE), .groups = "drop") %>%
  pivot_wider(names_from = proficiency_level, values_from = total) %>%
  mutate(pct = proficient / total_tested * 100)

stopifnot(nrow(g3_ela) > 0)

cat("Grade 3 ELA Proficiency:", round(g3_ela$pct, 1), "%\n")
cat("Students NOT proficient at Grade 3:", round(100 - g3_ela$pct, 1), "%\n")
15. Nearly 481,000 students take ILEARN each year
Indiana tests approximately 481,000 students in grades 3-8 in ELA alone. Across all subjects, the ILEARN assessment is one of the largest standardized testing programs in the Midwest.
Data Notes
- Data Source: Indiana Department of Education Data Center
- Assessment: ILEARN (Indiana Learning Evaluation and Assessment Readiness Network)
- Available Years: 2019, 2021-2025 (no 2020 due to COVID testing waiver)
- Grades Tested: 3-8 for ELA and Math; 3-5 for Science; 3 for Social Studies
- Historical Note: ISTEP+ data (2014-2018) is also available through this package
Session Info
sessionInfo()
#> R version 4.5.2 (2025-10-31)
#> Platform: x86_64-pc-linux-gnu
#> Running under: Ubuntu 24.04.3 LTS
#>
#> Matrix products: default
#> BLAS:   /usr/lib/x86_64-linux-gnu/openblas-pthread/libblas.so.3
#> LAPACK: /usr/lib/x86_64-linux-gnu/openblas-pthread/libopenblasp-r0.3.26.so;  LAPACK version 3.12.0
#>
#> locale:
#>  [1] LC_CTYPE=C.UTF-8       LC_NUMERIC=C           LC_TIME=C.UTF-8
#>  [4] LC_COLLATE=C.UTF-8     LC_MONETARY=C.UTF-8    LC_MESSAGES=C.UTF-8
#>  [7] LC_PAPER=C.UTF-8       LC_NAME=C              LC_ADDRESS=C
#> [10] LC_TELEPHONE=C         LC_MEASUREMENT=C.UTF-8 LC_IDENTIFICATION=C
#>
#> time zone: UTC
#> tzcode source: system (glibc)
#>
#> attached base packages:
#> [1] stats     graphics  grDevices utils     datasets  methods   base
#>
#> other attached packages:
#> [1] scales_1.4.0       tidyr_1.3.2        dplyr_1.2.0        ggplot2_4.0.2
#> [5] inschooldata_0.2.0
#>
#> loaded via a namespace (and not attached):
#>  [1] gtable_0.3.6       jsonlite_2.0.0     compiler_4.5.2     tidyselect_1.2.1
#>  [5] stringr_1.6.0      jquerylib_0.1.4    systemfonts_1.3.2  textshaping_1.0.5
#>  [9] readxl_1.4.5       yaml_2.3.12        fastmap_1.2.0      R6_2.6.1
#> [13] labeling_0.4.3     generics_0.1.4     curl_7.0.0         knitr_1.51
#> [17] tibble_3.3.1       desc_1.4.3         bslib_0.10.0       pillar_1.11.1
#> [21] RColorBrewer_1.1-3 rlang_1.1.7        stringi_1.8.7      cachem_1.1.0
#> [25] xfun_0.56          fs_1.6.7           sass_0.4.10        S7_0.2.1
#> [29] cli_3.6.5          pkgdown_2.2.0      withr_3.0.2        magrittr_2.0.4
#> [33] digest_0.6.39      grid_4.5.2         rappdirs_0.3.4     lifecycle_1.0.5
#> [37] vctrs_0.7.1        evaluate_1.0.5     glue_1.8.0         cellranger_1.1.0
#> [41] farver_2.1.2       codetools_0.2-20   ragg_1.5.1         httr_1.4.8
#> [45] rmarkdown_2.30     purrr_1.2.1        tools_4.5.2        pkgconfig_2.0.3
#> [49] htmltools_0.5.9