Fetch and analyze Nebraska school enrollment data from the Nebraska Department of Education – 365,467 students across 420+ districts, with 22 years of data (2003-2024).
Part of the njschooldata family.
Full documentation – all 15 stories with interactive charts, getting-started guide, and complete function reference.
Highlights
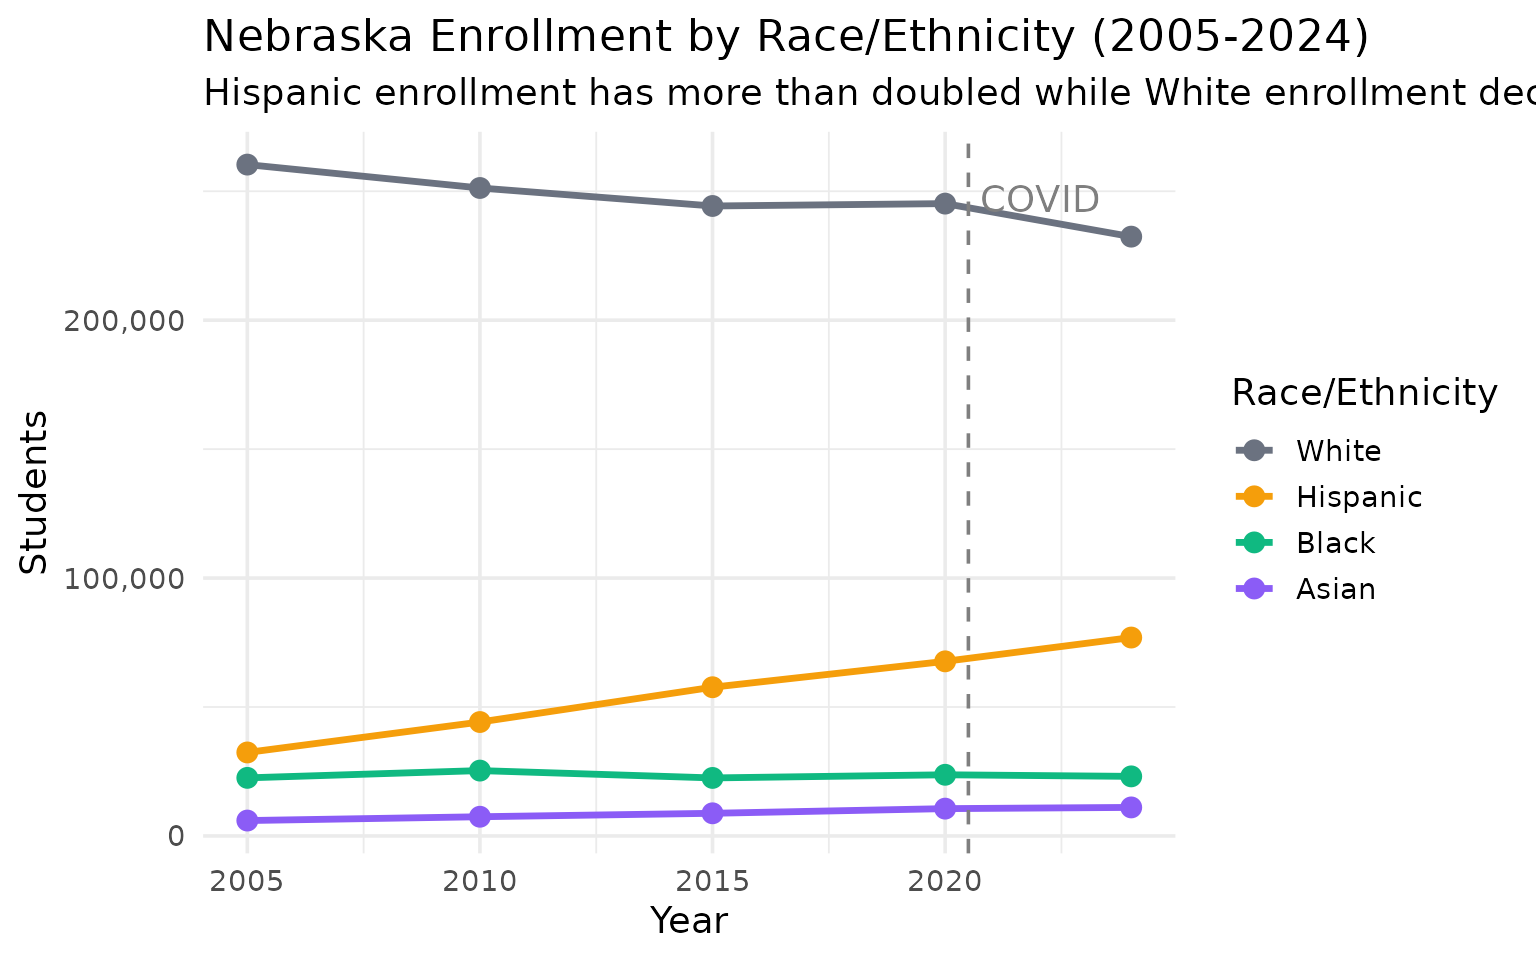
1. Hispanic enrollment has grown 138% since 2005
Nebraska’s demographic transformation: Hispanic students went from 32,000 to 77,000 in two decades.
enr <- fetch_enr_multi(c(2005, 2010, 2015, 2020, 2024), use_cache = TRUE)

demographics <- enr %>%
  filter(is_state, grade_level == "TOTAL",
         subgroup %in% c("white", "hispanic", "black", "asian")) %>%
  select(end_year, subgroup, n_students)

stopifnot(nrow(demographics) > 0)
demographics %>%
  pivot_wider(names_from = subgroup, values_from = n_students)
#>   end_year  white  black hispanic asian
#> 1     2005 260334  22523    32373  5966
#> 2     2010 251265  25340    44171  7445
#> 3     2015 244283  22498    57665  8780
#> 4     2020 245206  23716    67707 10590
#> 5     2024 232394  23100    76933 11061
Hispanic students: 32,373 to 76,933 (+138%). White students declined by 27,940.
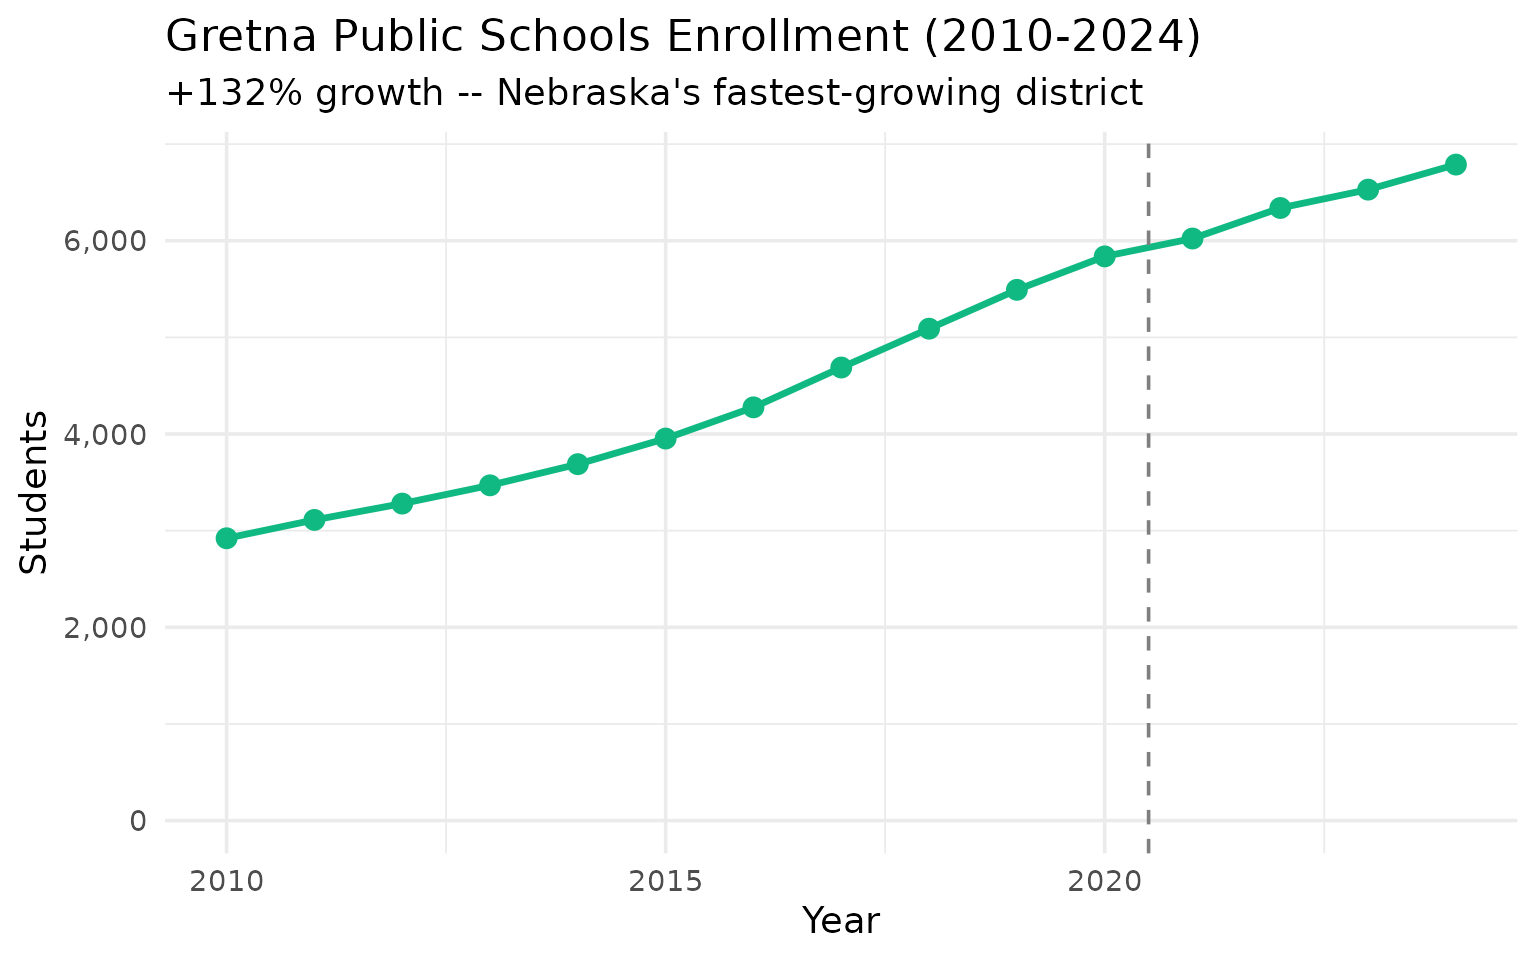
2. Gretna grew 132% since 2010 – Nebraska’s fastest-growing district
From 2,921 to 6,788 students, this Omaha-area suburb has more than doubled enrollment.
enr_multi <- fetch_enr_multi(2010:2024, use_cache = TRUE)

gretna <- enr_multi %>%
  filter(is_district, subgroup == "total_enrollment", grade_level == "TOTAL",
         district_name == "GRETNA PUBLIC SCHOOLS") %>%
  select(end_year, district_name, n_students)

stopifnot(nrow(gretna) > 0)
gretna %>%
  filter(end_year %in% c(2010, 2014, 2018, 2022, 2024))
#>   end_year         district_name n_students
#> 1     2010 GRETNA PUBLIC SCHOOLS       2921
#> 2     2014 GRETNA PUBLIC SCHOOLS       3688
#> 3     2018 GRETNA PUBLIC SCHOOLS       5090
#> 4     2022 GRETNA PUBLIC SCHOOLS       6339
#> 5     2024 GRETNA PUBLIC SCHOOLS       6788
+3,867 students (+132%) in 14 years. Gretna passed Kearney to become a top-8 district.
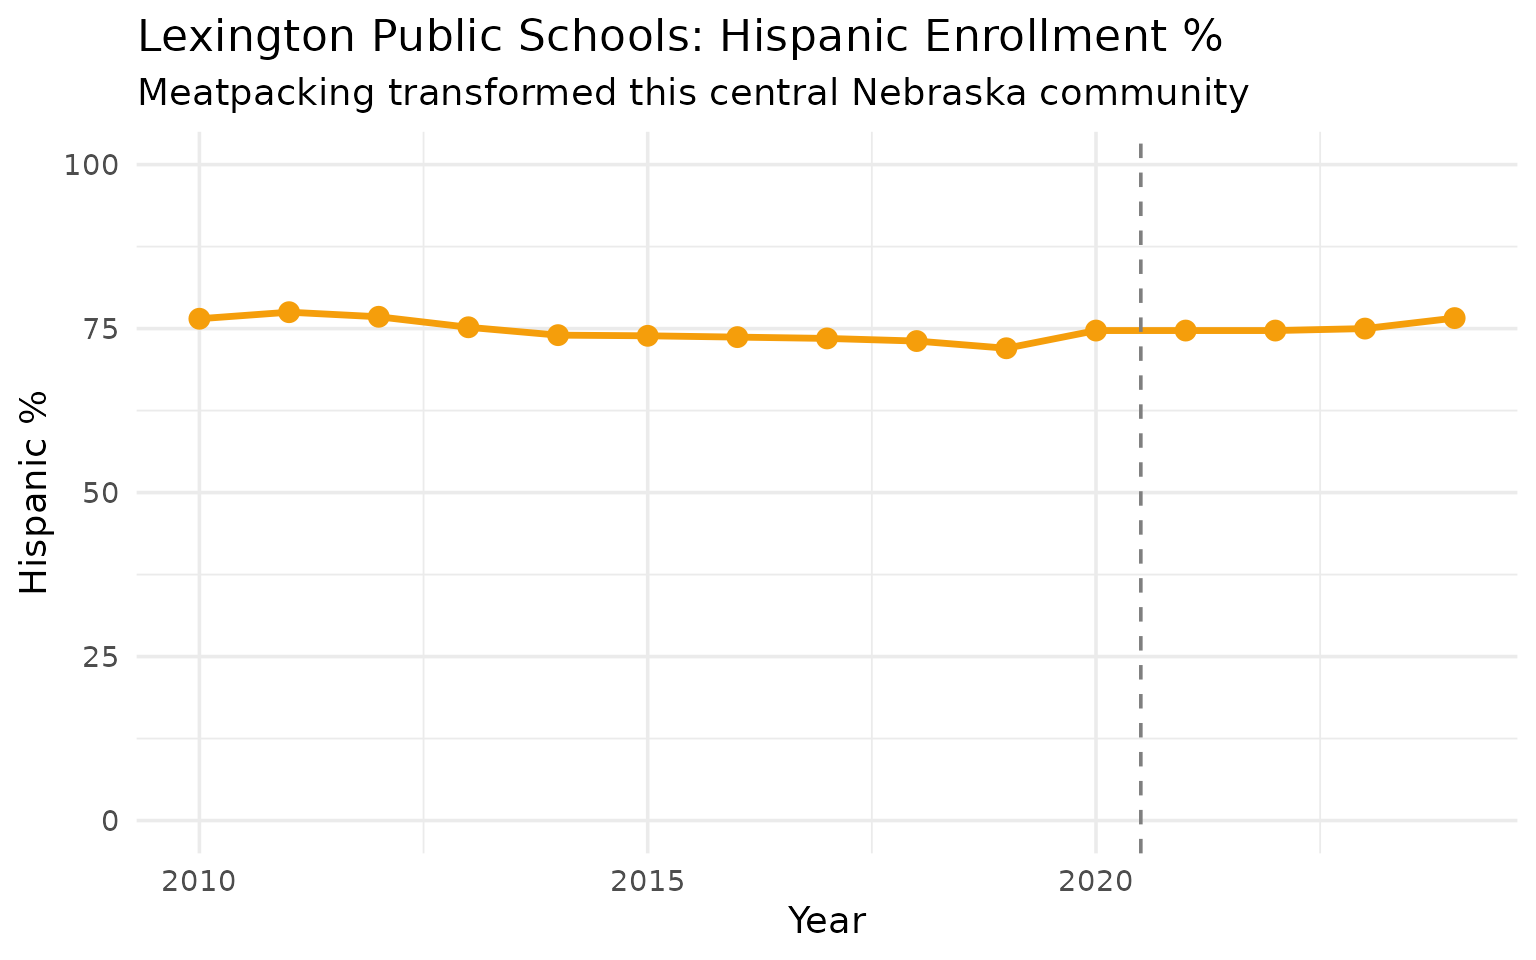
3. Lexington is 77% Hispanic – a meatpacking transformation
Tyson Foods turned this central Nebraska town from majority-white to majority-Hispanic. The percentage has held steady around 75-77% since 2010.
lexington <- enr_multi %>%
  filter(is_district, grepl("LEXINGTON", district_name, ignore.case = TRUE),
         grade_level == "TOTAL",
         subgroup %in% c("white", "hispanic", "total_enrollment")) %>%
  select(end_year, subgroup, n_students) %>%
  pivot_wider(names_from = subgroup, values_from = n_students) %>%
  mutate(hispanic_pct = round(hispanic / total_enrollment * 100, 1))

stopifnot(nrow(lexington) > 0)
lexington %>%
  filter(end_year %in% c(2010, 2015, 2020, 2024))
#>   end_year total_enrollment white hispanic hispanic_pct
#> 1     2010             2804   485     2146         76.5
#> 2     2015             2995   484     2214         73.9
#> 3     2020             3169   444     2368         74.7
#> 4     2024             3229   400     2474         76.6
77% Hispanic and growing. Lexington’s enrollment grew 15% since 2010 while its white student population shrank.
Data Taxonomy
| Category | Years | Function | Details |
|---|---|---|---|
| Enrollment | 2003-2024 |
fetch_enr() / fetch_enr_multi()
|
State, district, school. Race, gender |
| Assessments | — | — | Not yet available |
| Graduation | — | — | Not yet available |
| Directory | current | fetch_directory() |
Superintendents, principals, admin |
| Per-Pupil Spending | — | — | Not yet available |
| Accountability | — | — | Not yet available |
| Chronic Absence | — | — | Not yet available |
| EL Progress | — | — | Not yet available |
| Special Ed | — | — | Not yet available |
See the full data category taxonomy for what each category covers.
Quick Start
R
# install.packages("remotes")
remotes::install_github("almartin82/neschooldata")

library(neschooldata)
library(dplyr)

# Fetch one year
enr_2024 <- fetch_enr(2024)

# Fetch multiple years
enr_recent <- fetch_enr_multi(2019:2024)

# State totals
enr_2024 %>%
  filter(is_state, subgroup == "total_enrollment", grade_level == "TOTAL")

# District breakdown
enr_2024 %>%
  filter(is_district, subgroup == "total_enrollment", grade_level == "TOTAL") %>%
  arrange(desc(n_students))

# Demographics by race
enr_2024 %>%
  filter(is_state, grade_level == "TOTAL",
         subgroup %in% c("white", "hispanic", "black", "asian"))
Python
import pyneschooldata as ne

# Fetch 2024 data (2023-24 school year)
enr = ne.fetch_enr(2024)

# Statewide total
total = enr[enr['is_state'] & (enr['grade_level'] == 'TOTAL') & (enr['subgroup'] == 'total_enrollment')]['n_students'].sum()
print(f"{total:,} students")
#> 365,467 students

# Get multiple years
enr_multi = ne.fetch_enr_multi([2020, 2021, 2022, 2023, 2024])

# Check available years
years = ne.get_available_years()
print(f"Data available: {years['min_year']}-{years['max_year']}")
#> Data available: 2003-2024
Explore More
Full analysis with 15 stories: - 15 Insights from Nebraska School Enrollment Data – 15 stories - Function reference
Data Notes
Data Source
Nebraska Department of Education: education.ne.gov
Available Years
| Years | Source | Notes |
|---|---|---|
| 2018-2024 | NDE CSV | Modern format with full demographics |
| 2011-2017 | NDE TXT | Full race/ethnicity breakdown |
| 2003-2010 | NDE TXT | Legacy format (Asian/Pacific Islander combined) |
What’s included
- Levels: State, district (~423), school (~1,215)
- Demographics: White, Black, Hispanic, Asian, Native American, Pacific Islander, Two or More Races
- Gender: Male, Female
- Grade levels: PK-12 plus totals
Census Day
Enrollment counts are collected on the last Friday in September each year (Nebraska’s “Count Day”). This is the official date for state funding purposes.
Deeper Dive
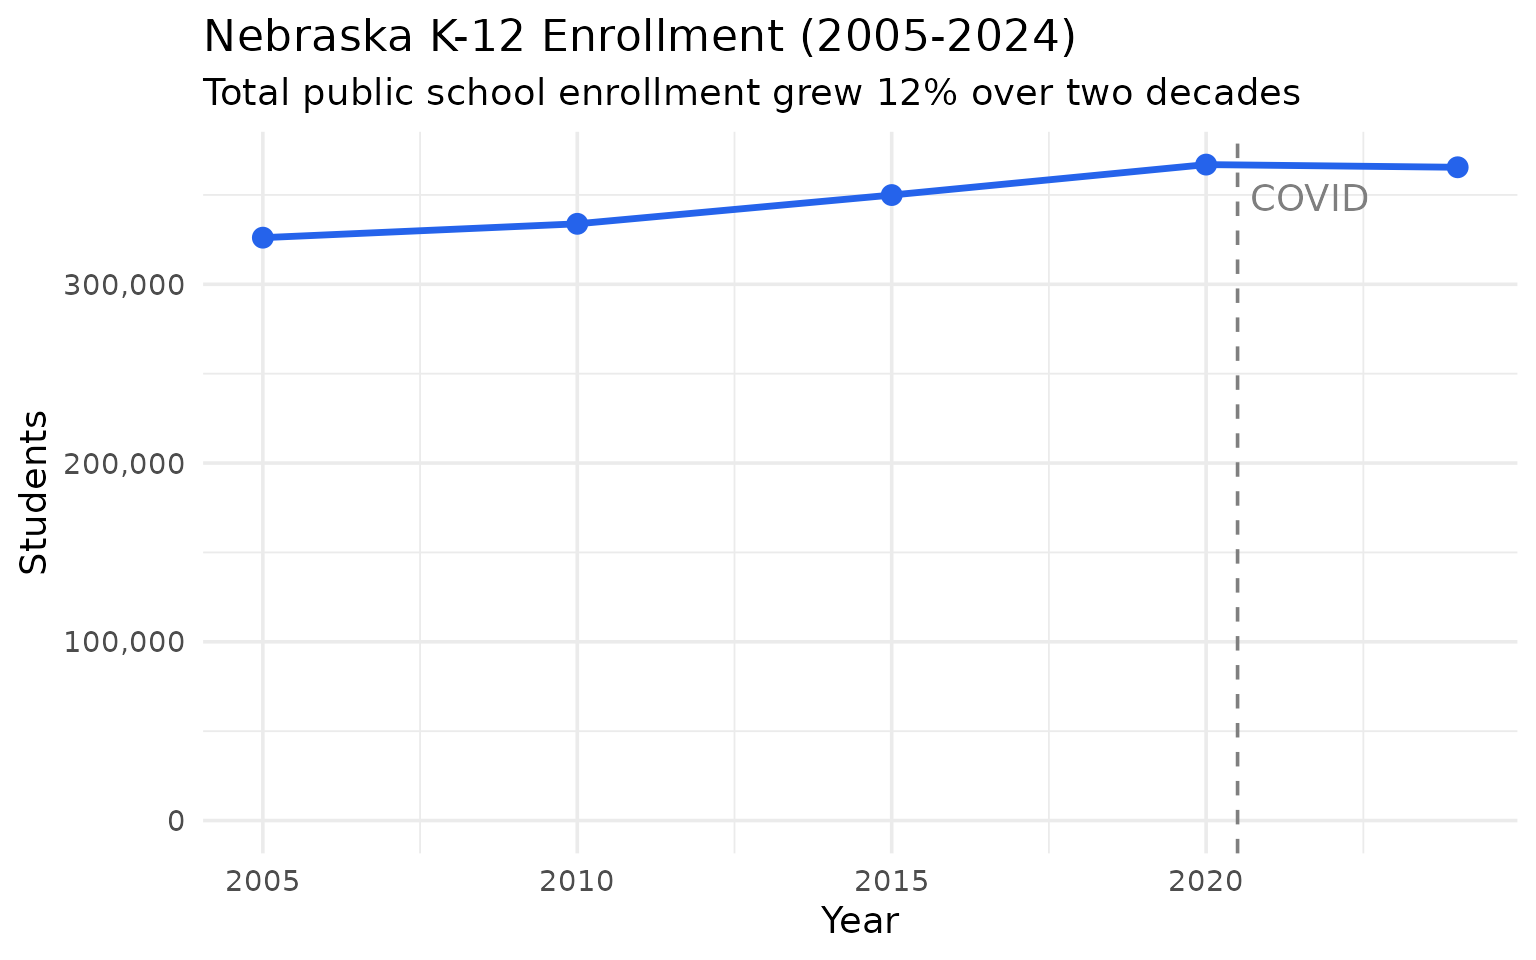
4. Nebraska added 39,000 students between 2005 and 2024
Two decades of steady growth – though the pandemic peak in 2020 was actually higher than 2024.
enr <- fetch_enr_multi(c(2005, 2010, 2015, 2020, 2024), use_cache = TRUE)

statewide <- enr %>%
  filter(is_state, subgroup == "total_enrollment", grade_level == "TOTAL") %>%
  select(end_year, n_students)

stopifnot(nrow(statewide) > 0)
statewide
#>   end_year n_students
#> 1     2005     326083
#> 2     2010     333835
#> 3     2015     349925
#> 4     2020     366966
#> 5     2024     365467
+39,384 students (+12%) in 19 years. Growth stalled slightly after the 2020 pandemic peak.
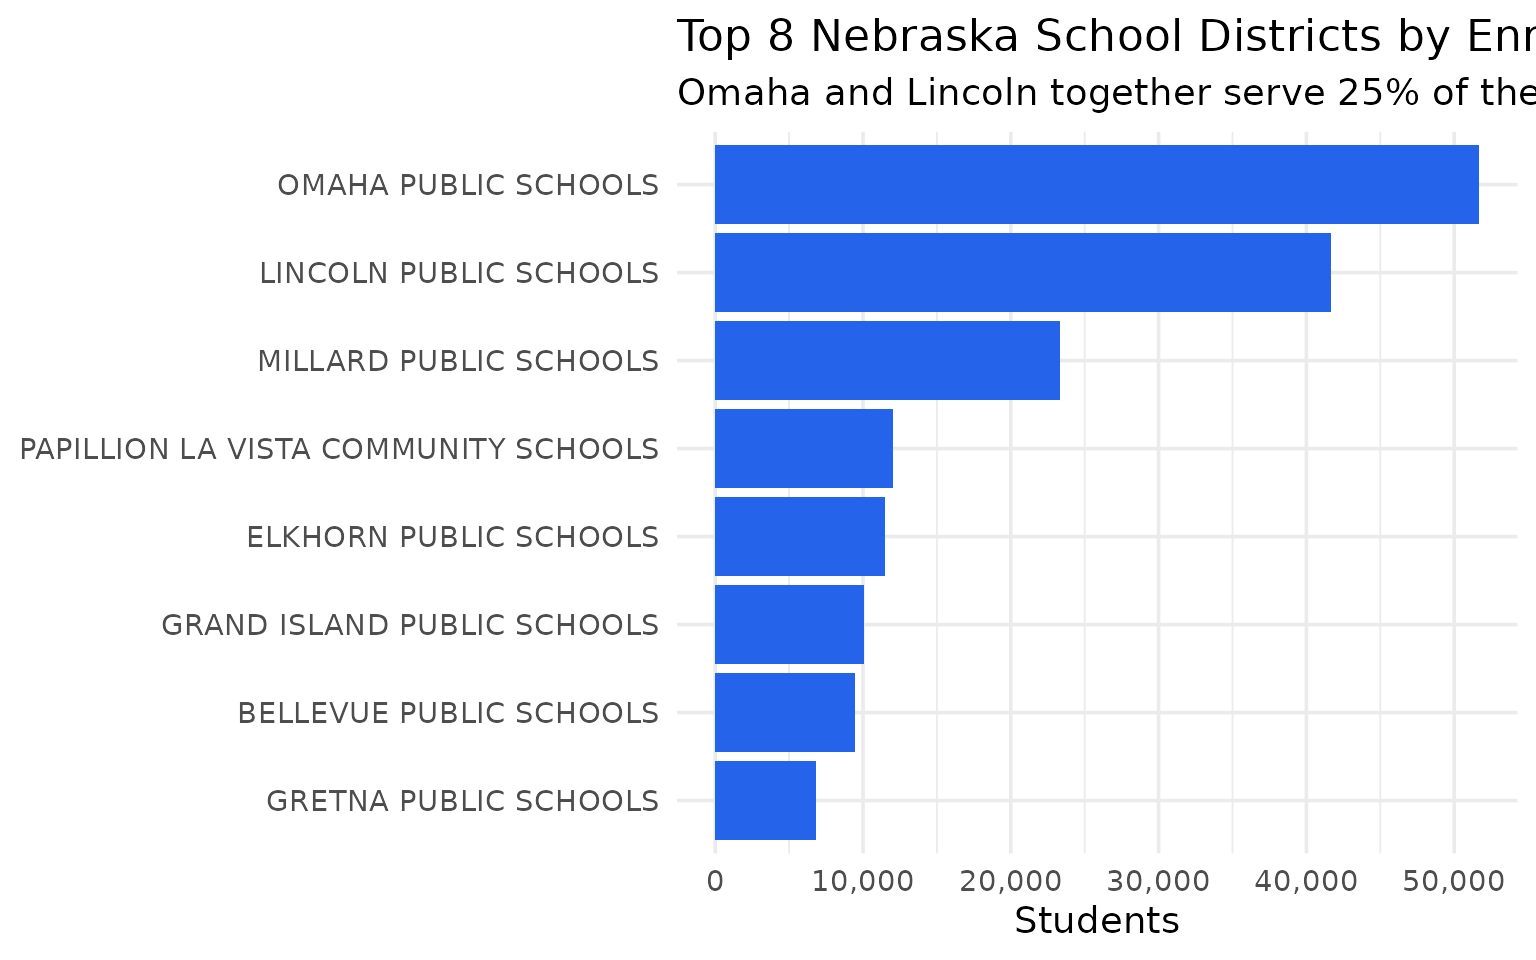
5. Omaha and Lincoln enroll a quarter of all Nebraska students
The two cities anchor the state’s education system – but they are far from half.
enr_2024 <- fetch_enr(2024, use_cache = TRUE)

top_districts <- enr_2024 %>%
  filter(is_district, subgroup == "total_enrollment", grade_level == "TOTAL") %>%
  arrange(desc(n_students)) %>%
  head(8) %>%
  select(district_name, n_students)

stopifnot(nrow(top_districts) > 0)
top_districts
#>                          district_name n_students
#> 1                 OMAHA PUBLIC SCHOOLS      51693
#> 2               LINCOLN PUBLIC SCHOOLS      41654
#> 3               MILLARD PUBLIC SCHOOLS      23300
#> 4 PAPILLION LA VISTA COMMUNITY SCHOOLS      12039
#> 5               ELKHORN PUBLIC SCHOOLS      11455
#> 6          GRAND ISLAND PUBLIC SCHOOLS      10070
#> 7              BELLEVUE PUBLIC SCHOOLS       9444
#> 8                GRETNA PUBLIC SCHOOLS       6788
Omaha + Lincoln: 93,347 students. That’s 25.5% of the state in two districts.
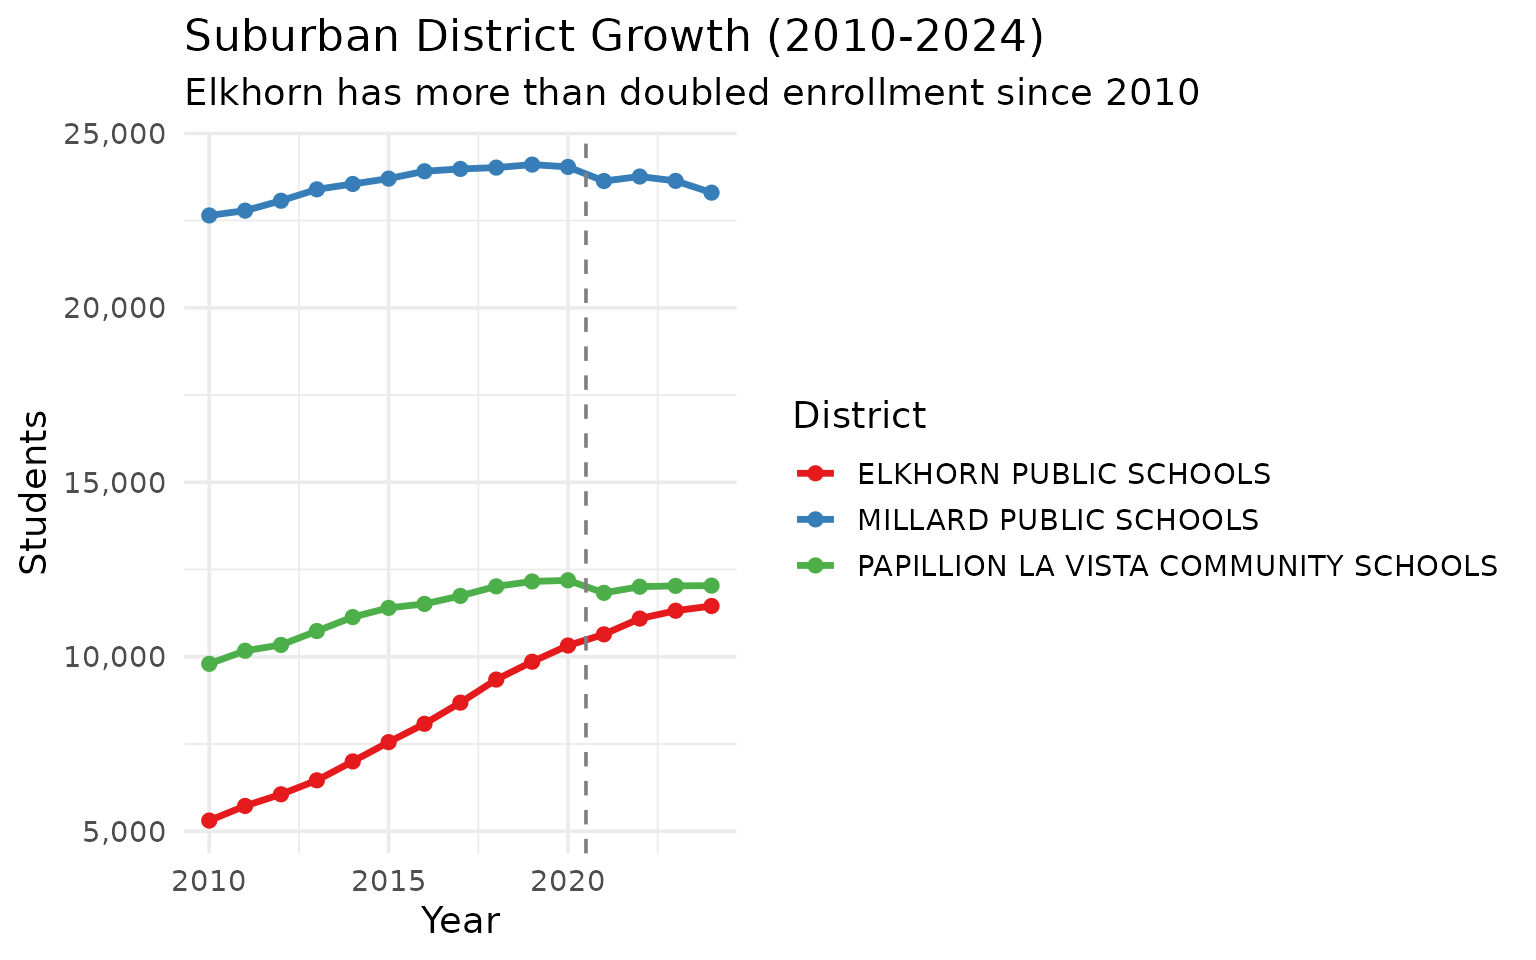
6. Elkhorn doubled enrollment since 2010
This Omaha suburb grew from 5,300 to 11,500 students in 14 years – the fastest growth in metro Omaha.
enr_multi <- fetch_enr_multi(2010:2024, use_cache = TRUE)

suburban <- enr_multi %>%
  filter(is_district, subgroup == "total_enrollment", grade_level == "TOTAL",
         district_name %in% c("ELKHORN PUBLIC SCHOOLS", "MILLARD PUBLIC SCHOOLS")) %>%
  select(end_year, district_name, n_students)

# Papillion changed names in 2017; combine under one label
papillion <- enr_multi %>%
  filter(is_district, subgroup == "total_enrollment", grade_level == "TOTAL",
         grepl("PAPILLION", district_name)) %>%
  mutate(district_name = "PAPILLION LA VISTA COMMUNITY SCHOOLS") %>%
  select(end_year, district_name, n_students)

suburban <- bind_rows(suburban, papillion)

stopifnot(nrow(suburban) > 0)
suburban %>%
  filter(end_year %in% c(2010, 2015, 2020, 2024)) %>%
  pivot_wider(names_from = end_year, values_from = n_students)
#>                          district_name `2010` `2015` `2020` `2024`
#> 1               ELKHORN PUBLIC SCHOOLS   5306   7553  10322  11455
#> 2               MILLARD PUBLIC SCHOOLS  22647  23702  24038  23300
#> 3 PAPILLION LA VISTA COMMUNITY SCHOOLS   9797  11401  12190  12039
+116% growth for Elkhorn since 2010. Millard and Papillion were essentially flat.
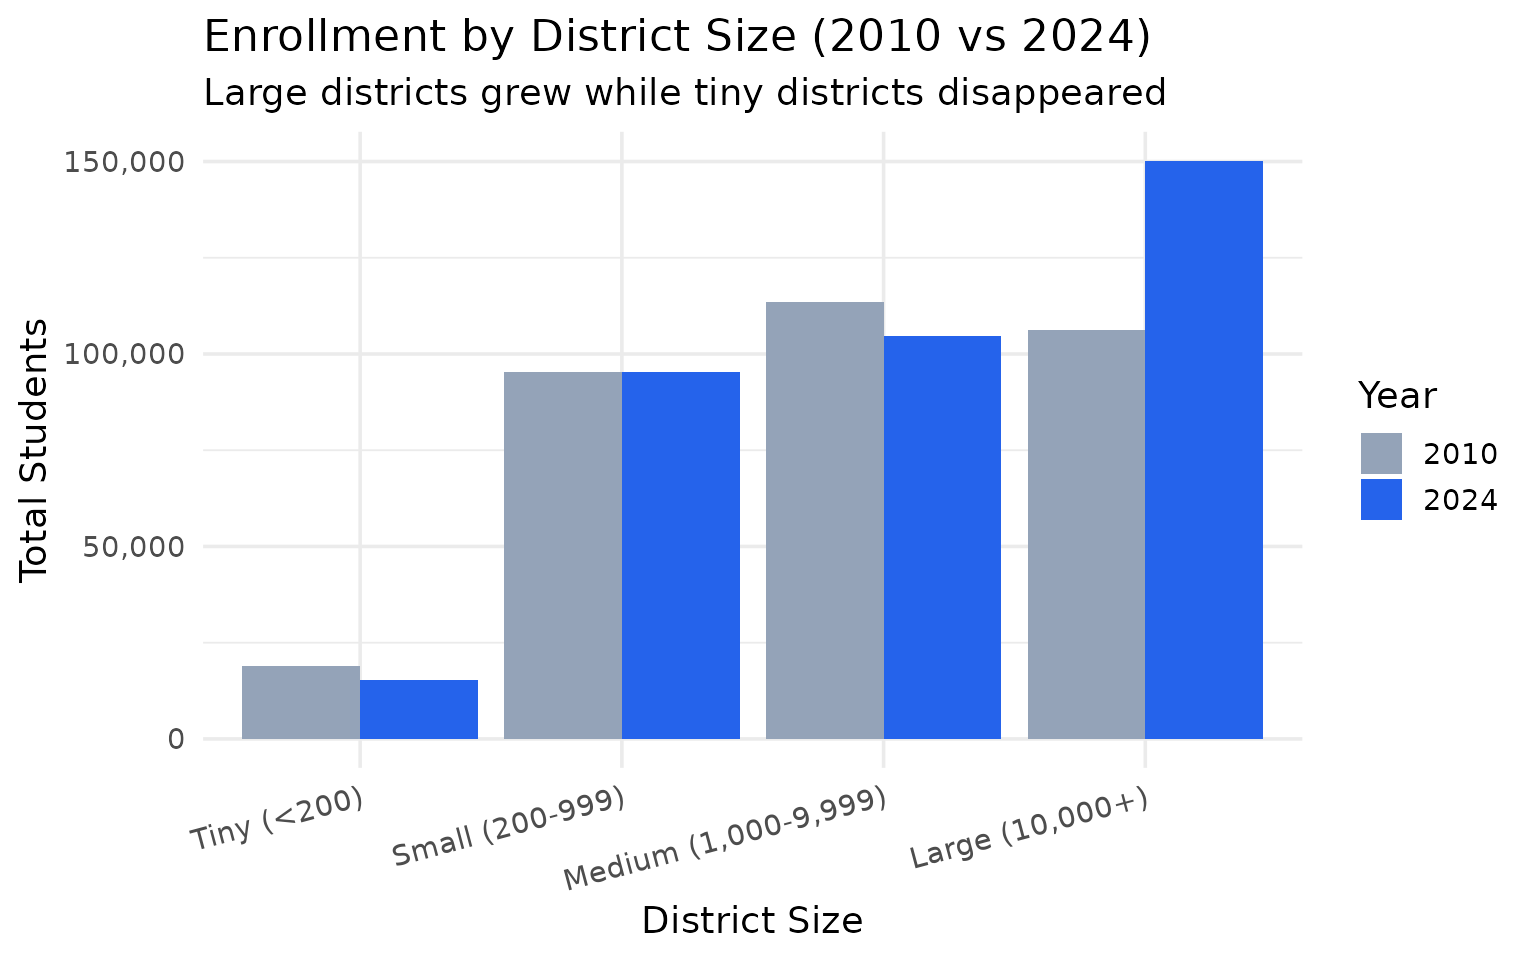
7. 43 fewer tiny districts since 2010
Districts with fewer than 200 students dropped from 198 to 155 – consolidation in action.
regional <- enr_multi %>%
  filter(is_district, subgroup == "total_enrollment", grade_level == "TOTAL") %>%
  filter(end_year %in% c(2010, 2024)) %>%
  mutate(size = case_when(
    n_students >= 10000 ~ "Large (10,000+)",
    n_students >= 1000 ~ "Medium (1,000-9,999)",
    n_students >= 200 ~ "Small (200-999)",
    TRUE ~ "Tiny (<200)"
  )) %>%
  group_by(end_year, size) %>%
  summarize(n_districts = n(), total_students = sum(n_students), .groups = "drop")

stopifnot(nrow(regional) > 0)
regional %>%
  pivot_wider(names_from = end_year, values_from = c(n_districts, total_students))
#>                  size n_districts_2010 n_districts_2024 total_students_2010 total_students_2024
#> 1      Large (10,000+)               3                6              106250              150211
#> 2 Medium (1,000-9,999)              38               38              113409              104607
#> 3      Small (200-999)             224              224               95267               95214
#> 4          Tiny (<200)             198              155               18909               15435
43 fewer tiny districts since 2010. Large districts doubled from 3 to 6, absorbing most of the growth.
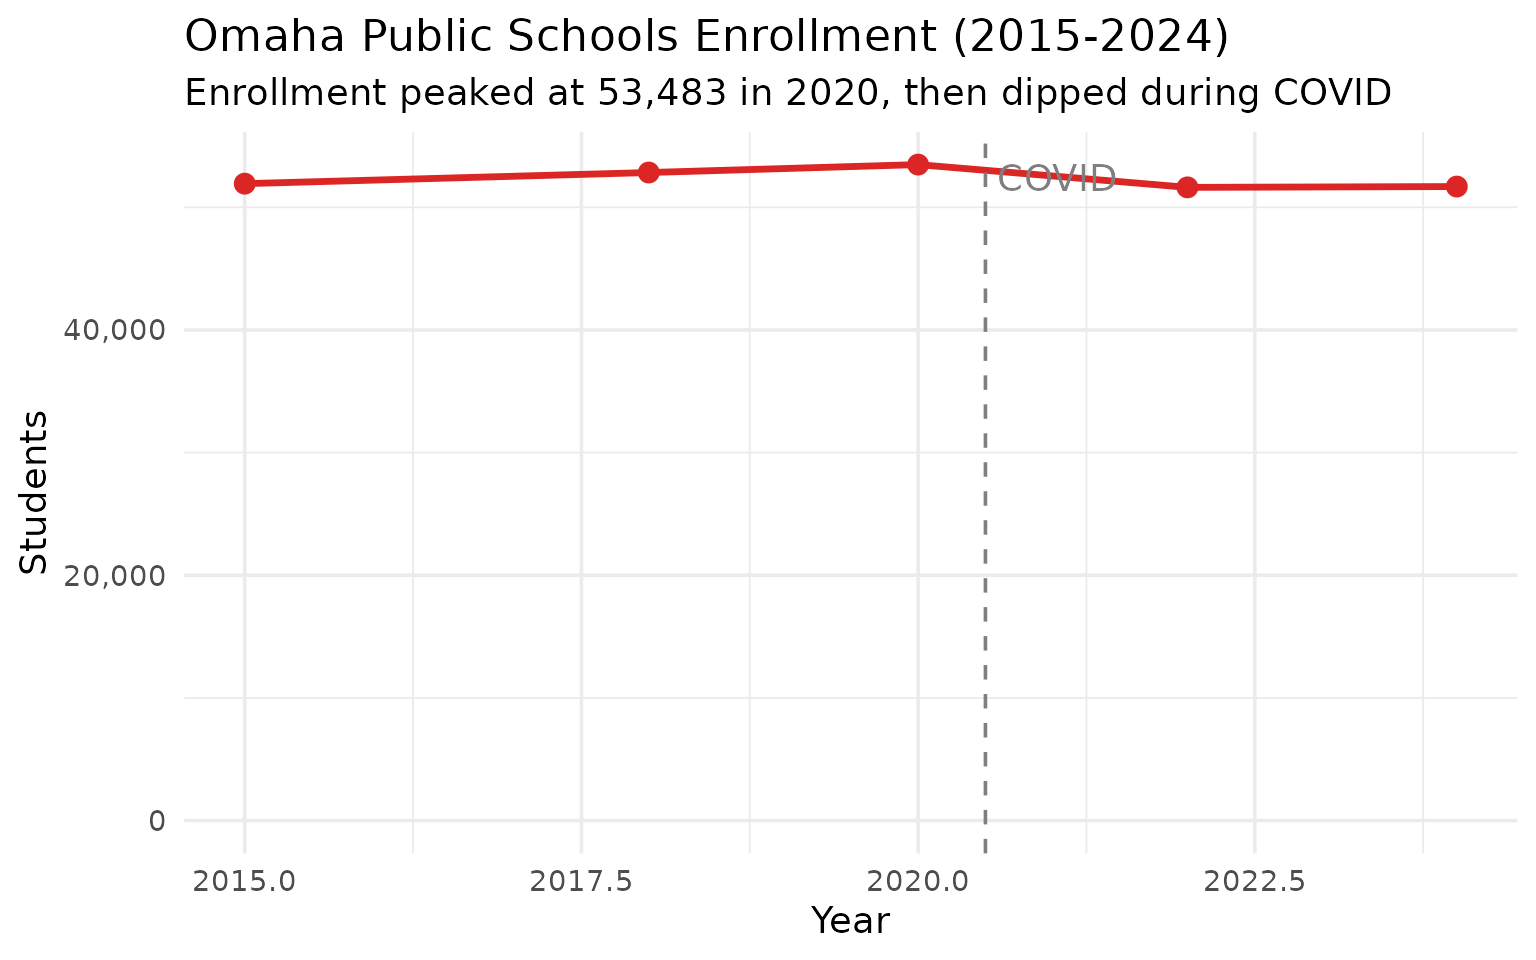
8. Omaha Public Schools enrollment held steady since 2015
Despite suburban growth, OPS barely changed – from 51,928 in 2015 to 51,693 in 2024.
omaha <- enr_multi %>%
  filter(is_district, subgroup == "total_enrollment", grade_level == "TOTAL",
         district_name == "OMAHA PUBLIC SCHOOLS") %>%
  filter(end_year %in% c(2015, 2018, 2020, 2022, 2024)) %>%
  select(end_year, n_students) %>%
  mutate(change = n_students - lag(n_students))

stopifnot(nrow(omaha) > 0)
omaha
#>   end_year n_students change
#> 1     2015      51928     NA
#> 2     2018      52836    908
#> 3     2020      53483    647
#> 4     2022      51626  -1857
#> 5     2024      51693     67
-235 students (-0.5%) over 9 years. OPS actually peaked at 53,483 in 2020 before COVID dipped enrollment.
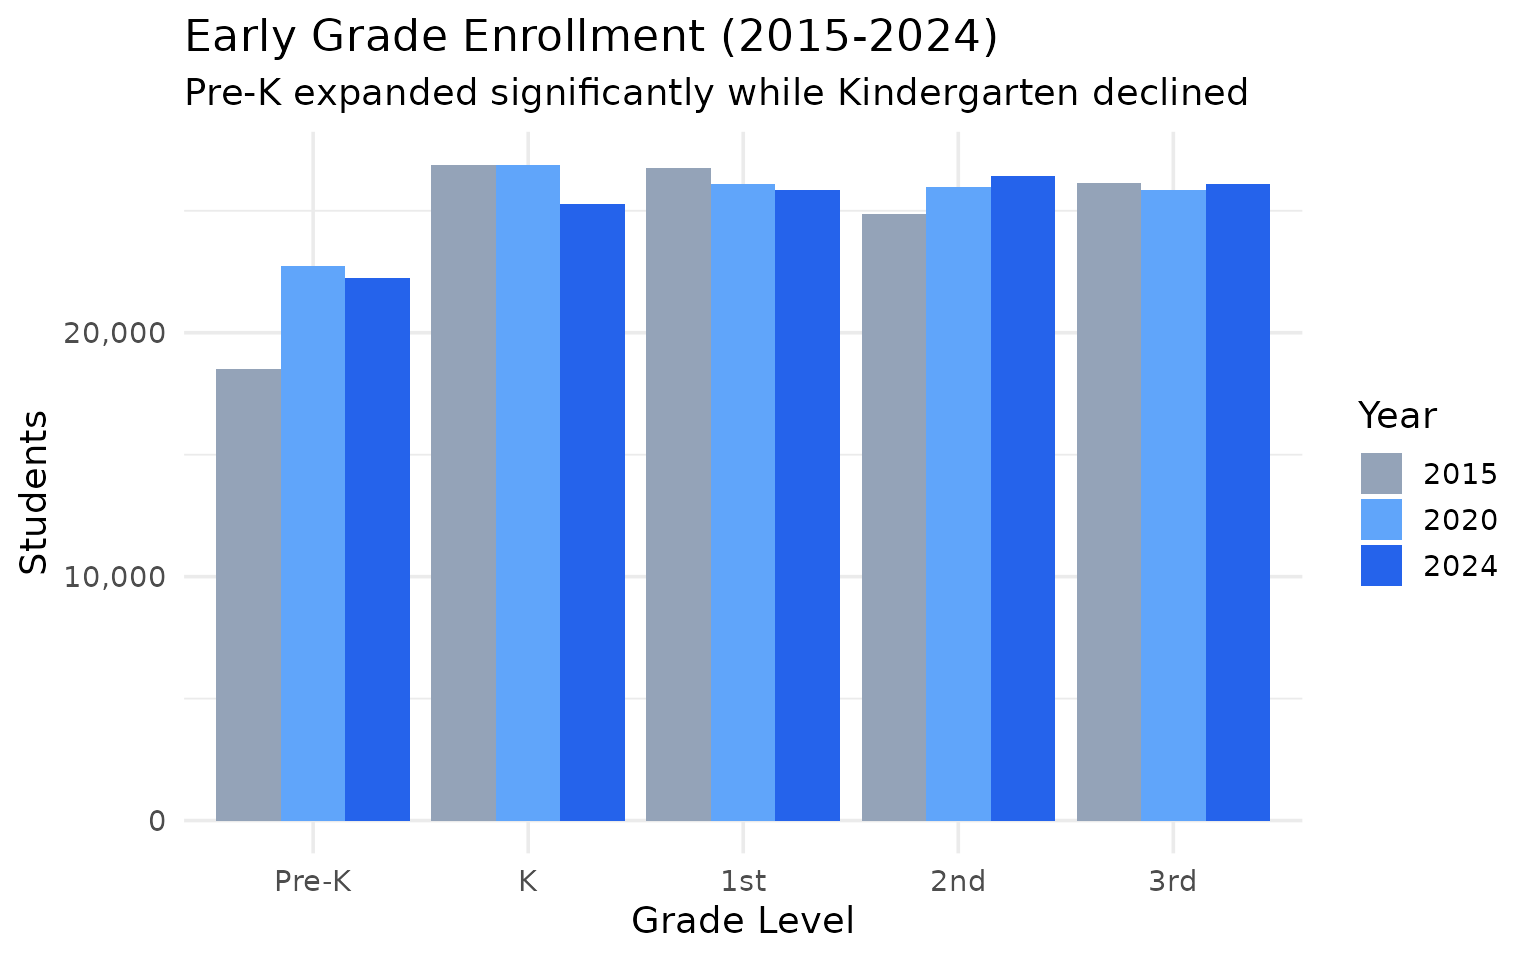
9. Pre-K grew by 3,768 while Kindergarten shrank by 1,589
Nebraska expanded early childhood access – Pre-K jumped from 18,493 to 22,261 since 2015.
grades <- enr_multi %>%
  filter(is_state, subgroup == "total_enrollment",
         grade_level %in% c("PK", "K", "01", "02", "03")) %>%
  filter(end_year %in% c(2015, 2020, 2024)) %>%
  select(end_year, grade_level, n_students)

stopifnot(nrow(grades) > 0)
grades %>%
  pivot_wider(names_from = end_year, values_from = n_students) %>%
  mutate(change_15_24 = `2024` - `2015`)
#>   grade_level `2015` `2020` `2024` change_15_24
#> 1          01  26735  26111  25850         -885
#> 2          02  24853  25991  26415         1562
#> 3          03  26137  25865  26085          -52
#> 4           K  26867  26893  25278        -1589
#> 5          PK  18493  22718  22261         3768
Pre-K: +3,768. Kindergarten: -1,589. Early childhood is expanding while K shrinks.
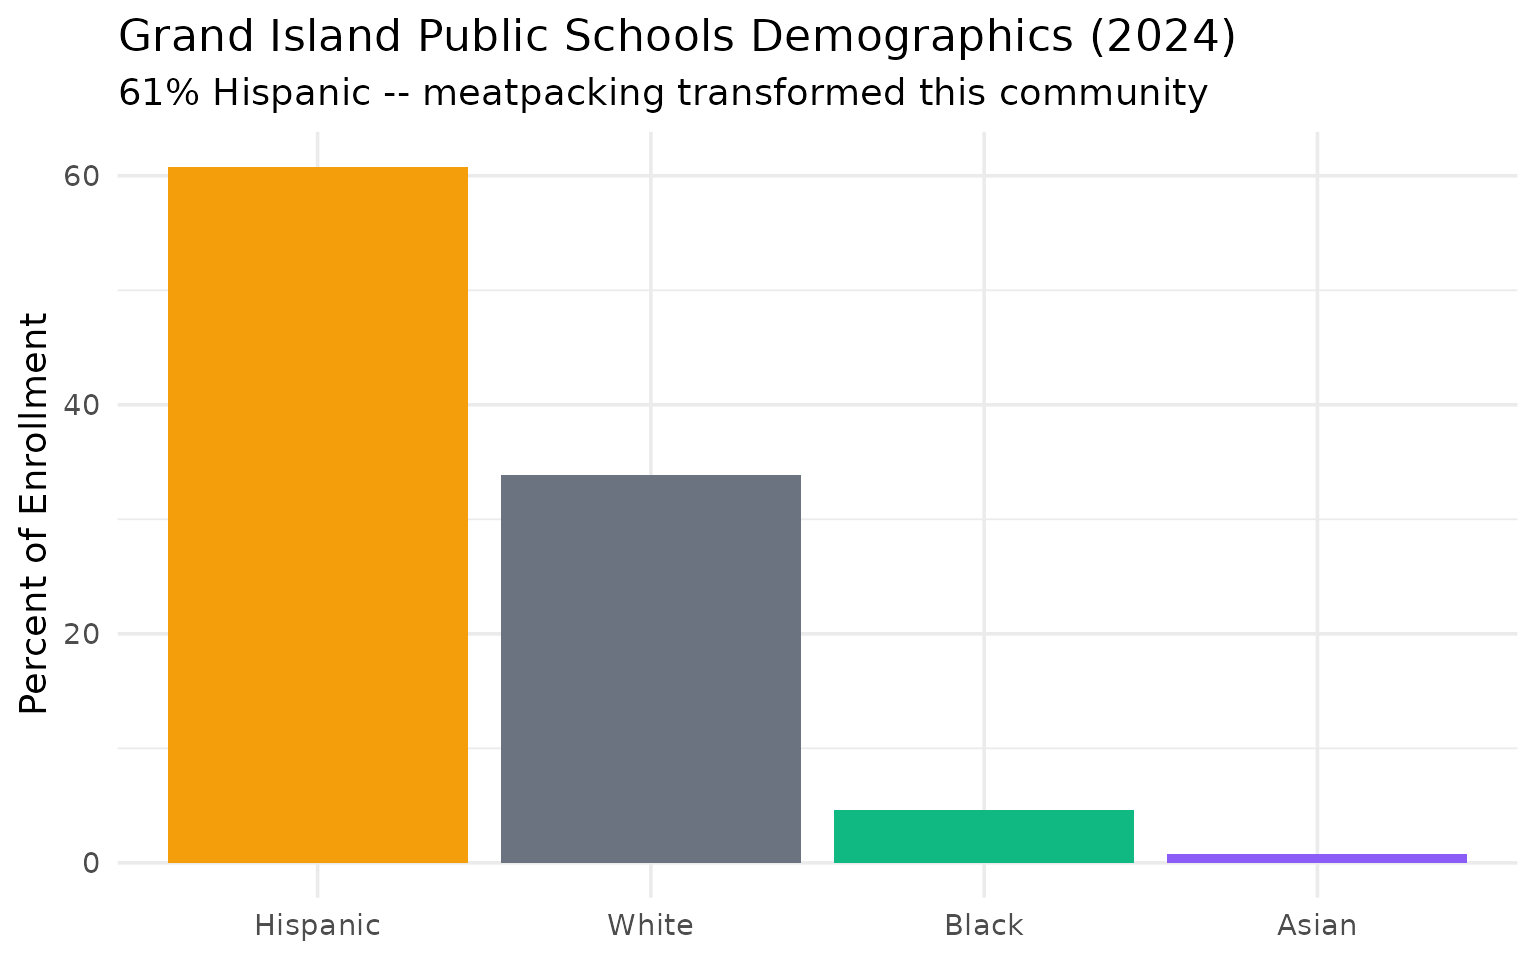
10. Grand Island is 61% Hispanic
The meatpacking industry transformed this central Nebraska city into one of the most Hispanic school districts in the Great Plains.
grand_island <- enr_2024 %>%
  filter(grepl("GRAND ISLAND", district_name, ignore.case = TRUE), is_district,
         grade_level == "TOTAL",
         subgroup %in% c("white", "hispanic", "black", "asian")) %>%
  mutate(pct = round(n_students / sum(n_students) * 100, 1)) %>%
  select(subgroup, n_students, pct) %>%
  arrange(desc(pct))

stopifnot(nrow(grand_island) > 0)
grand_island
#>   subgroup n_students  pct
#> 1 hispanic       5922 60.8
#> 2    white       3301 33.9
#> 3    black        444  4.6
#> 4    asian         79  0.8
61% Hispanic. Grand Island is one of the most demographically transformed districts in the Great Plains.
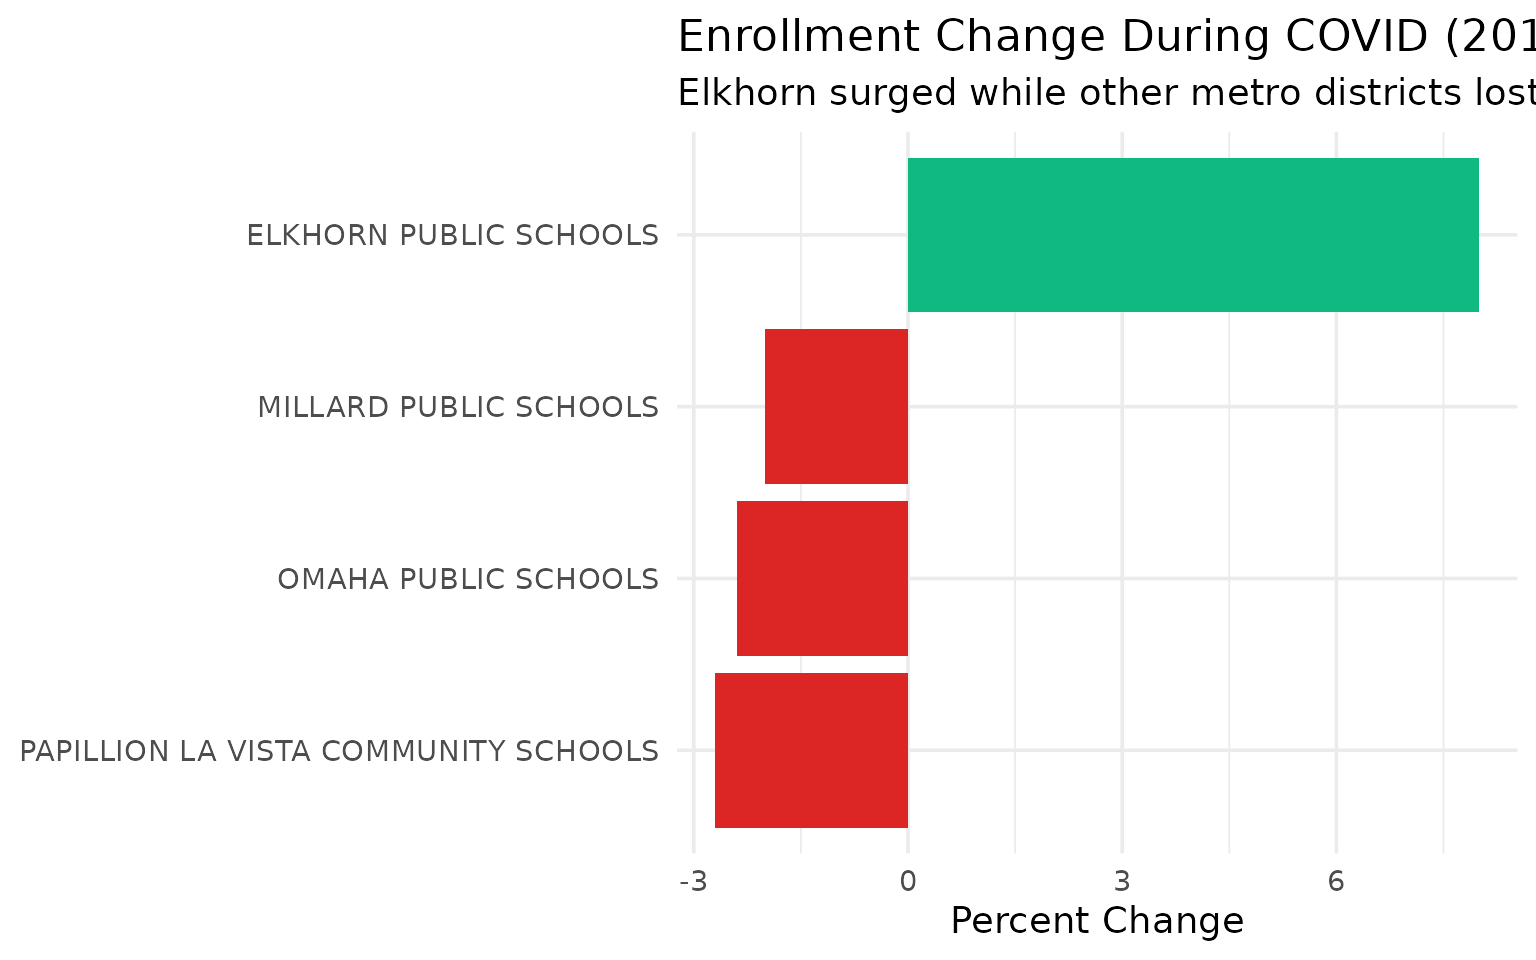
11. COVID hit Papillion and Omaha hardest, while Elkhorn surged 8%
Between 2019 and 2021, Elkhorn grew while every other major metro district shrank.
covid <- enr_multi %>%
  filter(is_district, subgroup == "total_enrollment", grade_level == "TOTAL",
         district_name %in% c("OMAHA PUBLIC SCHOOLS", "MILLARD PUBLIC SCHOOLS",
                              "ELKHORN PUBLIC SCHOOLS"),
         end_year %in% c(2019, 2021)) %>%
  select(district_name, end_year, n_students)

# Handle Papillion name change
papillion_covid <- enr_multi %>%
  filter(is_district, subgroup == "total_enrollment", grade_level == "TOTAL",
         grepl("PAPILLION", district_name),
         end_year %in% c(2019, 2021)) %>%
  mutate(district_name = "PAPILLION LA VISTA COMMUNITY SCHOOLS") %>%
  select(district_name, end_year, n_students)

covid <- bind_rows(covid, papillion_covid) %>%
  pivot_wider(names_from = end_year, values_from = n_students) %>%
  rename(y2019 = `2019`, y2021 = `2021`) %>%
  mutate(pct_change = round((y2021 - y2019) / y2019 * 100, 1)) %>%
  arrange(pct_change)

stopifnot(nrow(covid) > 0)
covid
#>                          district_name y2019 y2021 pct_change
#> 1 PAPILLION LA VISTA COMMUNITY SCHOOLS 12158 11831       -2.7
#> 2                 OMAHA PUBLIC SCHOOLS 53194 51914       -2.4
#> 3               MILLARD PUBLIC SCHOOLS 24104 23633       -2.0
#> 4               ELKHORN PUBLIC SCHOOLS  9857 10642        8.0
Papillion: -2.7%. Omaha: -2.4%. Elkhorn: +8.0%. Suburban flight accelerated during COVID.
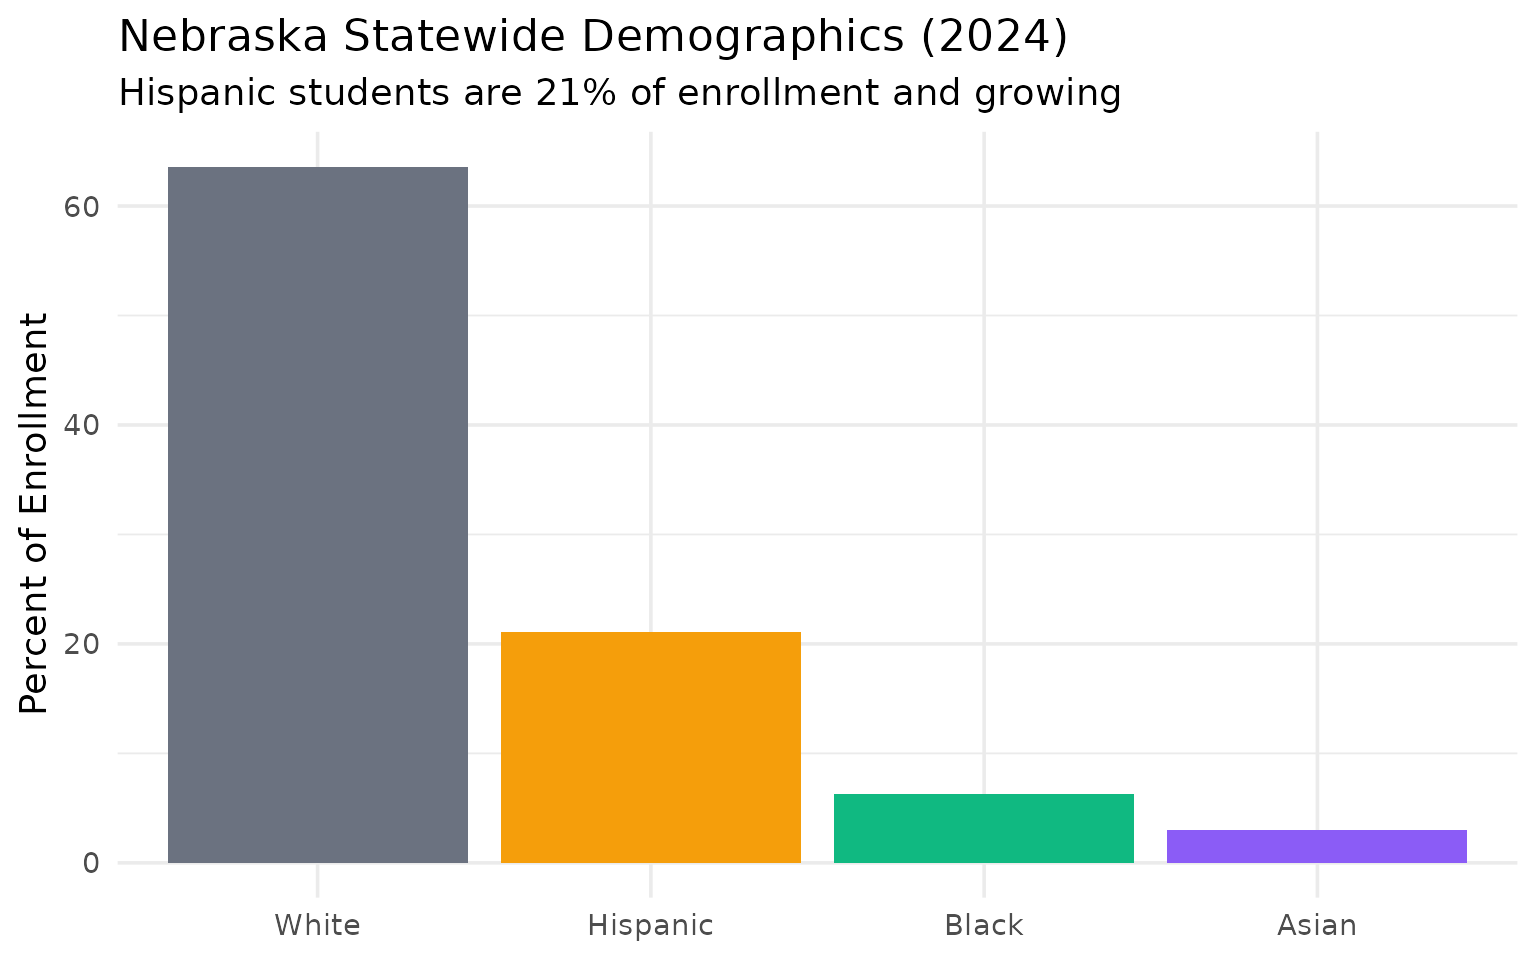
12. Hispanic students are 21% of the state and growing
Nebraska’s 76,933 Hispanic students are the fastest-growing demographic group.
diversity <- enr_2024 %>%
  filter(is_state, grade_level == "TOTAL") %>%
  filter(subgroup %in% c("total_enrollment", "hispanic", "white", "black", "asian")) %>%
  select(subgroup, n_students) %>%
  mutate(pct = round(n_students / max(n_students) * 100, 1))

stopifnot(nrow(diversity) > 0)
diversity
#>          subgroup n_students   pct
#> 1 total_enrollment     365467 100.0
#> 2            white     232394  63.6
#> 3            black      23100   6.3
#> 4         hispanic      76933  21.1
#> 5            asian      11061   3.0
21% Hispanic statewide, up from 10% in 2005. The demographic shift continues.
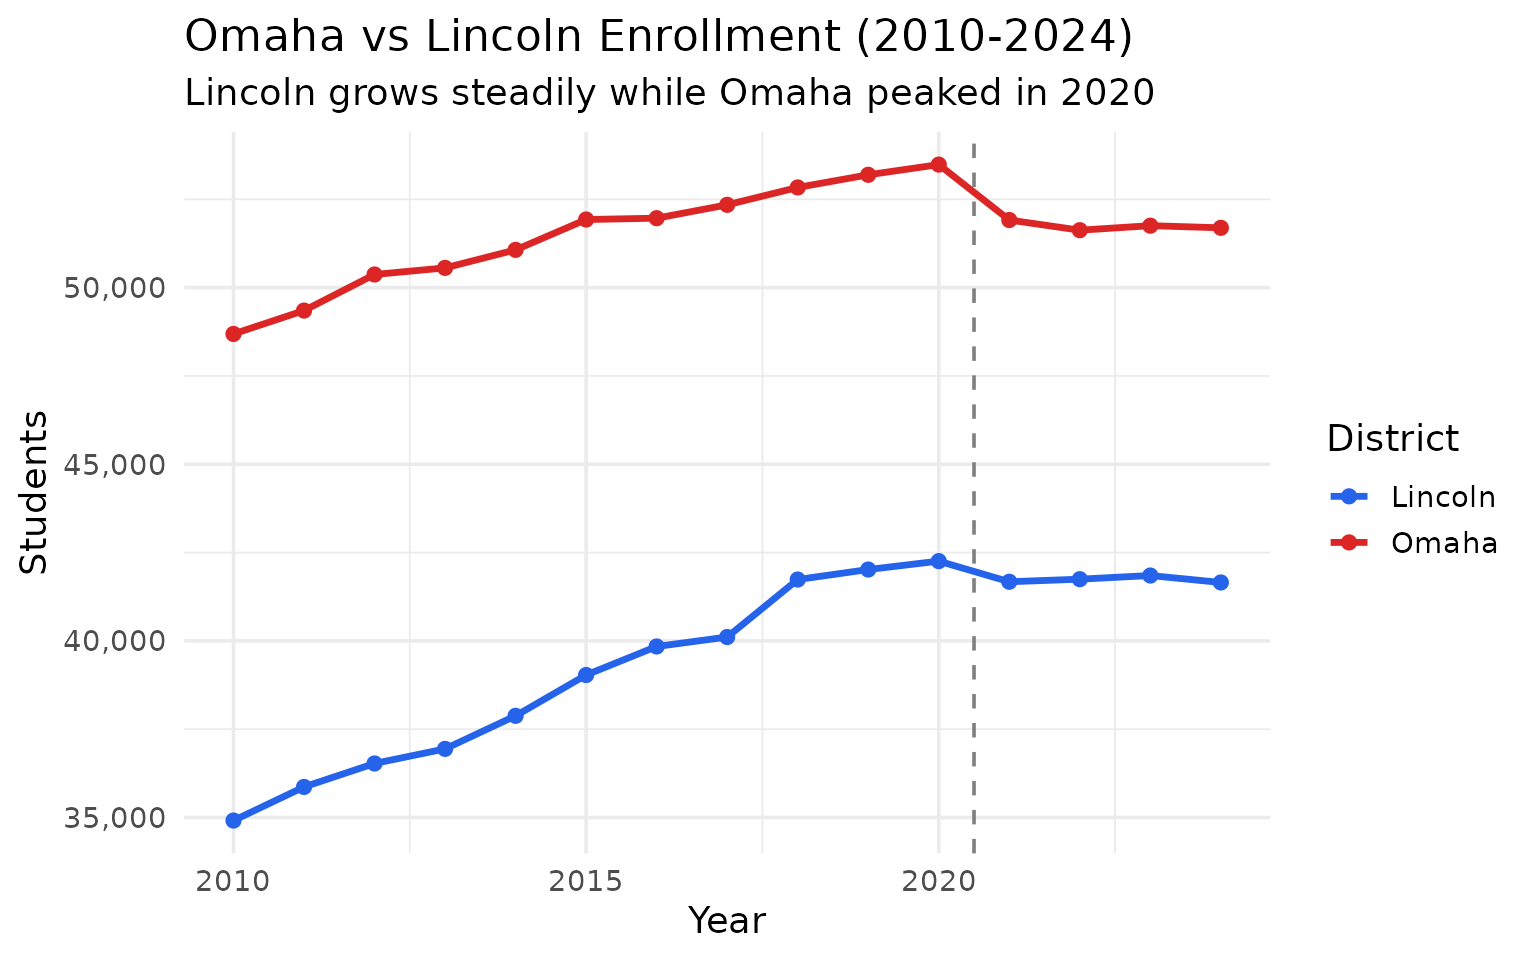
13. Lincoln is gaining on Omaha
Lincoln Public Schools added 6,740 students since 2010. The gap between the two districts narrowed from 13,775 to 10,039.
two_cities <- enr_multi %>%
  filter(is_district, subgroup == "total_enrollment", grade_level == "TOTAL",
         grepl("OMAHA PUBLIC|LINCOLN PUBLIC", district_name, ignore.case = TRUE)) %>%
  mutate(city = if_else(grepl("OMAHA", district_name, ignore.case = TRUE), "Omaha", "Lincoln")) %>%
  select(end_year, city, n_students)

stopifnot(nrow(two_cities) > 0)
two_cities %>%
  pivot_wider(names_from = city, values_from = n_students) %>%
  filter(end_year %in% c(2010, 2015, 2020, 2024)) %>%
  mutate(gap = Omaha - Lincoln)
#>   end_year Omaha Lincoln   gap
#> 1     2010 48689   34914 13775
#> 2     2015 51928   39034 12894
#> 3     2020 53483   42258 11225
#> 4     2024 51693   41654 10039
Lincoln: +6,740 (+19%). Omaha: +3,004 (+6%). The gap narrowed by 3,736 students.
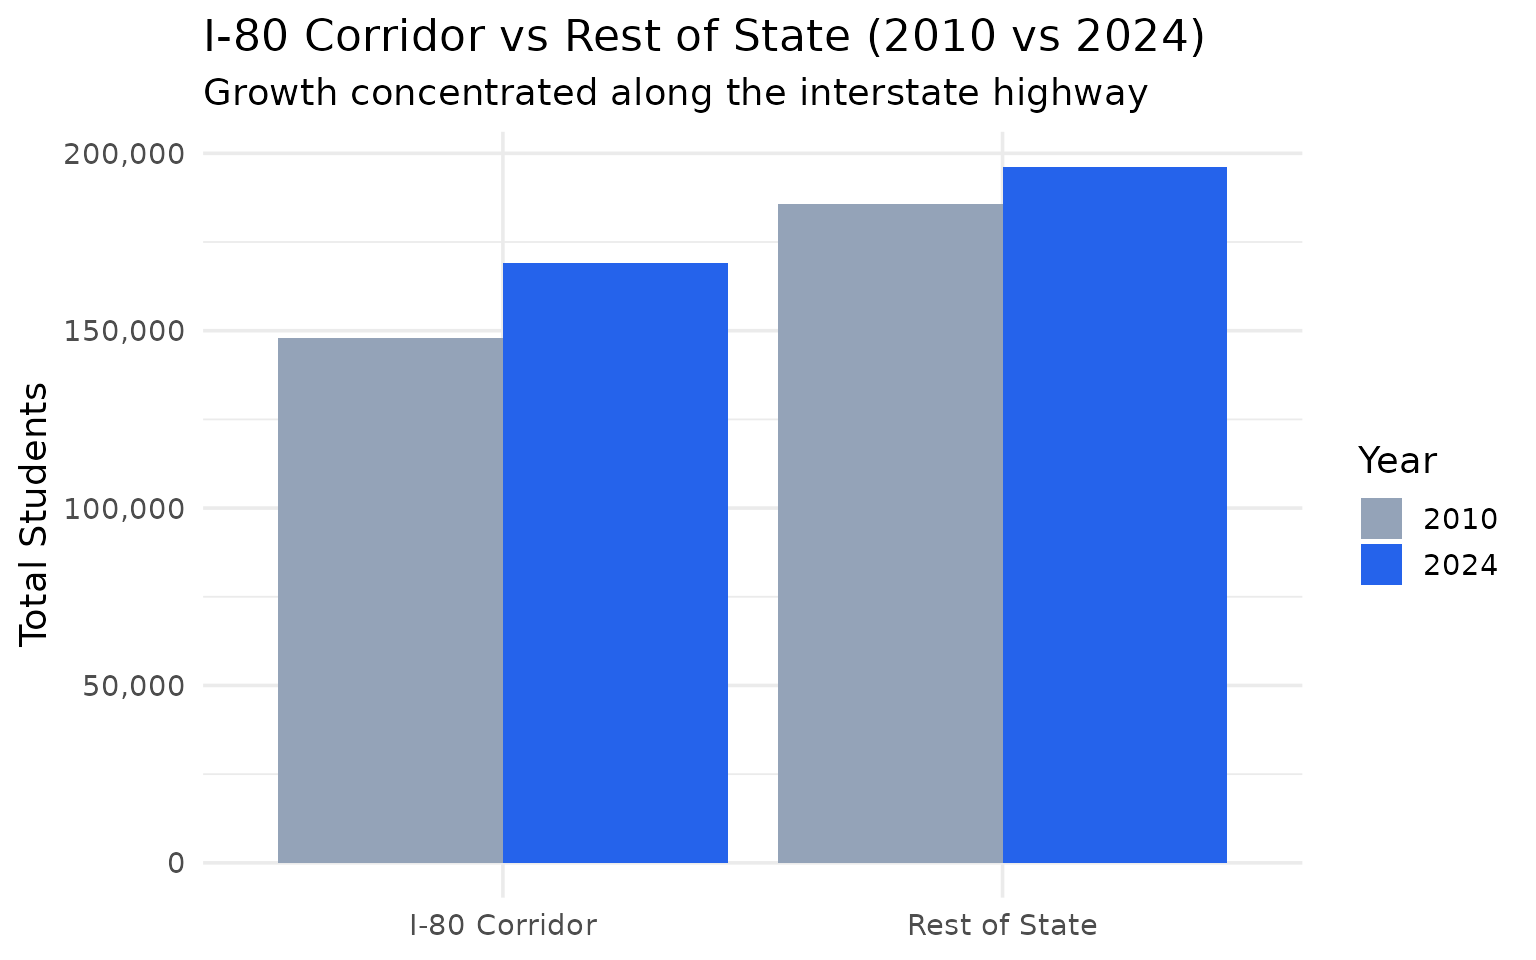
14. The I-80 corridor gained 21,000 students while the rest of the state grew too
Districts along Interstate 80 from Omaha to Kearney hold 46% of all students but captured most of the growth.
# Major I-80 districts: Omaha metro, Lincoln, Grand Island, Kearney
i80_patterns <- c("OMAHA", "LINCOLN", "MILLARD", "PAPILLION", "BELLEVUE",
                  "ELKHORN", "GRAND ISLAND", "KEARNEY")

i80_growth <- enr_multi %>%
  filter(is_district, subgroup == "total_enrollment", grade_level == "TOTAL",
         end_year %in% c(2010, 2024)) %>%
  rowwise() %>%
  mutate(is_i80 = any(sapply(i80_patterns, function(x) grepl(x, district_name, ignore.case = TRUE)))) %>%
  ungroup() %>%
  group_by(end_year, is_i80) %>%
  summarize(total = sum(n_students), n_districts = n(), .groups = "drop") %>%
  mutate(region = if_else(is_i80, "I-80 Corridor", "Rest of State"))

stopifnot(nrow(i80_growth) > 0)
i80_growth %>%
  select(end_year, region, total, n_districts) %>%
  pivot_wider(names_from = end_year, values_from = c(total, n_districts))
#>         region total_2010 total_2024 n_districts_2010 n_districts_2024
#> 1 Rest of State     185827     196252              439              402
#> 2 I-80 Corridor     148008     169215               24               21
I-80 corridor: +21,207 (+14%). Rest of state: +10,425 (+6%). Two Nebraskas growing at different speeds.
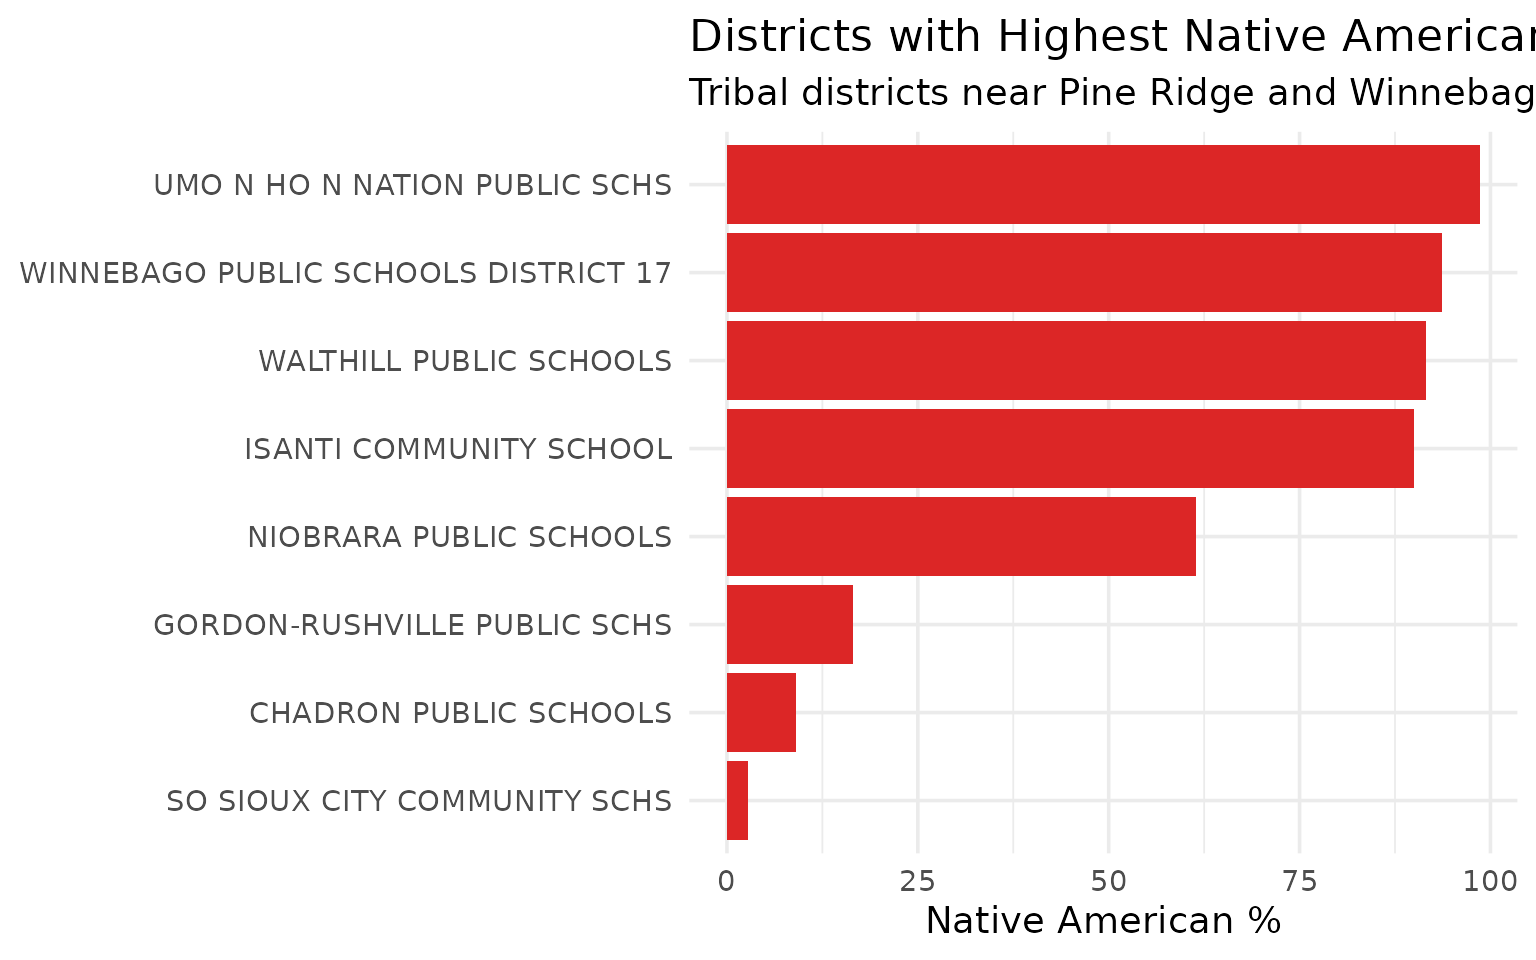
15. Tribal districts are 90-99% Native American
UMO N HO N NATION, WINNEBAGO, and WALTHILL serve predominantly Native American populations near Nebraska’s reservations.
# Look at districts with notable Native American populations
native_districts <- enr_2024 %>%
  filter(is_district, grade_level == "TOTAL",
         subgroup == "native_american") %>%
  arrange(desc(n_students)) %>%
  head(10) %>%
  select(district_name, n_students)

# Get total enrollment for these districts to calculate percentages
native_pct <- enr_2024 %>%
  filter(is_district, grade_level == "TOTAL",
         subgroup %in% c("total_enrollment", "native_american"),
         district_name %in% native_districts$district_name) %>%
  select(district_name, subgroup, n_students) %>%
  pivot_wider(names_from = subgroup, values_from = n_students) %>%
  mutate(pct = round(native_american / total_enrollment * 100, 1)) %>%
  arrange(desc(pct)) %>%
  head(8)

stopifnot(nrow(native_pct) > 0)
native_pct
#>                          district_name total_enrollment native_american  pct
#> 1    UMO N HO N NATION PUBLIC SCHS                 664             655 98.6
#> 2 WINNEBAGO PUBLIC SCHOOLS DISTRICT 17              638             598 93.7
#> 3             WALTHILL PUBLIC SCHOOLS                321             294 91.6
#> 4            ISANTI COMMUNITY SCHOOL                 229             206 90.0
#> 5            NIOBRARA PUBLIC SCHOOLS                 220             135 61.4
#> 6       GORDON-RUSHVILLE PUBLIC SCHS                 534              88 16.5
#> 7              CHADRON PUBLIC SCHOOLS                971              87  9.0
#> 8        SO SIOUX CITY COMMUNITY SCHS              3801             107  2.8
Tribal districts are 90-99% Native American. Critical funding for reservation schools.