New Hampshire’s public schools enrolled 160,322 students in 2025-26 — down 16% from 190,805 in 2011-12. This package provides 15 years of enrollment data from the NH Department of Education, covering ~200 districts and ~500 schools.
Part of the njschooldata family.
Full documentation — all 15 stories with interactive charts, getting-started guide, and complete function reference.
Highlights
1. NH lost 30,000 students since 2012
State enrollment fell from 190,805 to 160,322 — a 16% decline driven by demographic contraction in one of America’s oldest-population states.
library(nhschooldata)
library(dplyr)
library(ggplot2)

enr <- fetch_enr_multi(2012:2026, use_cache = TRUE)

state_trend <- enr |>
  filter(is_state, subgroup == "total_enrollment", grade_level == "TOTAL") |>
  select(end_year, n_students) |>
  arrange(end_year)

stopifnot(nrow(state_trend) > 0)

state_trend |>
  mutate(
    change = n_students - lag(n_students),
    cumulative_change = n_students - first(n_students)
  )
#> # A tibble: 15 × 4
#> end_year n_students change cumulative_change
#> <int> <int> <int> <int>
#> 1 2012 190805 NA 0
#> 2 2013 187962 -2843 -2843
#> 3 2014 185320 -2642 -5485
#> 4 2015 183604 -1716 -7201
#> 5 2016 181339 -2265 -9466
#> 6 2017 179734 -1605 -11071
#> 7 2018 178328 -1406 -12477
#> 8 2019 177365 -963 -13440
#> 9 2020 176168 -1197 -14637
#> 10 2021 167909 -8259 -22896
#> 11 2022 168620 711 -22185
#> 12 2023 167357 -1263 -23448
#> 13 2024 165082 -2275 -25723
#> 14 2025 162660 -2422 -28145
#> 15 2026 160322 -2338 -30483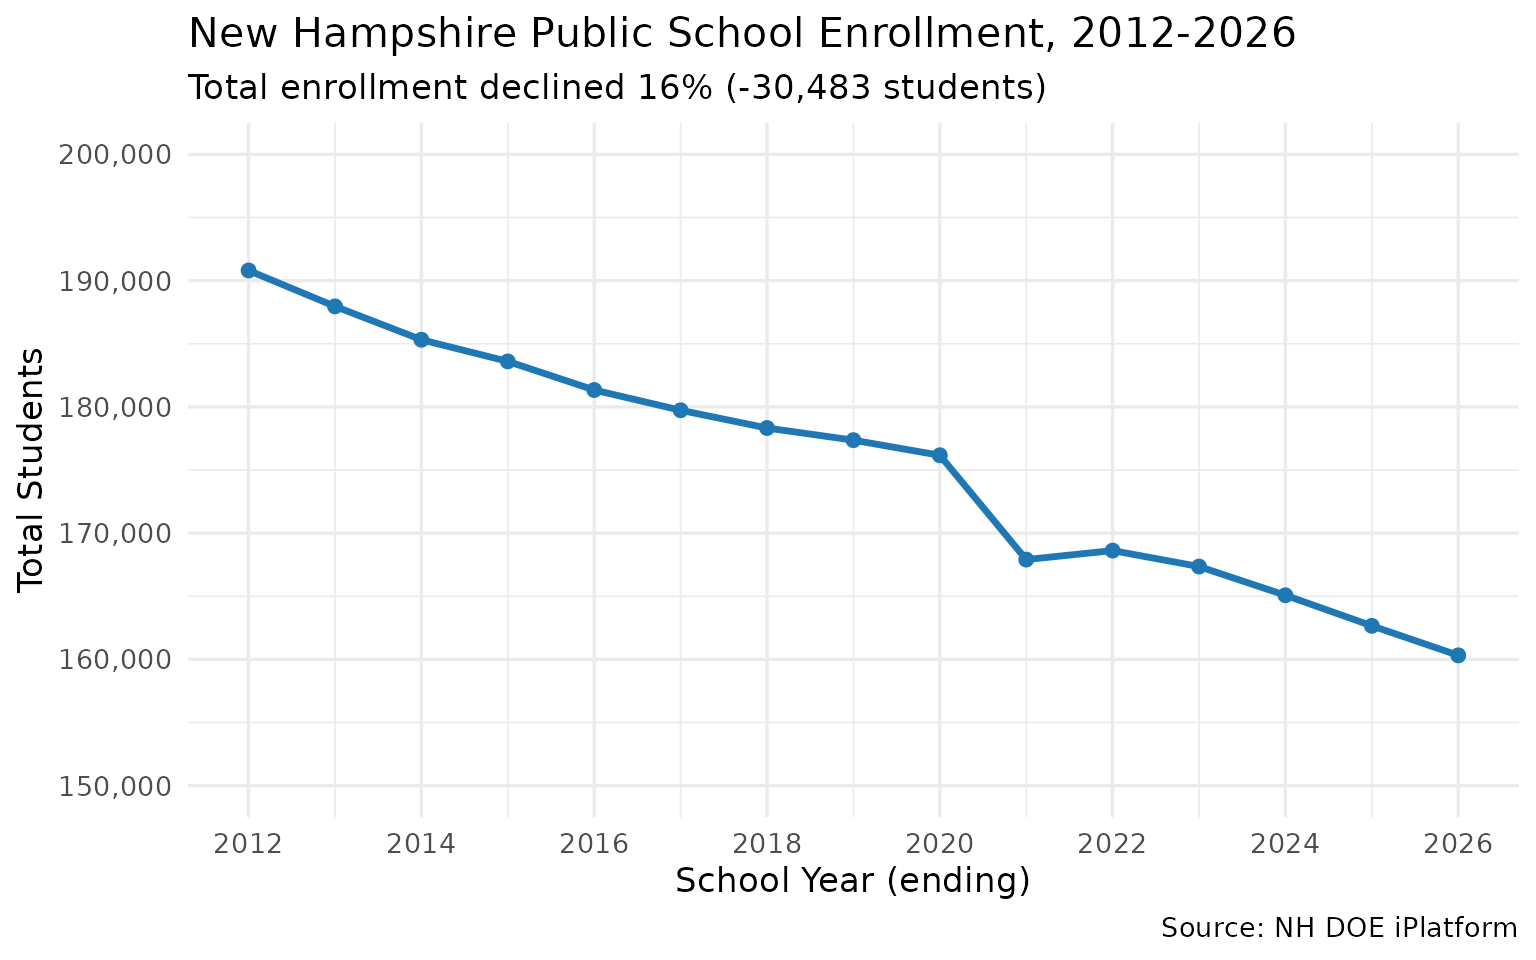
2. Charter schools grew from 0.6% to 3.9% of enrollment
While total enrollment shrank, charter schools quintupled their share — from 9 charters with 1,090 students in 2012 to 35 charters with 6,242 in 2026.
charter_names <- enr |>
  filter(is_district, end_year == 2026) |>
  filter(grepl("Charter|Chartered", district_name, ignore.case = TRUE)) |>
  distinct(district_name) |>
  pull()

charter_trend <- enr |>
  filter(is_district, subgroup == "total_enrollment", grade_level == "TOTAL",
         district_name %in% charter_names) |>
  group_by(end_year) |>
  summarize(
    n_charter = sum(n_students, na.rm = TRUE),
    n_charters = n(),
    .groups = "drop"
  )

state_total <- enr |>
  filter(is_state, subgroup == "total_enrollment", grade_level == "TOTAL") |>
  select(end_year, state_total = n_students)

charter_pct <- charter_trend |>
  left_join(state_total, by = "end_year") |>
  mutate(pct = round(n_charter / state_total * 100, 1))

stopifnot(nrow(charter_pct) > 0)
charter_pct
#> # A tibble: 15 × 5
#> end_year n_charter n_charters state_total pct
#> <int> <int> <int> <int> <dbl>
#> 1 2012 1090 9 190805 0.6
#> 2 2013 1640 14 187962 0.9
#> 3 2014 1978 15 185320 1.1
#> 4 2015 2426 19 183604 1.3
#> 5 2016 2890 21 181339 1.6
#> 6 2017 3297 21 179734 1.8
#> 7 2018 3421 21 178328 1.9
#> 8 2019 3752 23 177365 2.1
#> 9 2020 3993 23 176168 2.3
#> 10 2021 4336 24 167909 2.6
#> 11 2022 4756 25 168620 2.8
#> 12 2023 5211 27 167357 3.1
#> 13 2024 5460 29 165082 3.3
#> 14 2025 5938 31 162660 3.7
#> 15 2026 6242 35 160322 3.9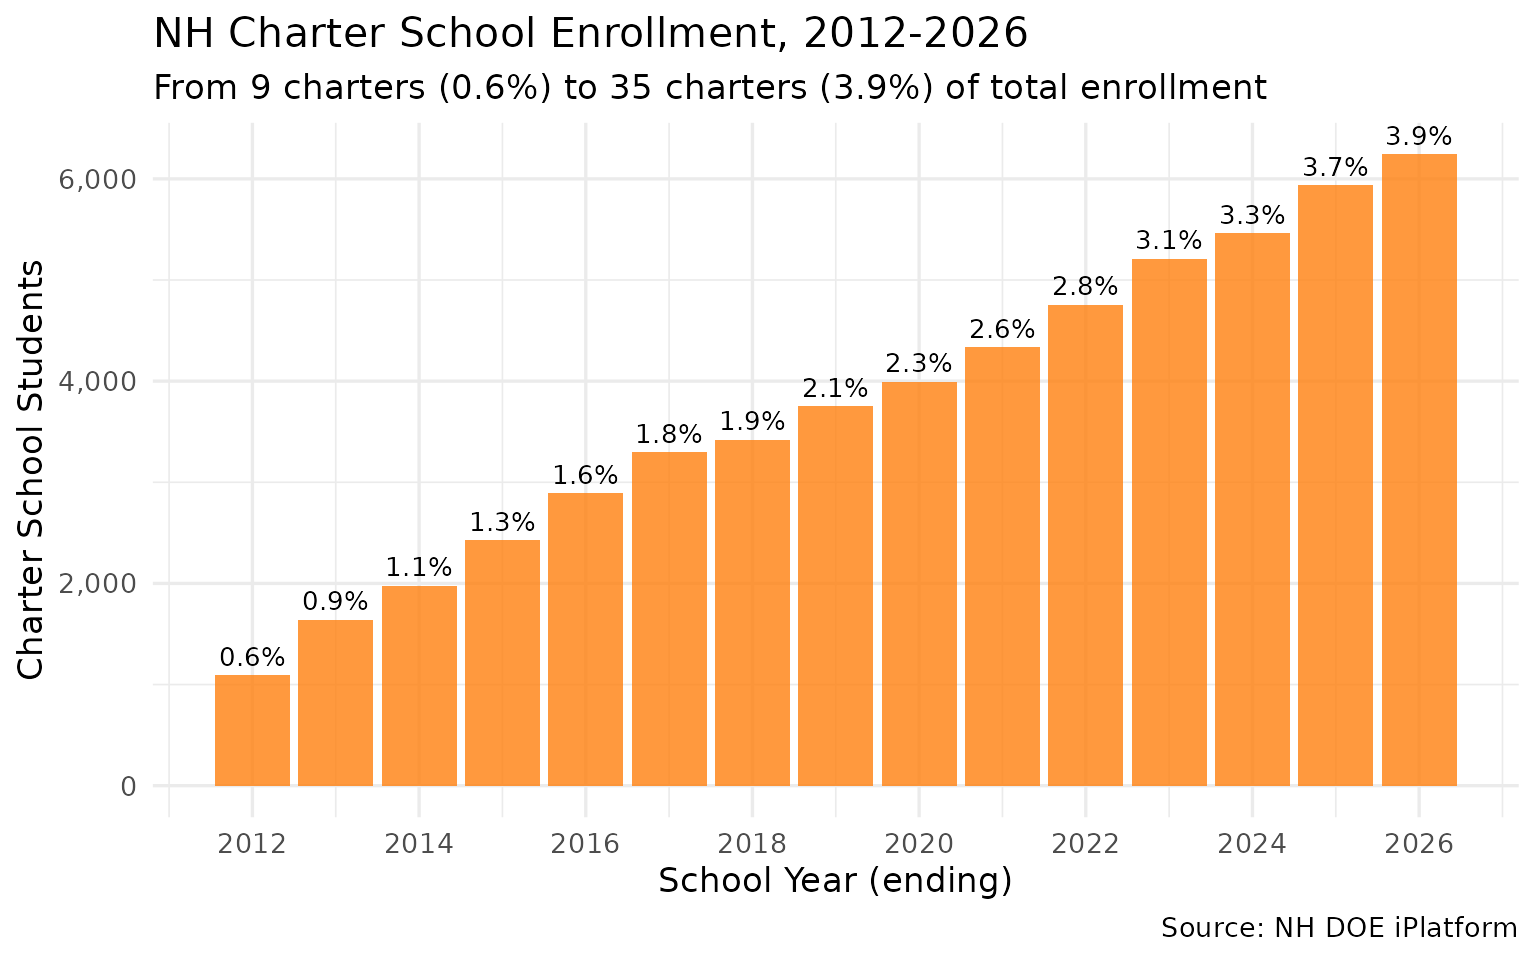
3. COVID erased 8,259 students in a single year
The 2020-21 school year saw a 4.7% enrollment drop — by far the largest single-year decline in the dataset. NH has not recovered.
covid <- enr |>
  filter(is_state, subgroup == "total_enrollment", grade_level == "TOTAL",
         end_year %in% 2019:2022) |>
  select(end_year, n_students) |>
  arrange(end_year) |>
  mutate(
    yoy_change = n_students - lag(n_students),
    yoy_pct = round((n_students / lag(n_students) - 1) * 100, 1)
  )

stopifnot(nrow(covid) == 4)
covid
#> # A tibble: 4 × 4
#> end_year n_students yoy_change yoy_pct
#> <int> <int> <int> <dbl>
#> 1 2019 177365 NA NA
#> 2 2020 176168 -1197 -0.7
#> 3 2021 167909 -8259 -4.7
#> 4 2022 168620 711 0.4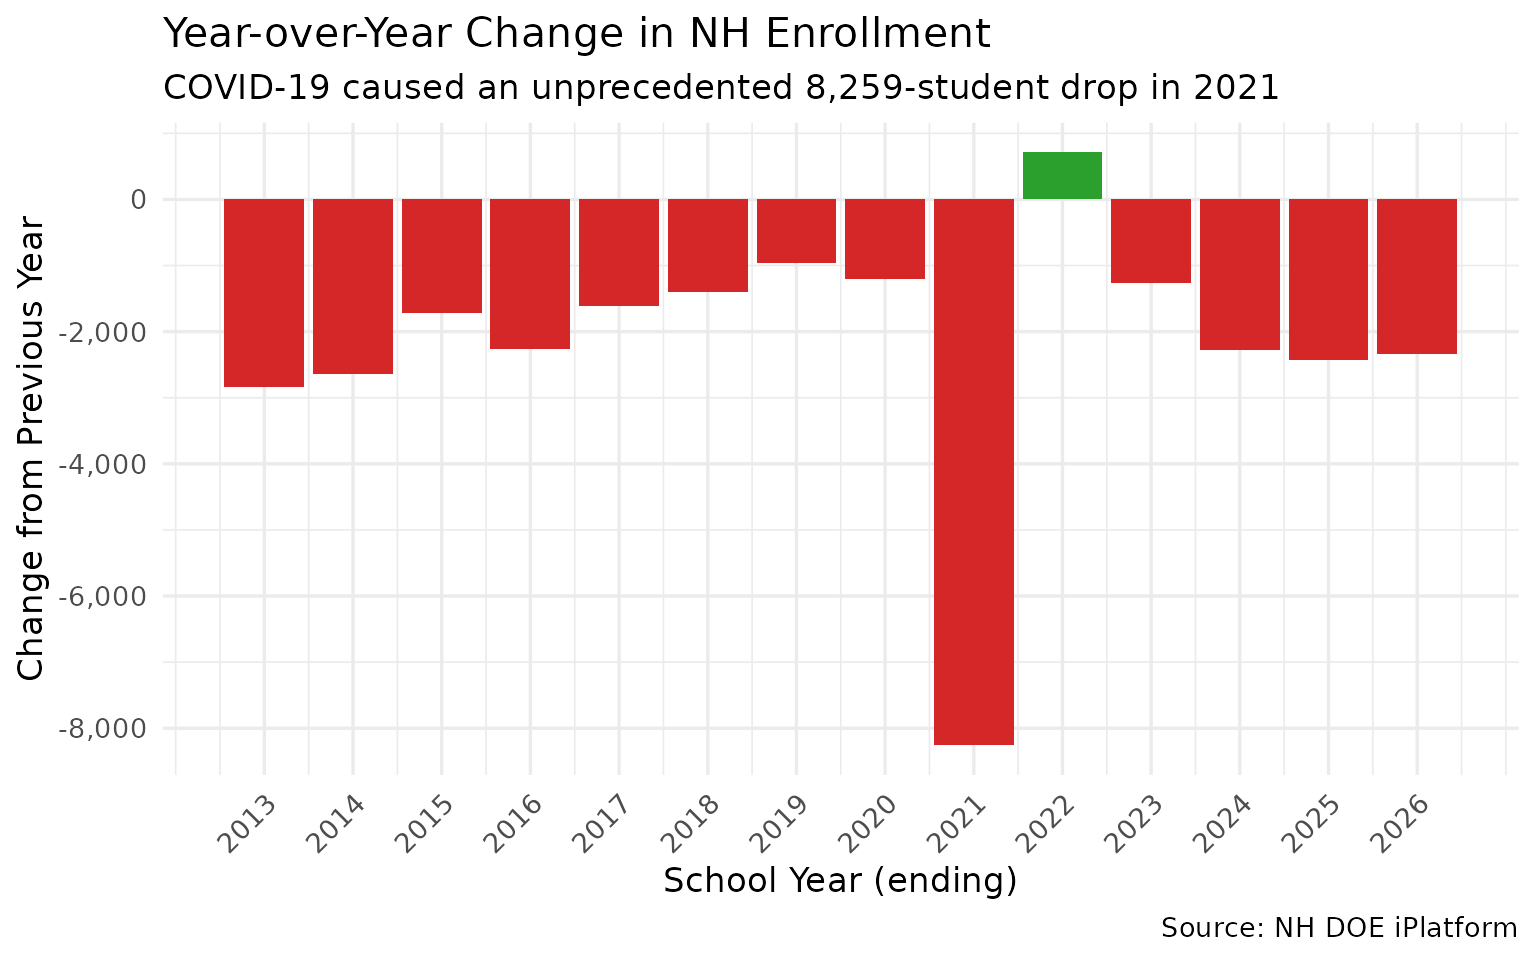
Data Taxonomy
| Category | Years | Function | Details |
|---|---|---|---|
| Enrollment | 2012-2026 |
fetch_enr() / fetch_enr_multi()
|
State, district, school. Grade-level totals |
| Assessments | — | — | Not yet available |
| Graduation | — | — | Not yet available |
| Directory | Current | fetch_directory() |
Schools, SAUs. Address, phone, principal, superintendent |
| Per-Pupil Spending | — | — | Not yet available |
| Accountability | — | — | Not yet available |
| Chronic Absence | — | — | Not yet available |
| EL Progress | — | — | Not yet available |
| Special Ed | — | — | Not yet available |
See the full data category taxonomy
Quick Start
R
remotes::install_github("almartin82/nhschooldata")

library(nhschooldata)
library(dplyr)

# Fetch enrollment for 2025-26
enr <- fetch_enr(2026)

# State total
enr |>
  filter(is_state, subgroup == "total_enrollment", grade_level == "TOTAL") |>
  select(end_year, n_students)

# Top 5 districts
enr |>
  filter(is_district, subgroup == "total_enrollment", grade_level == "TOTAL") |>
  arrange(desc(n_students)) |>
  select(district_name, n_students) |>
head(5)Explore More
Full analysis with 15 stories: - Enrollment trends — 15 stories covering state trends, district deep dives, grade-level patterns, and structural analysis - Function reference
Data Notes
| Item | Detail |
|---|---|
| Source | NH DOE iPlatform |
| Years | 2012-2026 (15 school years) |
| Entity types | ~200 districts (organized into SAUs), ~500 schools |
| Census day | October 1 of each school year |
| Demographics | Not available in standard enrollment reports (grade totals only) |
| Suppression | Counts < 10 may be suppressed with *
|
| Download method | Headed Playwright (Akamai WAF blocks headless HTTP) |
Deeper Dive
4. Manchester lost nearly a quarter of its students
New Hampshire’s largest city saw enrollment drop from 15,536 to 11,712 — a loss of 3,824 students (24.6%) while maintaining 20 schools.
big2 <- enr |>
  filter(is_district, subgroup == "total_enrollment", grade_level == "TOTAL",
         district_name %in% c("Manchester", "Nashua")) |>
  select(end_year, district_name, n_students) |>
  arrange(end_year, district_name)

stopifnot(nrow(big2) > 0)
big2 |>
  filter(end_year %in% c(2012, 2018, 2026)) |>
  pivot_wider(names_from = district_name, values_from = n_students)
#> # A tibble: 3 × 3
#> end_year Manchester Nashua
#> <int> <int> <int>
#> 1 2012 15536 11894
#> 2 2018 13477 10598
#> 3 2026 11712 9501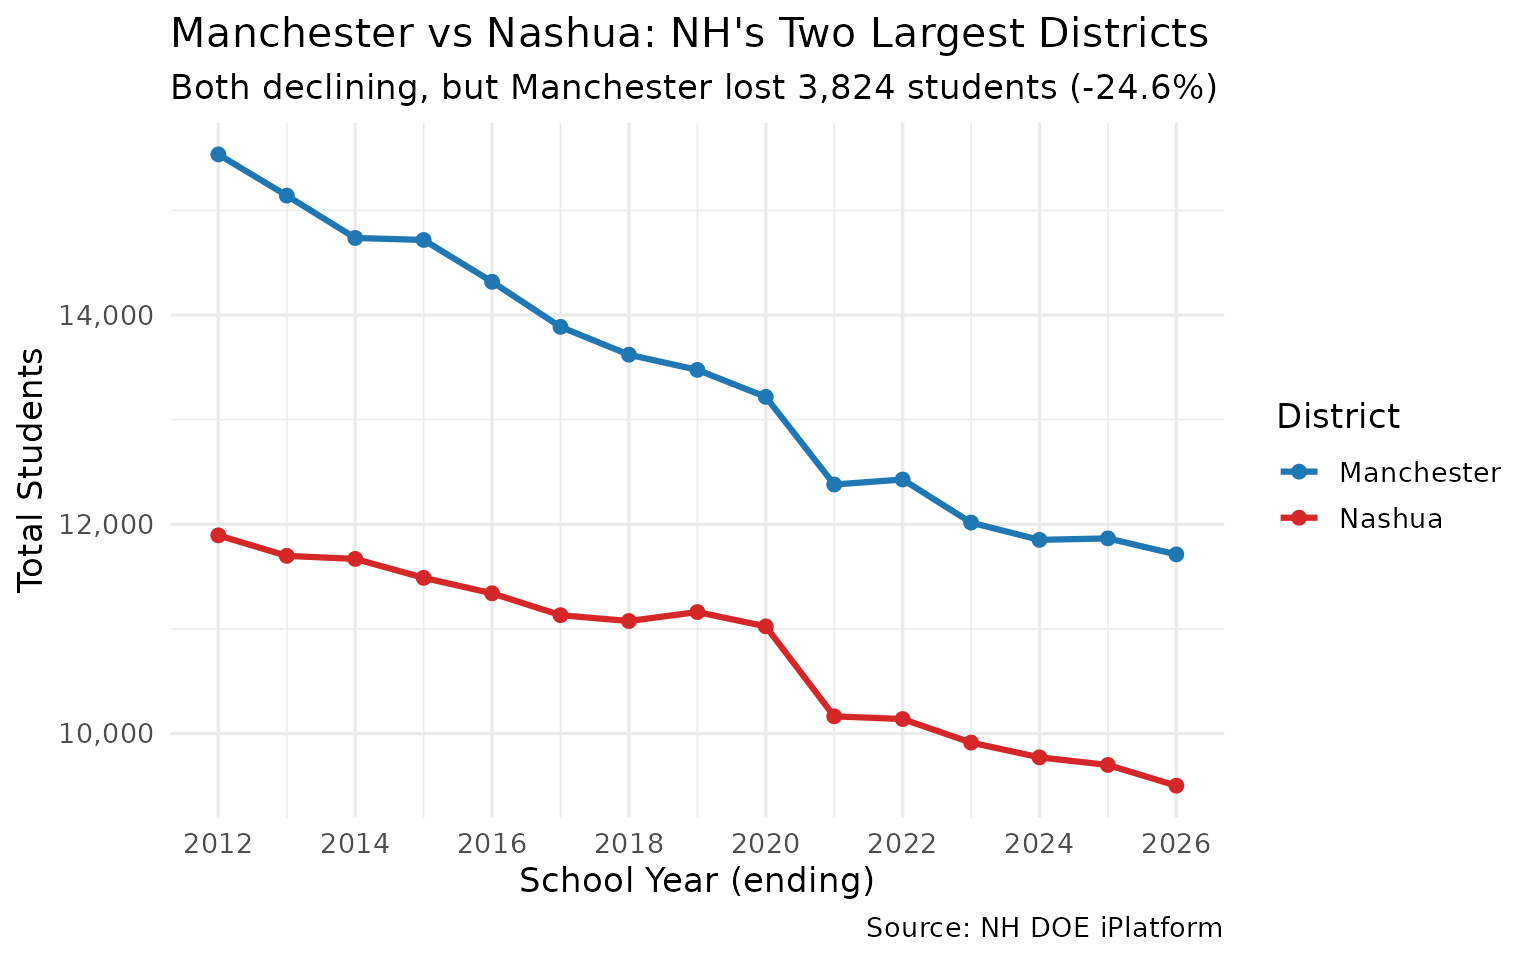
5. Errol has 12 students — the state’s tiniest district
New Hampshire has dozens of districts with fewer than 100 students. The smallest, Errol, has just 12 — smaller than most college seminar classes.
smallest <- enr |>
  filter(is_district, subgroup == "total_enrollment", grade_level == "TOTAL",
         end_year == 2026) |>
  select(district_name, sau, sau_name, n_students) |>
  arrange(n_students) |>
  head(10)

stopifnot(nrow(smallest) > 0)
smallest
#> # A tibble: 10 × 4
#> district_name sau sau_name n_students
#> <chr> <chr> <chr> <int>
#> 1 Errol 20 Gorham 12
#> 2 Landaff 35 SAU #35… 15
#> 3 North Star Academy Chartered Public School 406 North S… 17
#> 4 Jackson 9 Conway 26
#> 5 Croydon 99 Croydon 28
#> 6 Stark 58 Groveton 30
#> 7 Marlow 29 Keene 32
#> 8 CSI Charter School 410 CSI Cha… 32
#> 9 NH Career Academy Chartered Public School 421 NH Care… 32
#> 10 Waterville Valley 48 Plymouth 34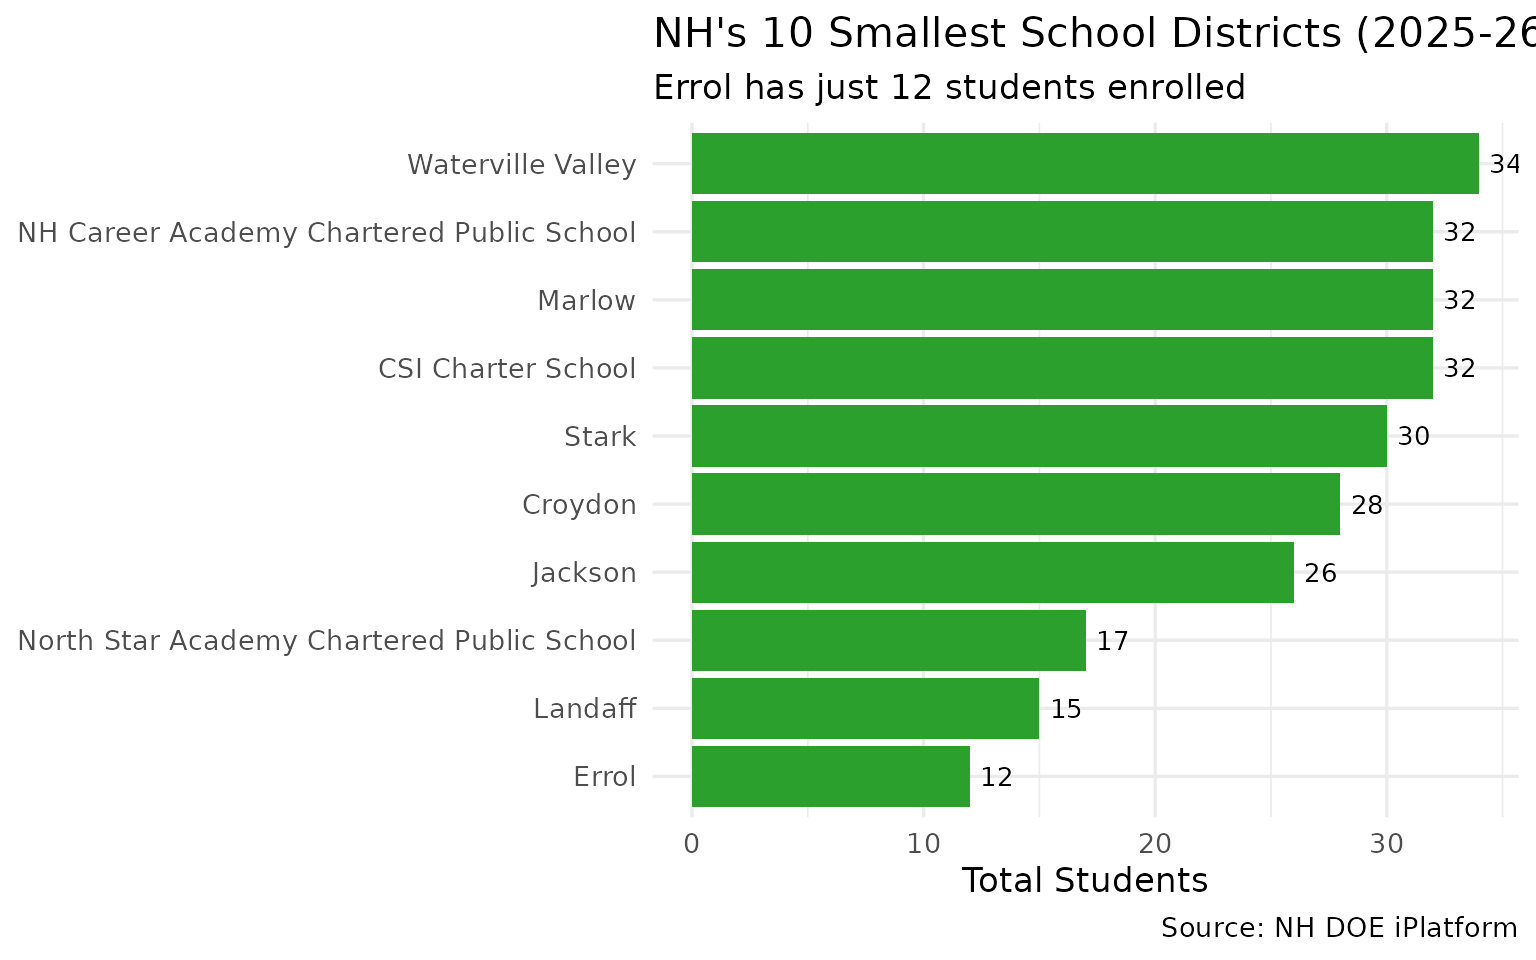
6. Virtual Learning Academy grew 756% — the biggest gainer
While most districts shrank, Virtual Learning Academy Charter School grew from 63 students in 2012 to 539 in 2026 — a 756% increase.
changes <- enr |>
  filter(is_district, subgroup == "total_enrollment", grade_level == "TOTAL",
         end_year %in% c(2012, 2026)) |>
  select(end_year, district_name, n_students) |>
  pivot_wider(names_from = end_year, values_from = n_students,
              names_prefix = "y") |>
  filter(!is.na(y2012), !is.na(y2026)) |>
  mutate(
    change = y2026 - y2012,
    pct_change = round((y2026 / y2012 - 1) * 100, 1)
  )

stopifnot(nrow(changes) > 0)
cat("Top 5 gainers:\n")
changes |> arrange(desc(pct_change)) |> head(5)
#> Top 5 gainers:
#> # A tibble: 5 × 5
#> district_name y2012 y2026 change pct_change
#> <chr> <int> <int> <int> <dbl>
#> 1 Virtual Learning Academy Charter School 63 539 476 755.6
#> 2 Academy for Science and Design Charter School 285 671 386 135.4
#> 3 Strong Foundations Charter School 172 336 164 95.3
#> 4 Gate City Charter School For the Arts 106 203 97 91.5
#> 5 Making Community Connections Charter School 97 171 74 76.3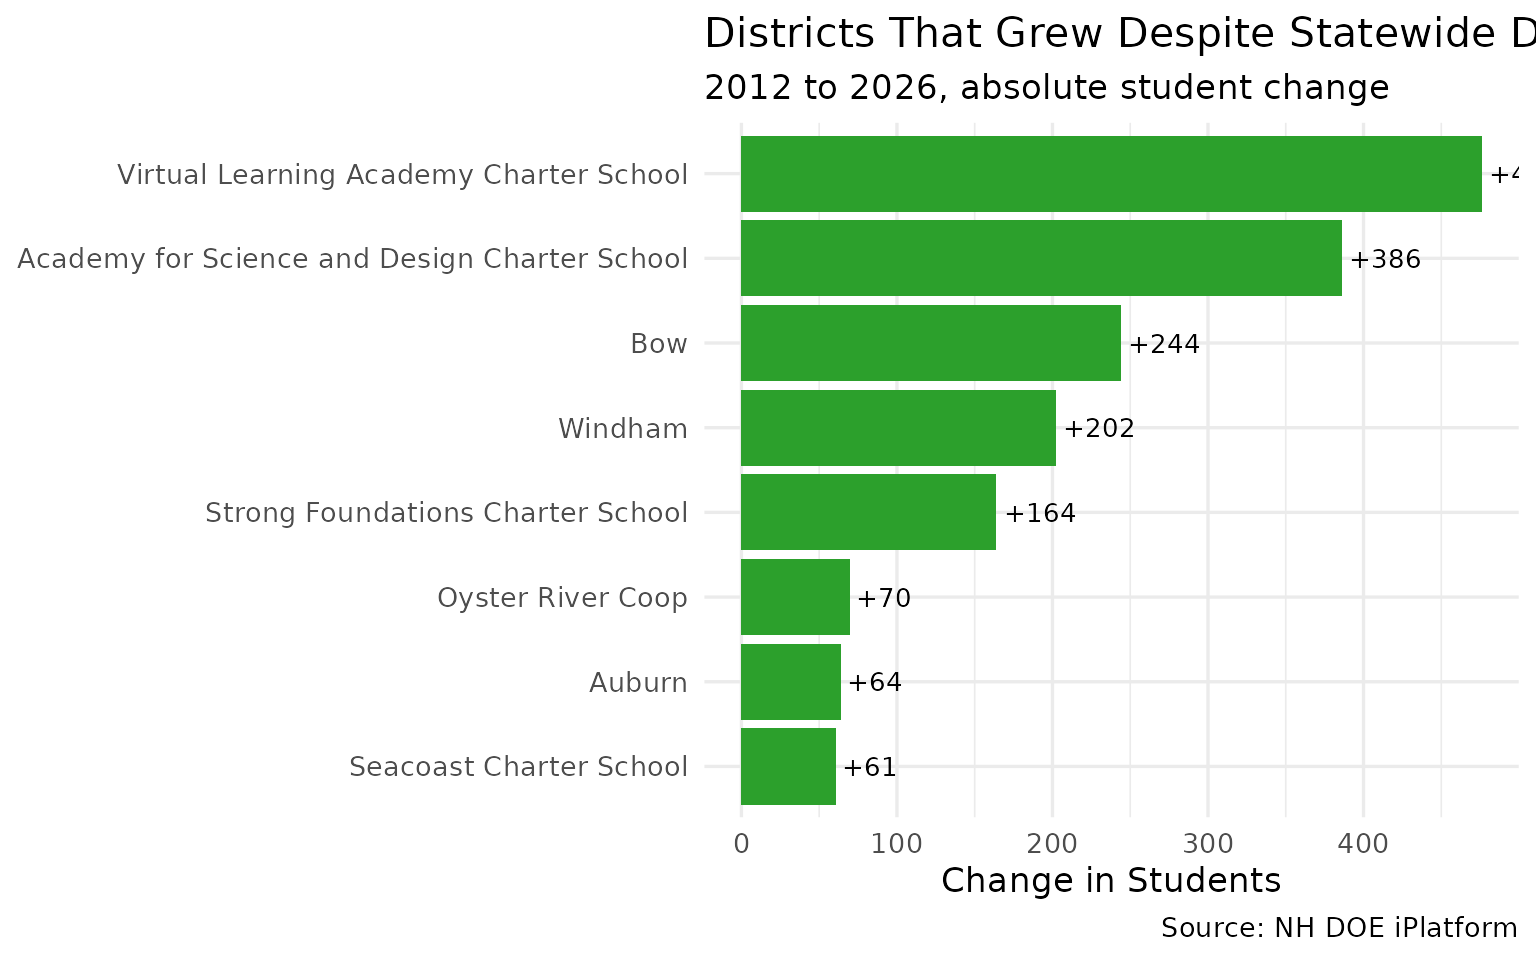
7. Top 5 losers account for 9,481 lost students
The five largest districts — Manchester, Nashua, Hudson, Concord, and Londonderry — together lost 9,481 students, nearly a third of the statewide decline.
#> # A tibble: 5 × 5
#>   district_name y2012 y2026 change pct_change
#>   <chr>         <int> <int>  <int>      <dbl>
#> 1 Manchester    15536 11712  -3824      -24.6
#> 2 Nashua        11894  9501  -2393      -20.1
#> 3 Hudson         4052  2875  -1177      -29.0
#> 4 Concord        4842  3755  -1087      -22.4
#> 5 Londonderry    4847  3847  -1000      -20.6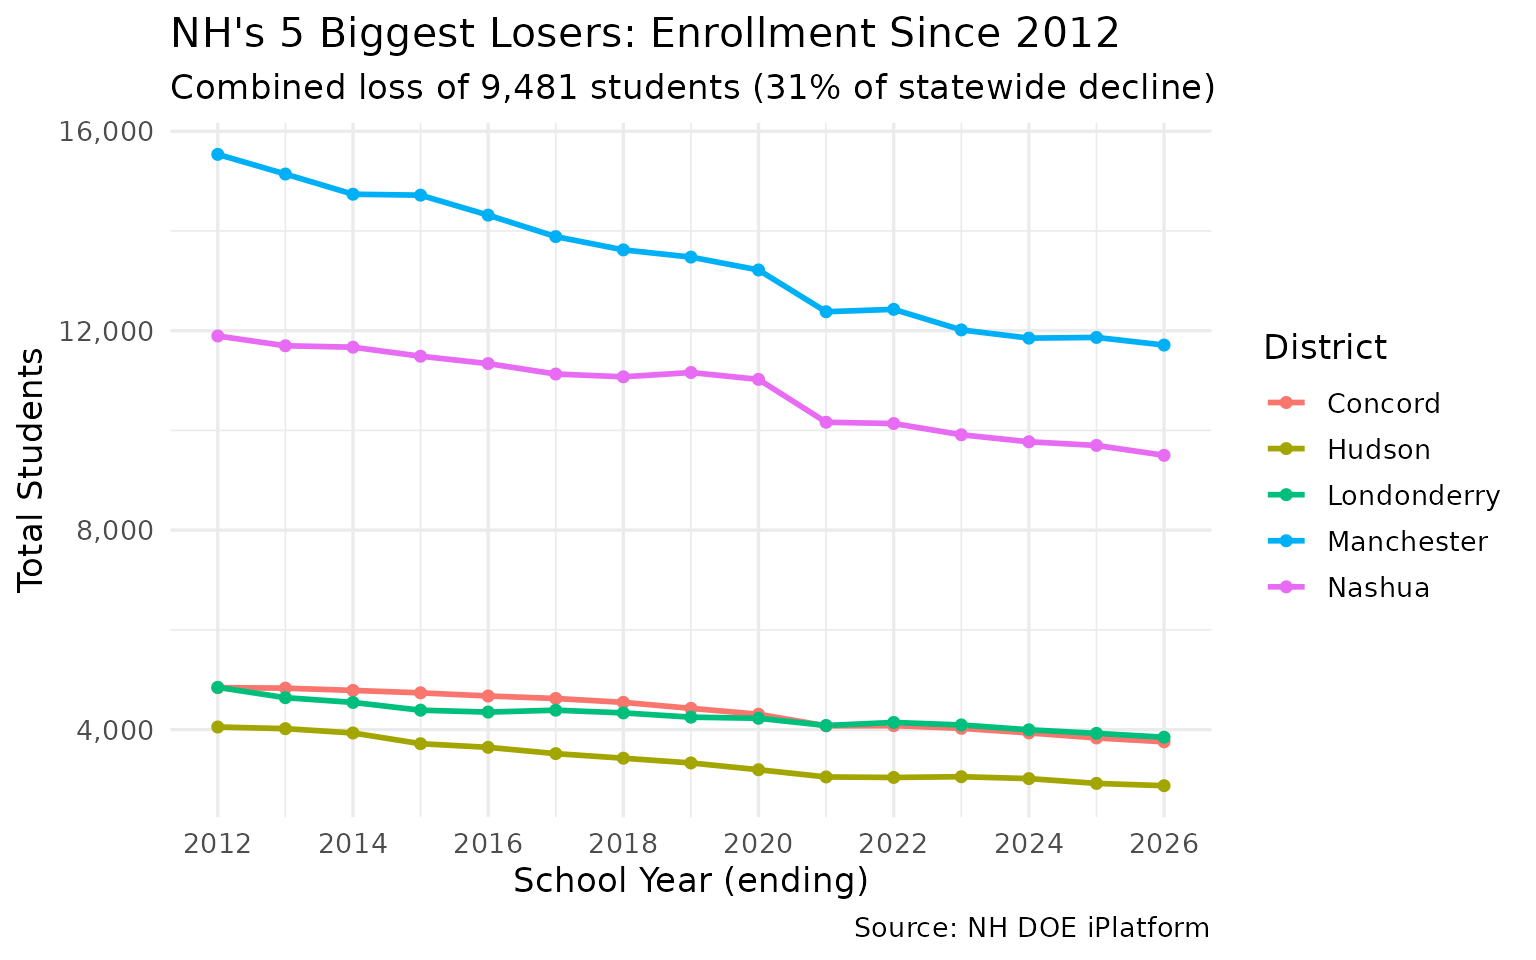
8. Grade 12 consistently outnumbers Grade 1
Every year since 2012, more students graduate from 12th grade than enter 1st grade — a demographic signature of sustained population decline.
pipeline <- enr |>
  filter(is_campus, subgroup == "total_enrollment",
         grade_level %in% c("01", "12")) |>
  group_by(end_year, grade_level) |>
  summarize(n = sum(n_students, na.rm = TRUE), .groups = "drop") |>
  pivot_wider(names_from = grade_level, values_from = n) |>
  rename(grade_01 = `01`, grade_12 = `12`) |>
  mutate(ratio = round(grade_12 / grade_01, 2))

stopifnot(nrow(pipeline) > 0)
pipeline
#> # A tibble: 15 × 4
#> end_year grade_01 grade_12 ratio
#> <int> <int> <int> <dbl>
#> 1 2012 13595 14673 1.08
#> 2 2013 13609 14404 1.06
#> 3 2014 13461 13962 1.04
#> 4 2015 13157 13671 1.04
#> 5 2016 12898 13752 1.07
#> 6 2017 12377 13338 1.08
#> 7 2018 12678 13235 1.04
#> 8 2019 12351 13080 1.06
#> 9 2020 12501 13172 1.05
#> 10 2021 11675 13114 1.12
#> 11 2022 11754 12867 1.09
#> 12 2023 12099 12471 1.03
#> 13 2024 11687 12502 1.07
#> 14 2025 11278 12493 1.11
#> 15 2026 11169 12388 1.11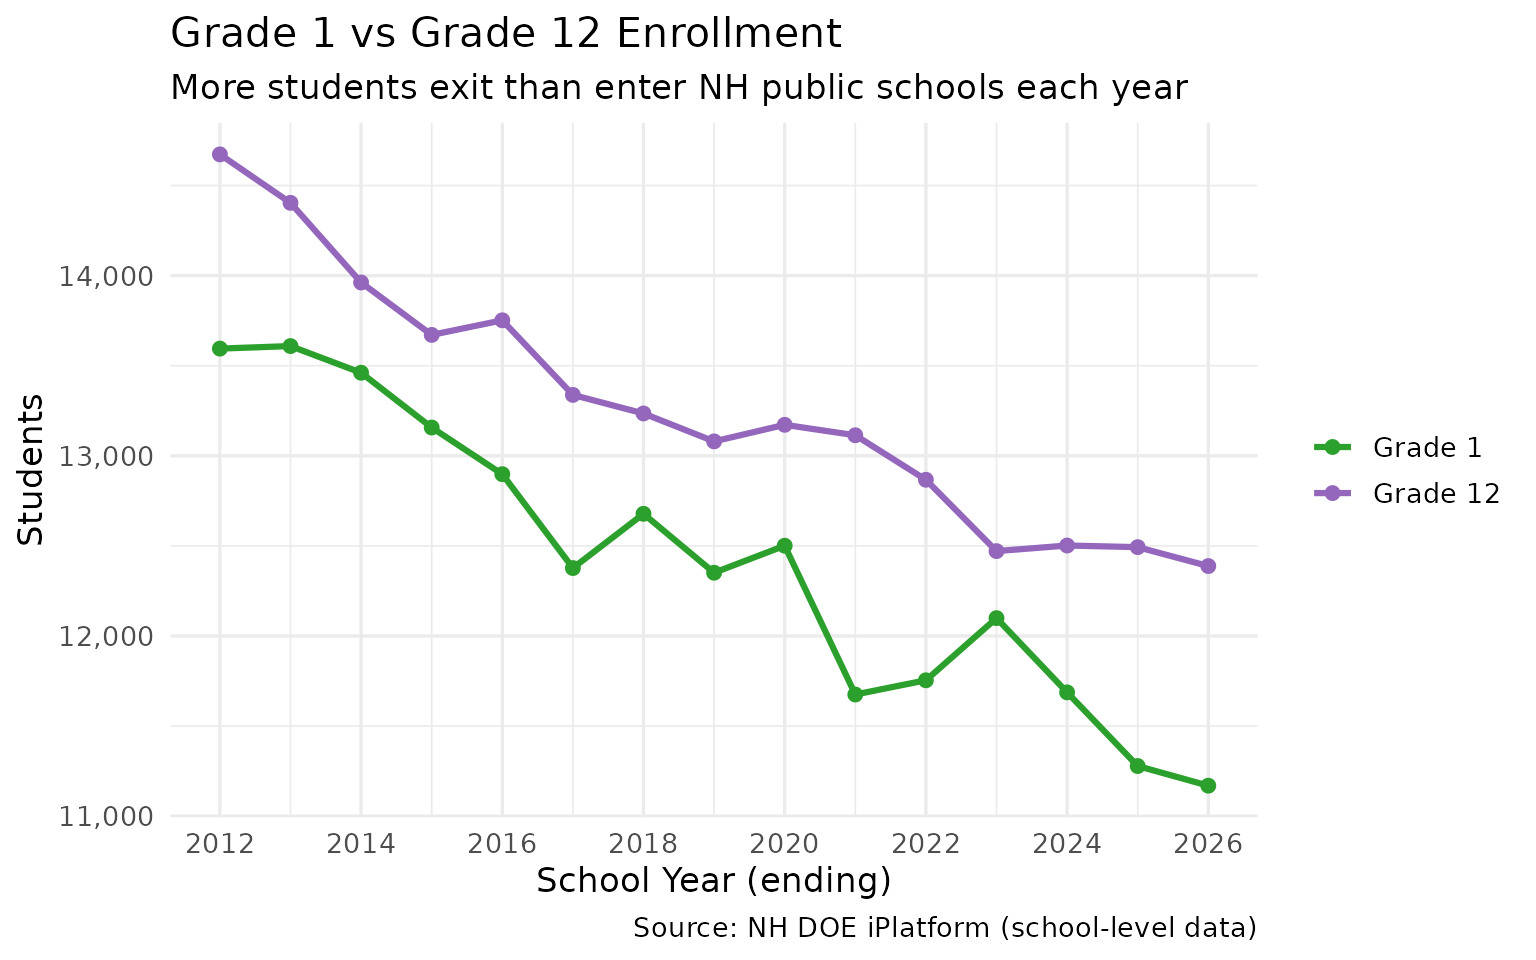
9. PreK enrollment grew 39% while everything else shrank
PreK enrollment rose from 3,165 to 4,395 — a 39% increase — even as overall enrollment fell 16%.
prek <- enr |>
  filter(is_state, subgroup == "total_enrollment", grade_level == "PK") |>
  select(end_year, n_students) |>
  arrange(end_year)

stopifnot(nrow(prek) > 0)
prek
#> # A tibble: 15 × 2
#> end_year n_students
#> <int> <int>
#> 1 2012 3165
#> 2 2013 3200
#> 3 2014 3401
#> 4 2015 3557
#> 5 2016 3670
#> 6 2017 3894
#> 7 2018 3876
#> 8 2019 4192
#> 9 2020 4518
#> 10 2021 2908
#> 11 2022 3848
#> 12 2023 4385
#> 13 2024 4440
#> 14 2025 4385
#> 15 2026 4395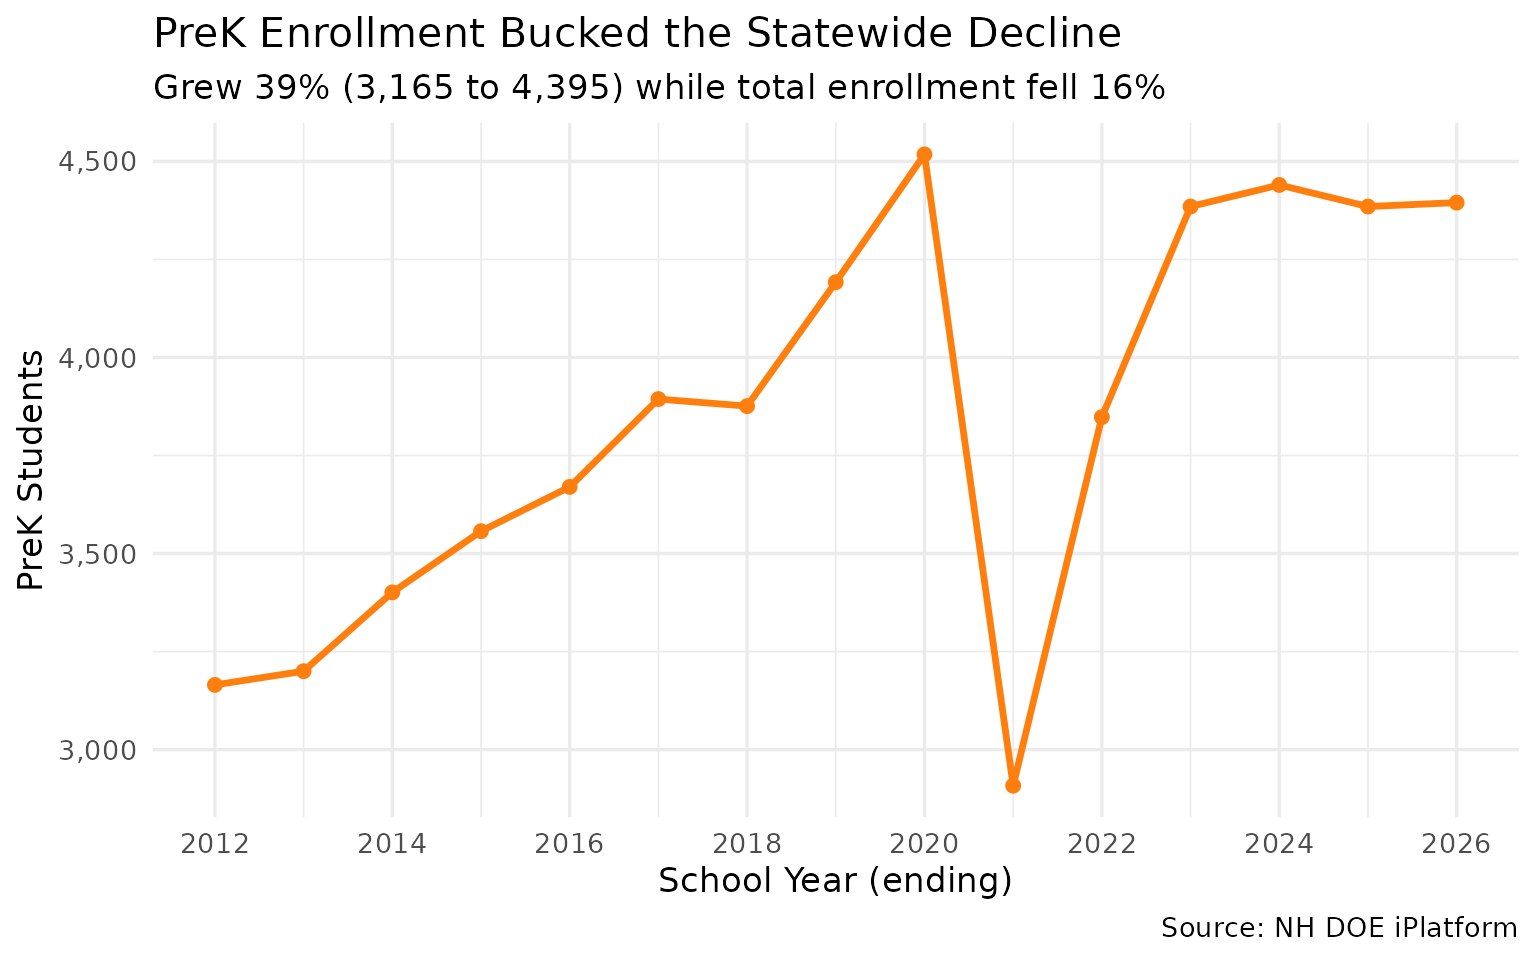
10. Kindergarten lost 1,177 students since 2012
Kindergarten enrollment dropped from 11,904 to 10,727 — a 10% decline that signals continued enrollment losses ahead.
k_trend <- enr |>
  filter(is_campus, subgroup == "total_enrollment", grade_level == "K") |>
  group_by(end_year) |>
  summarize(n_students = sum(n_students, na.rm = TRUE), .groups = "drop")

stopifnot(nrow(k_trend) > 0)
k_trend
#> # A tibble: 15 × 2
#> end_year n_students
#> <int> <int>
#> 1 2012 11904
#> 2 2013 11888
#> 3 2014 11602
#> 4 2015 11570
#> 5 2016 11187
#> 6 2017 11422
#> 7 2018 11415
#> 8 2019 11691
#> 9 2020 11689
#> 10 2021 10111
#> 11 2022 11212
#> 12 2023 11074
#> 13 2024 10893
#> 14 2025 10871
#> 15 2026 10727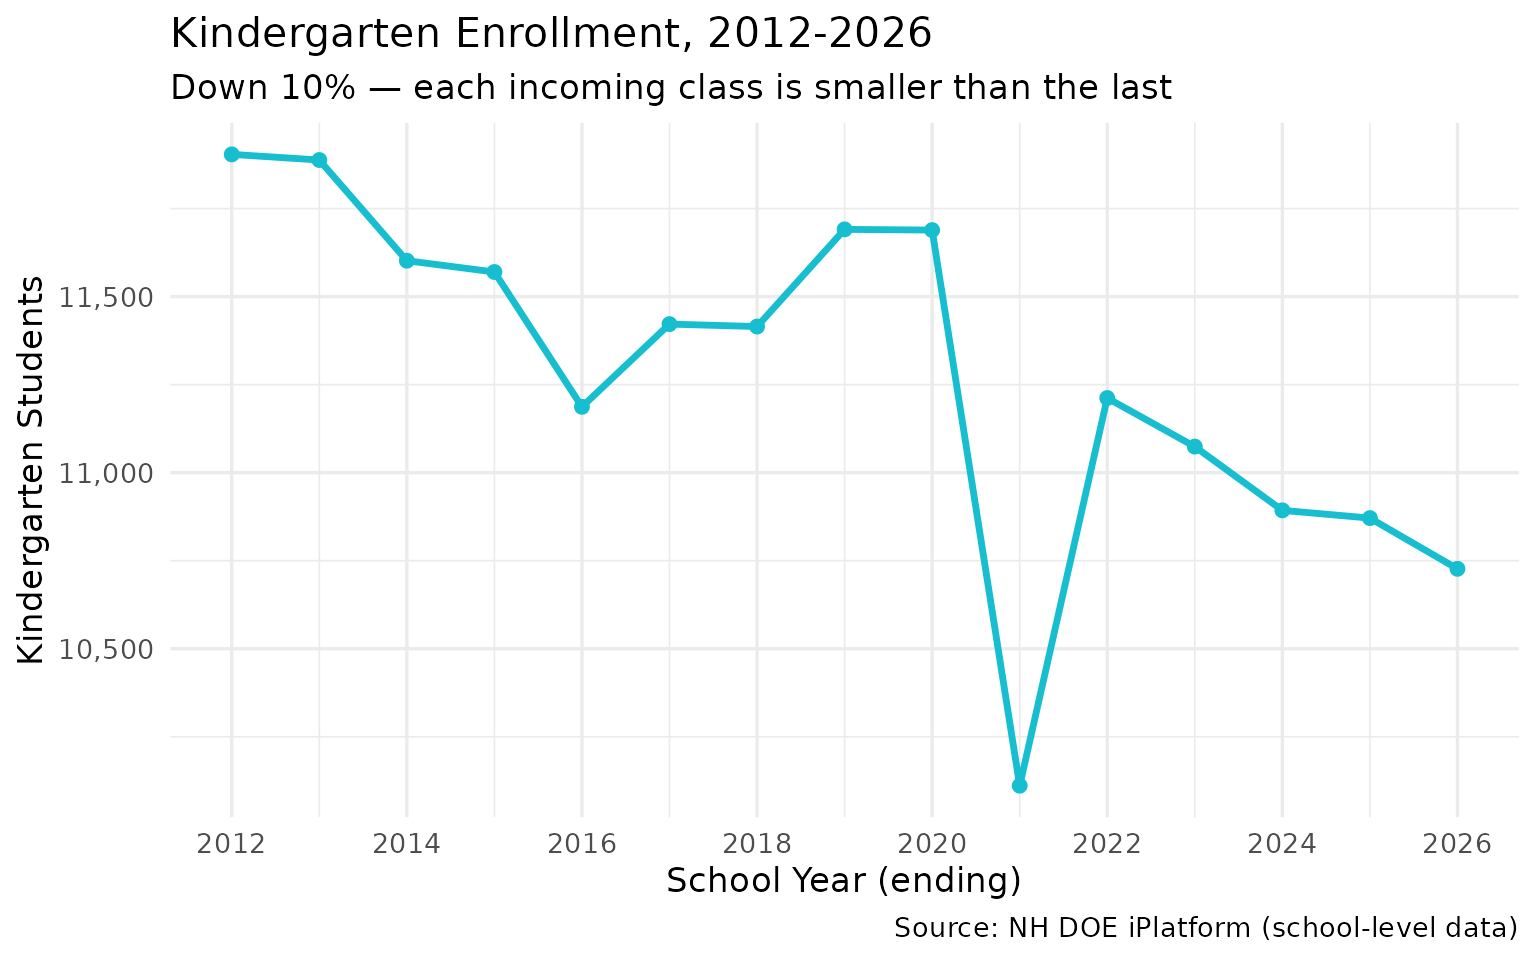
11. 111 one-school districts vs Manchester’s 20
Over half of NH’s districts have just one school. Meanwhile Manchester operates 20 — nearly as many as the bottom 40 districts combined.
schools_per <- enr |>
  filter(is_campus, subgroup == "total_enrollment", grade_level == "TOTAL",
         end_year == 2026) |>
  group_by(district_name) |>
  summarize(n_schools = n(), .groups = "drop") |>
  arrange(desc(n_schools))

stopifnot(nrow(schools_per) > 0)
cat("Districts by school count:\n")
schools_per |>
  mutate(category = case_when(
    n_schools == 1 ~ "1 school",
    n_schools <= 3 ~ "2-3 schools",
    n_schools <= 10 ~ "4-10 schools",
    TRUE ~ "11+ schools"
  )) |>
  count(category)
#> Districts by school count:
#> # A tibble: 4 × 2
#> category n
#> <chr> <int>
#> 1 1 school 111
#> 2 11+ schools 5
#> 3 2-3 schools 46
#> 4 4-10 schools 41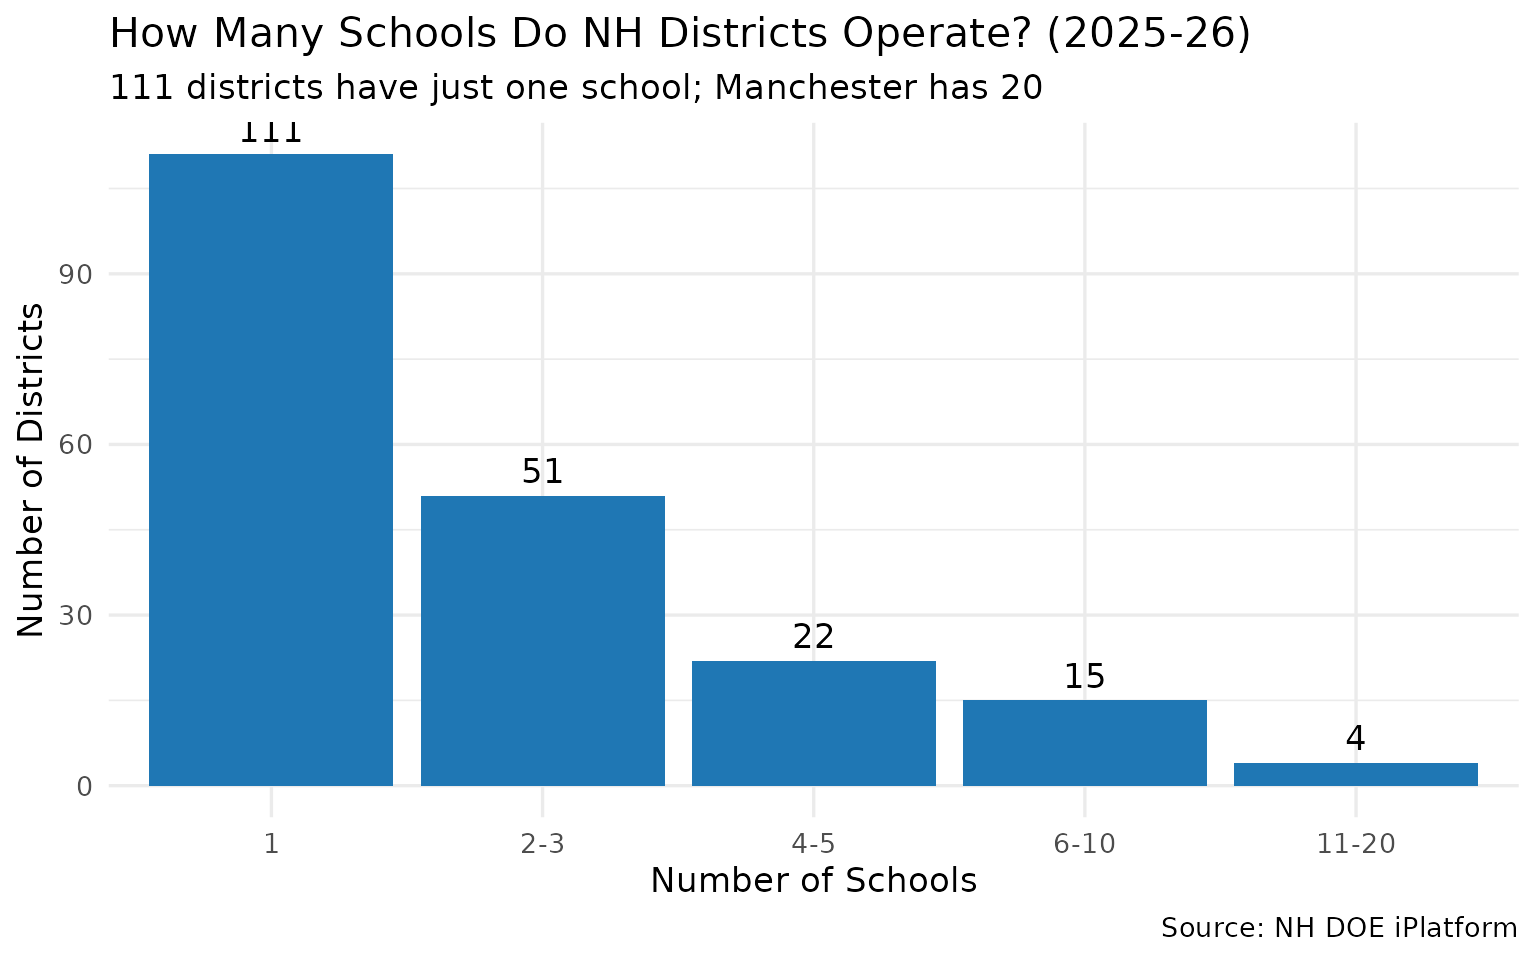
12. The SAU system: one administrator, multiple districts
New Hampshire’s School Administrative Units (SAUs) are a unique feature. Plymouth SAU #48 covers 8 districts, allowing tiny towns to share administrative costs.
sau_multi <- enr |>
  filter(is_district, subgroup == "total_enrollment", grade_level == "TOTAL",
         end_year == 2026) |>
  group_by(sau, sau_name) |>
  summarize(
    n_districts = n(),
    total_students = sum(n_students, na.rm = TRUE),
    districts = paste(district_name, collapse = ", "),
    .groups = "drop"
  ) |>
  arrange(desc(n_districts))

stopifnot(nrow(sau_multi) > 0)
sau_multi |> head(8)
#> # A tibble: 8 × 5
#> sau sau_name n_districts total_students districts
#> <chr> <chr> <int> <int> <chr>
#> 1 48 Plymouth 8 1753 Ashland, Campton, …
#> 2 16 Exeter 7 4147 Brentwood, East Ki…
#> 3 29 Keene 7 3583 Chesterfield, Keene…
#> 4 21 Winnacunnet 5 2044 Hampton, Hampton F…
#> 5 35 SAU #35 Office 5 726 Bethlehem, Landaff…
#> 6 53 Pembroke 5 2695 Allenstown, Chiches…
#> 7 23 Haverhill Cooperative 4 771 Bath, Benton, Haver…
#> 8 24 Henniker 4 1869 Henniker, John Star…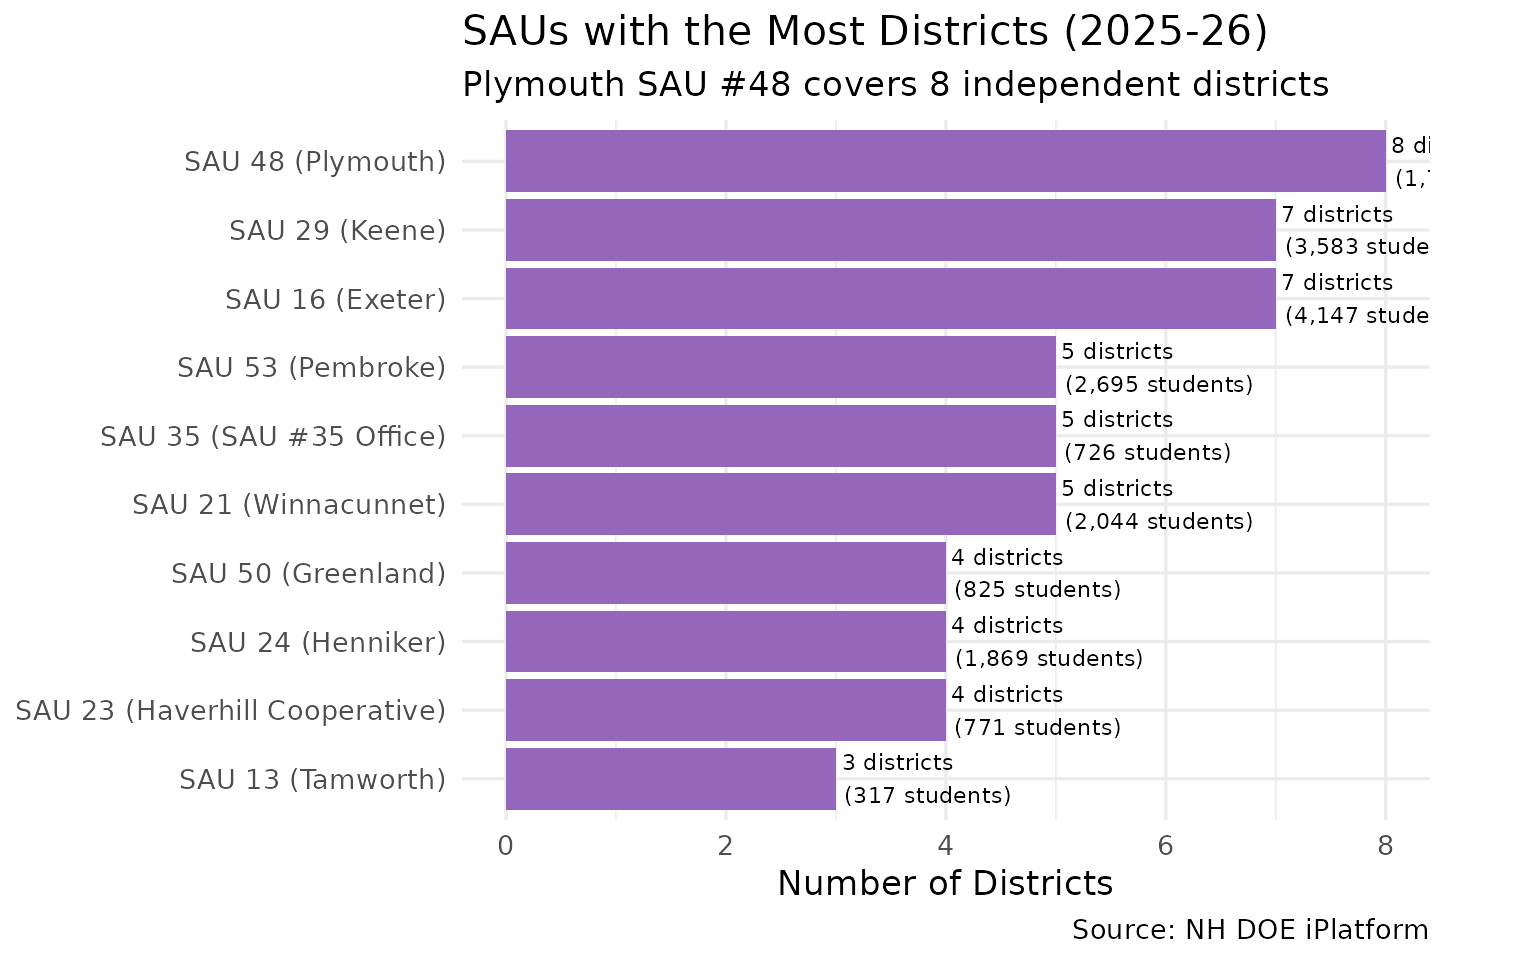
13. North Country lost 26% of its students
The remote northern districts (Coos County area) saw enrollment drop from 2,526 to 1,859 — a 26% decline, steeper than the statewide average.
north_country <- c("Berlin", "Gorham", "Milan", "Errol", "Pittsburg",
                    "Colebrook", "Stark", "Stratford", "Stewartstown",
                    "Northumberland", "Lancaster", "Whitefield", "Dalton")

nc_trend <- enr |>
  filter(is_district, subgroup == "total_enrollment", grade_level == "TOTAL",
         district_name %in% north_country) |>
  group_by(end_year) |>
  summarize(
    n_students = sum(n_students, na.rm = TRUE),
    n_districts = n(),
    .groups = "drop"
  )

stopifnot(nrow(nc_trend) > 0)
nc_trend
#> # A tibble: 15 × 3
#> end_year n_students n_districts
#> <int> <int> <int>
#> 1 2012 2526 9
#> 2 2013 2481 9
#> 3 2014 2440 9
#> 4 2015 2360 9
#> 5 2016 2299 9
#> 6 2017 2282 9
#> 7 2018 2212 9
#> 8 2019 2102 9
#> 9 2020 2085 9
#> 10 2021 1999 9
#> 11 2022 1984 9
#> 12 2023 1977 9
#> 13 2024 1886 9
#> 14 2025 1858 9
#> 15 2026 1859 9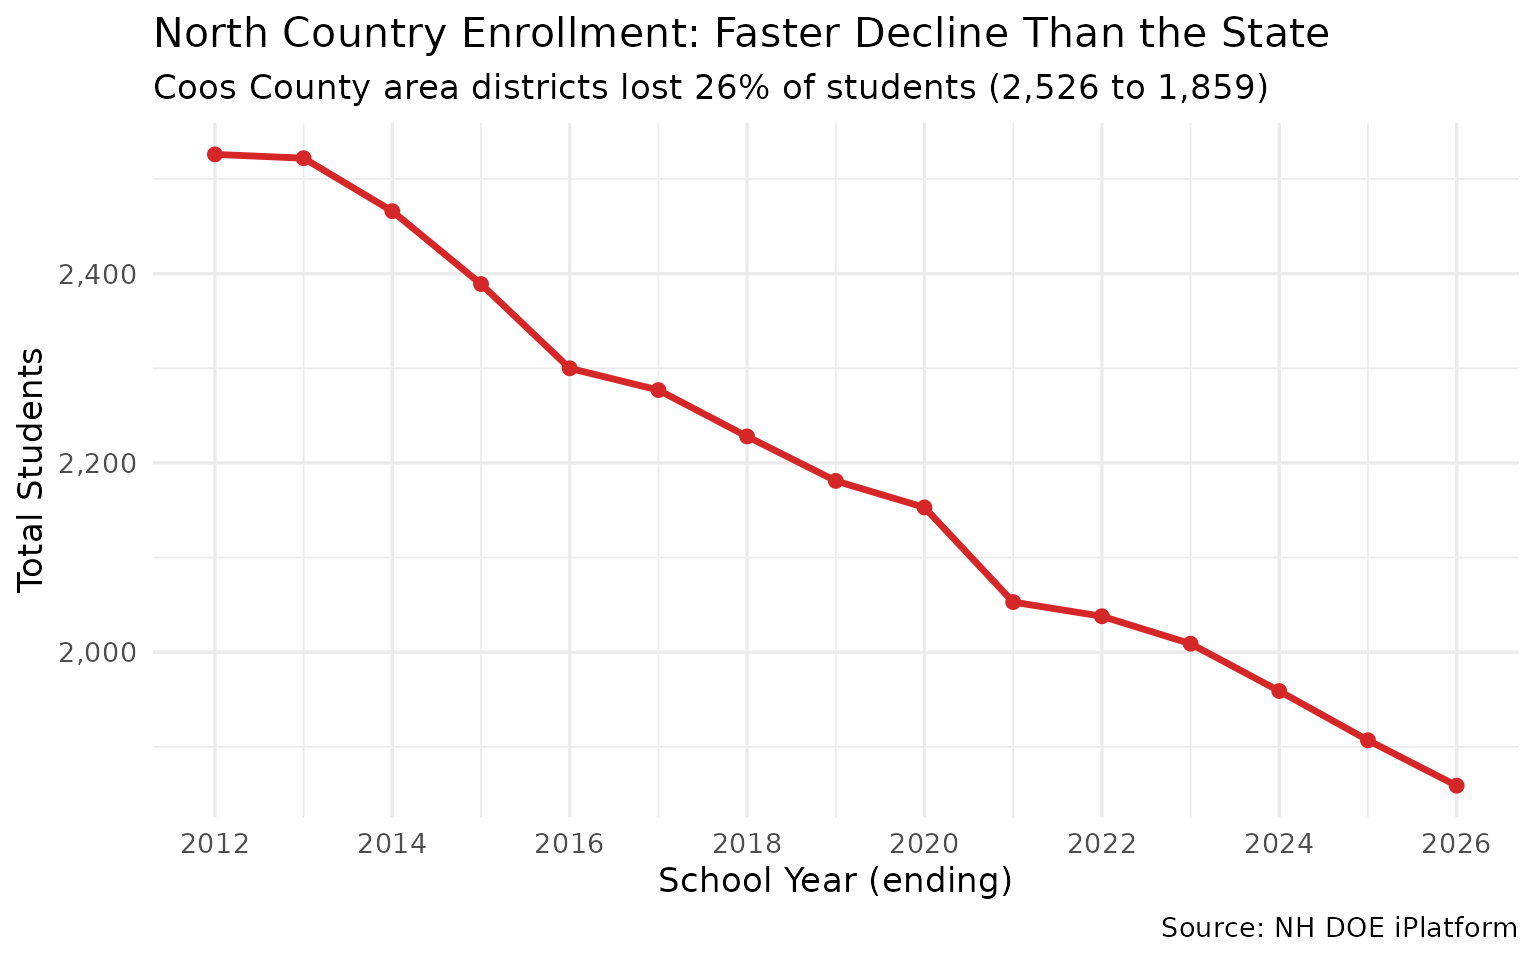
14. Southern NH’s Boston corridor also losing students
Even districts near the Massachusetts border — traditionally NH’s growth engine — are declining. Salem, Windham, Londonderry, and Hudson together lost 3,432 students.
south_nh <- c("Salem", "Windham", "Londonderry", "Derry", "Hudson",
              "Pelham", "Hampstead", "Atkinson", "Plaistow", "Sandown")

snh_trend <- enr |>
  filter(is_district, subgroup == "total_enrollment", grade_level == "TOTAL",
         district_name %in% south_nh) |>
  group_by(end_year) |>
  summarize(n_students = sum(n_students, na.rm = TRUE), .groups = "drop")

stopifnot(nrow(snh_trend) > 0)
snh_trend |> filter(end_year %in% c(2012, 2020, 2026))
#> # A tibble: 3 × 2
#> end_year n_students
#> <int> <int>
#> 1 2012 18887
#> 2 2020 16638
#> 3 2026 15455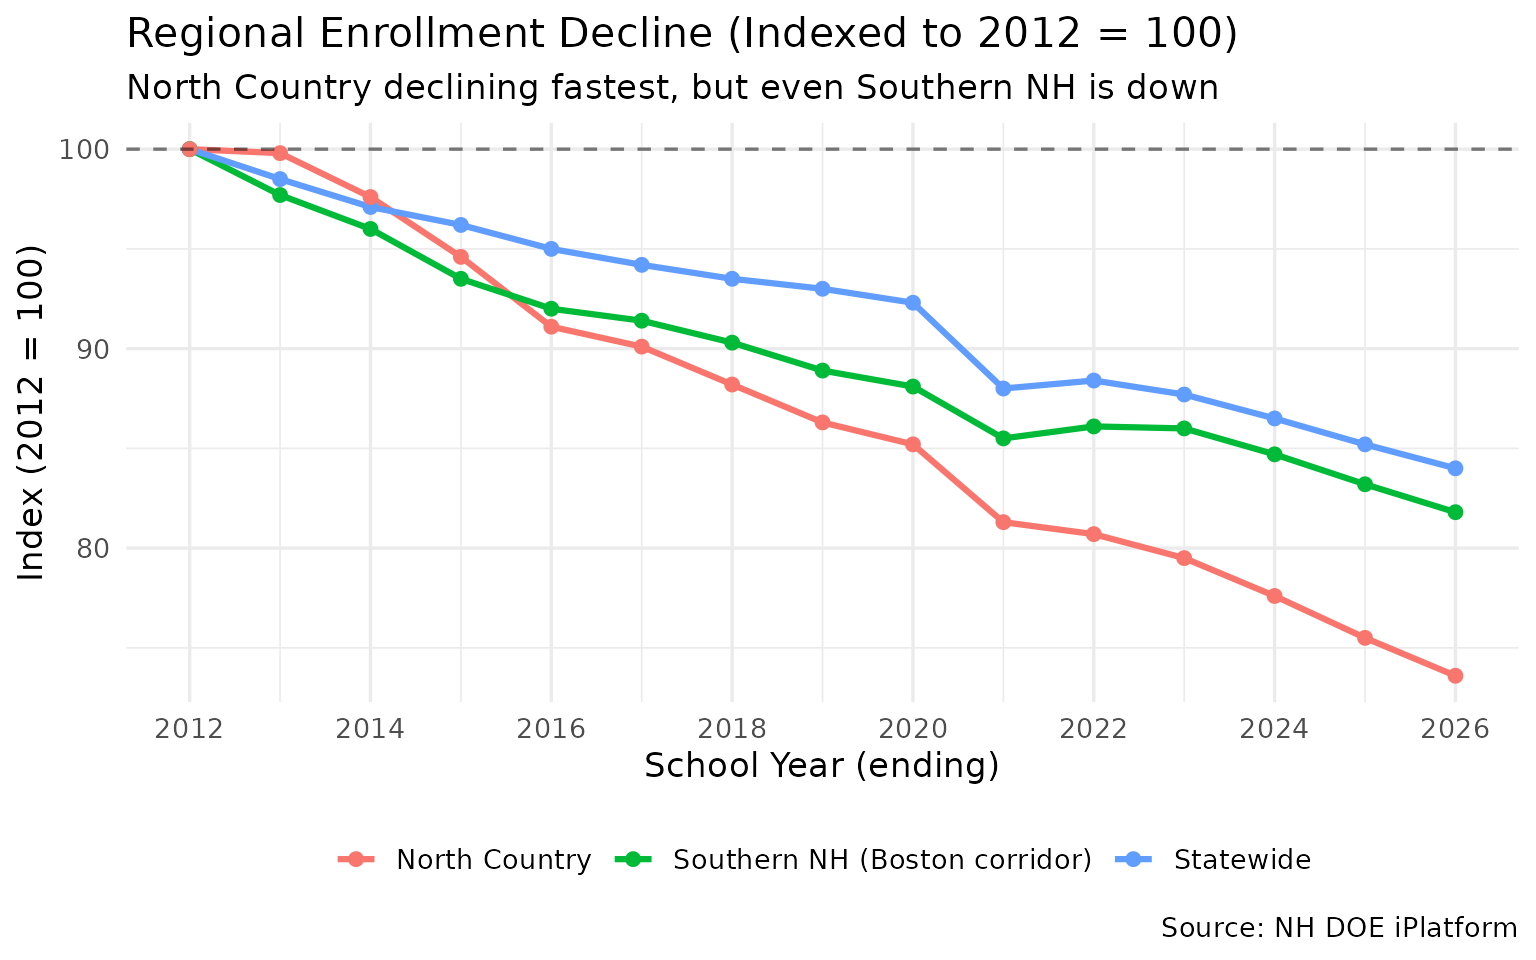
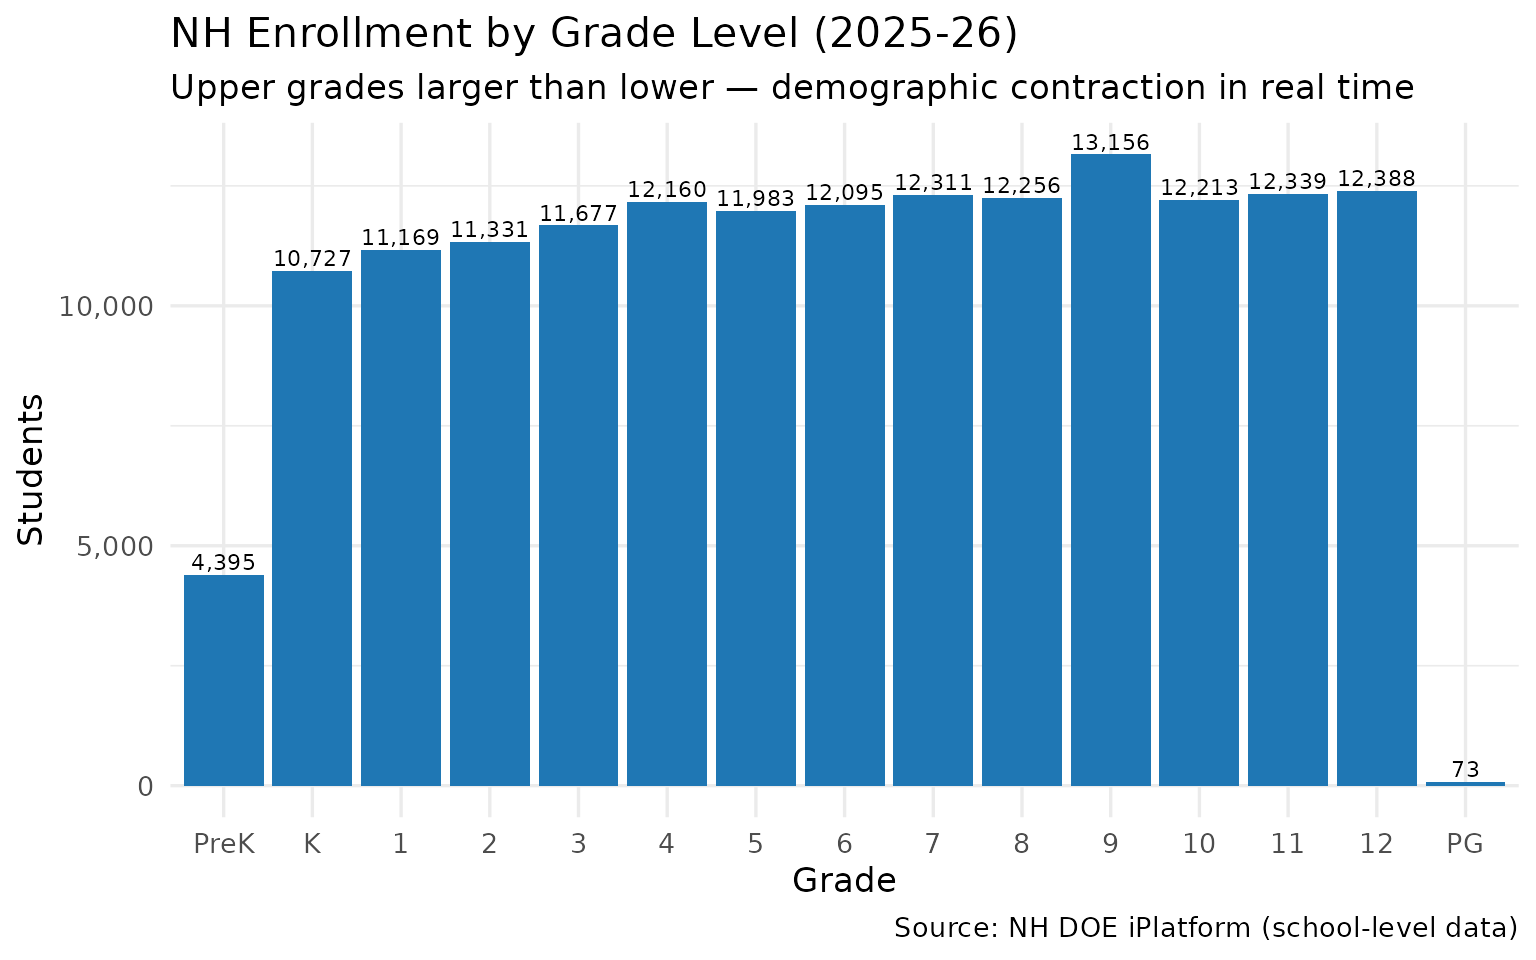
15. The grade pyramid: where NH’s students are
The 2025-26 grade distribution shows that upper grades have more students than lower grades — confirming the downward demographic trend. Grade 9 has the most students (13,156), while Grade 1 has the fewest K-12 (11,169).
grade_dist <- enr |>
  filter(is_campus, subgroup == "total_enrollment",
         end_year == 2026,
         !grade_level %in% c("TOTAL", "ELEM", "MIDDLE", "HIGH")) |>
  group_by(grade_level) |>
  summarize(n_students = sum(n_students, na.rm = TRUE), .groups = "drop") |>
  arrange(grade_level)

stopifnot(nrow(grade_dist) > 0)
grade_dist
#> # A tibble: 15 × 2
#> grade_level n_students
#> <chr> <int>
#> 1 01 11169
#> 2 02 11331
#> 3 03 11677
#> 4 04 12160
#> 5 05 11983
#> 6 06 12095
#> 7 07 12311
#> 8 08 12256
#> 9 09 13156
#> 10 10 12213
#> 11 11 12339
#> 12 12 12388
#> 13 K 10727
#> 14 PG 73
#> 15 PK 4395