New Hampshire’s public schools enrolled 160,322 students in 2025-26, down 30,483 from 190,805 in 2011-12. That is 16.0% of the state’s public school system, gone in fourteen years, and it is the single fact that shapes every other number here: which districts consolidate, what a seat costs, who the remaining students are.
nhschooldata is part of the njschooldata family. Ordinary R and Python calls are offline and verify retained New Hampshire Department of Education artifacts before parsing them.
Full documentation — every function documented, working examples, and 36 charted stories across six articles.
Vignettes:
- Enrollment analysis — 15 stories on the statewide decline, COVID, charter growth, district size, and the grade pipeline
- Assessment analysis — 3 stories on the post-COVID math slump, the economic achievement gap, and the NECAP-to-Smarter-Balanced regime change
- Finance analysis — 4 stories on per-pupil cost growth, small-district scale, the local property tax, and where the money goes
- Special education analysis — 6 stories on the tenfold rise in autism, learning disability’s fading dominance, and the changing demographics of disability (2000-2024)
- English learner analysis — 5 stories on rising EL counts against falling enrollment, the Manchester/Nashua concentration, and the monitored former-EL population (2014-2026)
- Facilities analysis — 3 stories on building aid, surveyed square footage, and unused buildings
- Snapshot status — what is retained, what is live-only, and what is missing
Highlights
1. NH lost 30,000 students since 2012
State enrollment fell from 190,805 to 160,322 — a 16% decline driven by demographic contraction in one of America’s oldest-population states.
library(nhschooldata)
library(dplyr)
library(ggplot2)
library(tidyr)

enr <- fetch_enr_multi(2012:2026, use_cache = TRUE)

state_trend <- enr |>
  filter(is_state, subgroup == "total_enrollment", grade_level == "TOTAL") |>
  select(end_year, n_students) |>
  arrange(end_year)

stopifnot(nrow(state_trend) > 0)

state_trend |>
  mutate(
    change = n_students - lag(n_students),
    cumulative_change = n_students - first(n_students)
  )
#>    end_year n_students change cumulative_change
#> 1      2012     190805     NA                 0
#> 2      2013     187962  -2843             -2843
#> 3      2014     185320  -2642             -5485
#> 4      2015     183604  -1716             -7201
#> 5      2016     181339  -2265             -9466
#> 6      2017     179734  -1605            -11071
#> 7      2018     178328  -1406            -12477
#> 8      2019     177365   -963            -13440
#> 9      2020     176168  -1197            -14637
#> 10     2021     167909  -8259            -22896
#> 11     2022     168620    711            -22185
#> 12     2023     167357  -1263            -23448
#> 13     2024     165082  -2275            -25723
#> 14     2025     162660  -2422            -28145
#> 15     2026     160322  -2338            -30483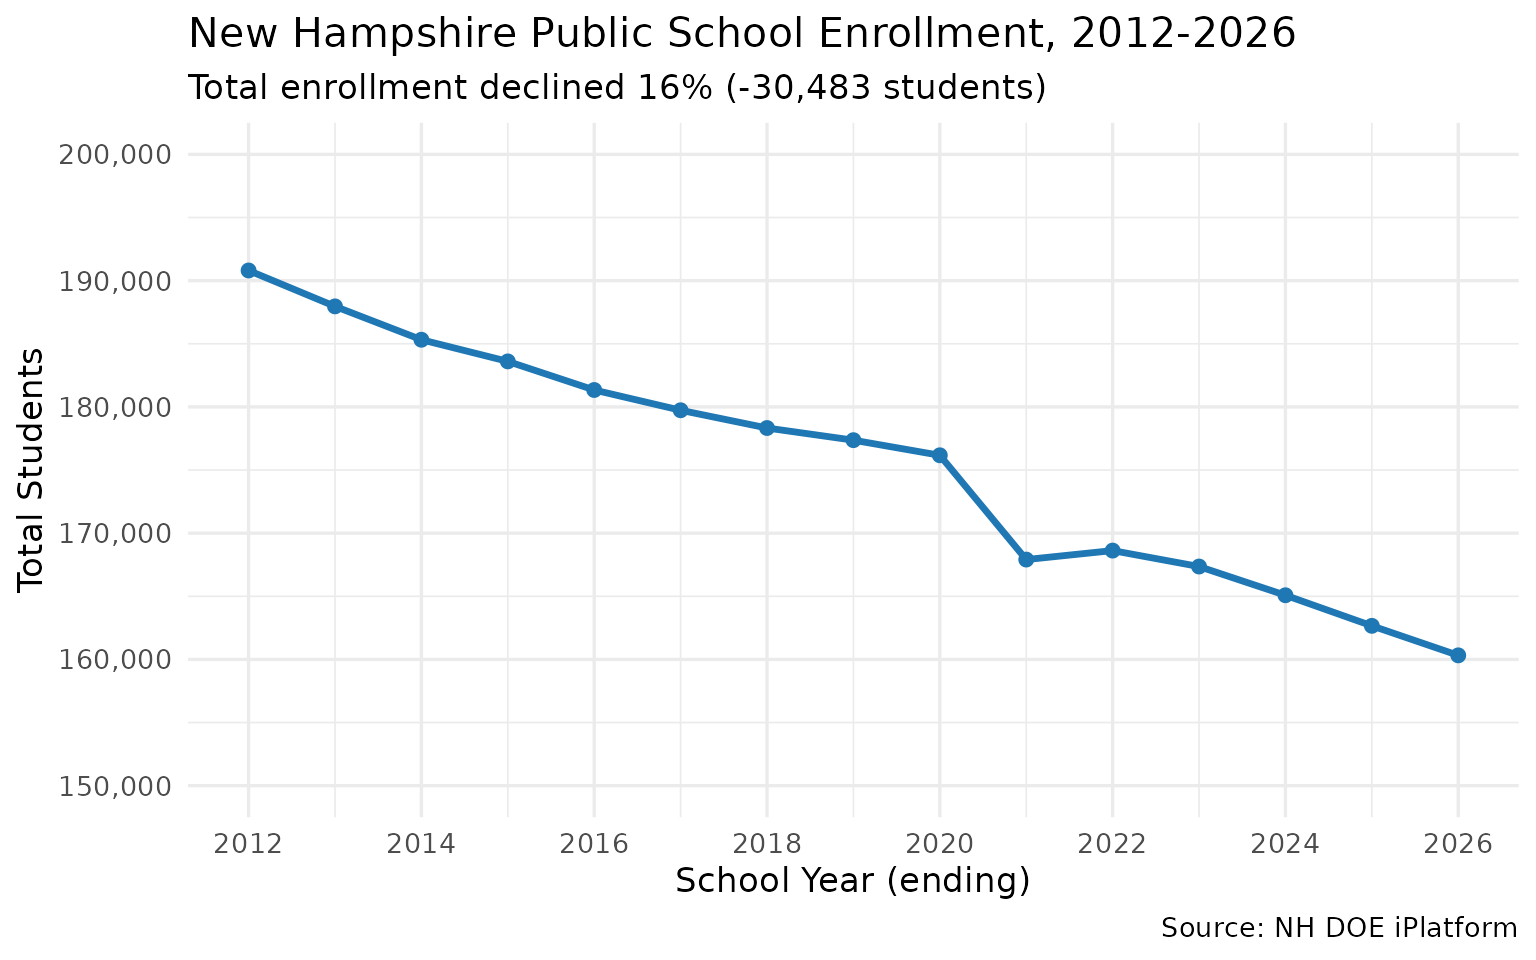
2. Autism child count grew almost tenfold since 2000
In 2000, 397 New Hampshire students carried autism as their primary disability. By 2024 that figure was 3,990 — roughly a tenfold rise, even as the overall special-education population barely moved. Autism went from 1.3% of all students with disabilities to more than 12%.
library(nhschooldata)
library(dplyr)
library(ggplot2)
library(scales)

sped <- fetch_sped_multi(2000:2024, use_cache = TRUE)

autism <- sped |>
  filter(disability_category == "autism", subgroup == "total", is.na(age_group)) |>
  select(end_year, n_students, pct) |>
  arrange(end_year)

stopifnot(nrow(autism) > 0)
autism |> filter(end_year %in% c(2000, 2008, 2016, 2024))
#>   end_year n_students        pct
#> 1     2000        397 0.01319945
#> 2     2008       1427 0.04732060
#> 3     2016       2870 0.09918783
#> 4     2024       3990 0.12343769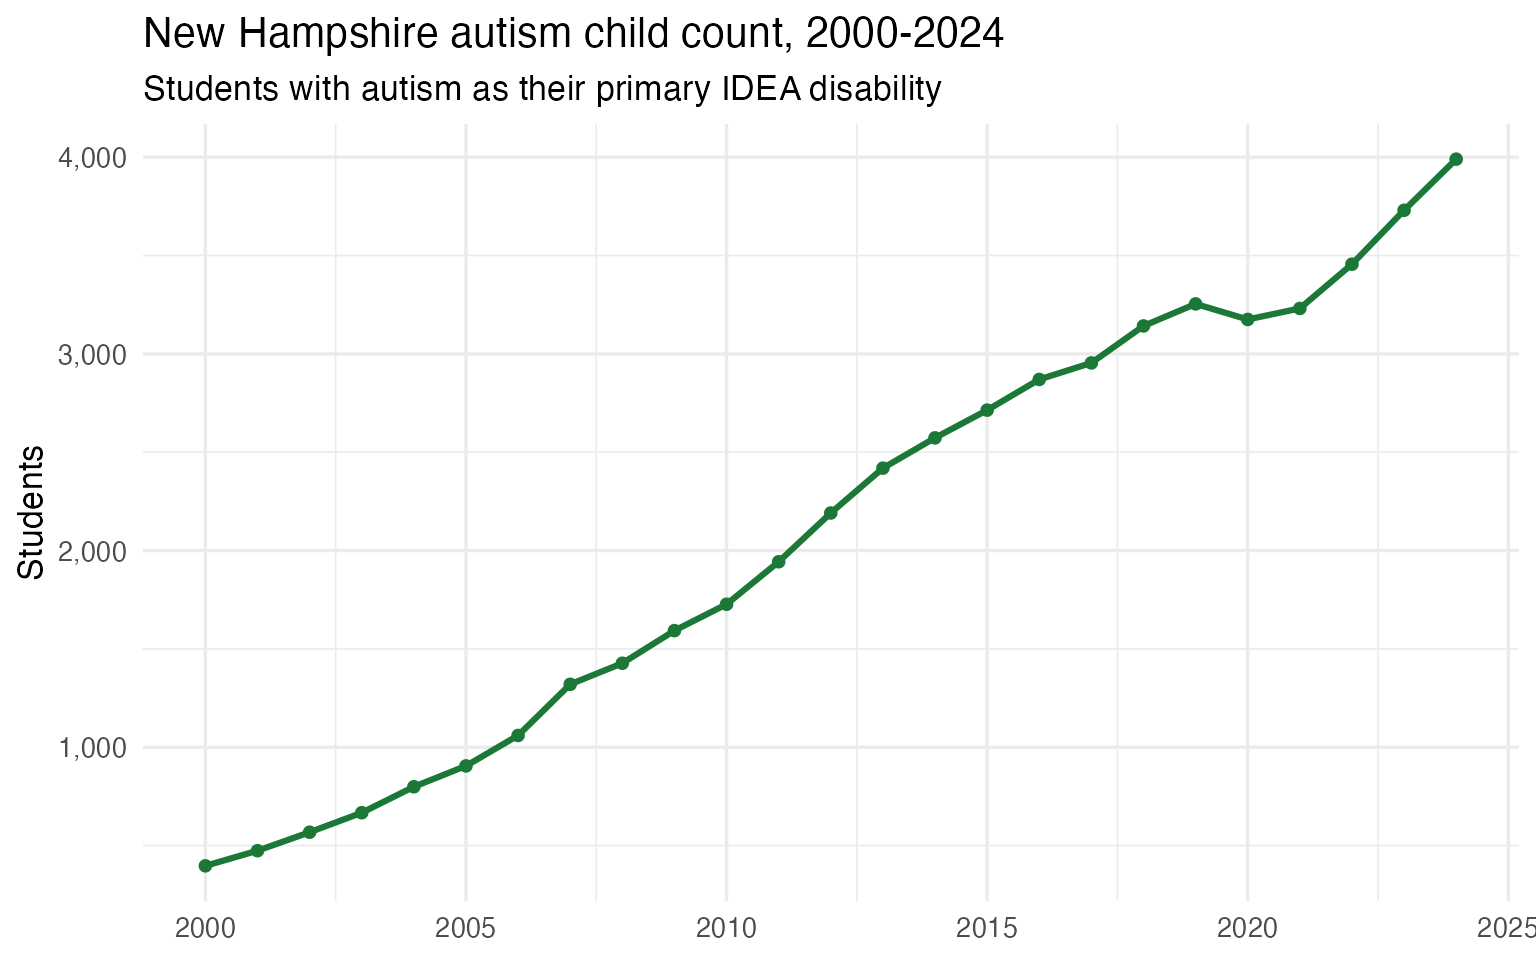
3. English learners are rising while overall enrollment falls
New Hampshire’s total public-school enrollment shrank by about 25,000 students between 2014 and 2026. Over the same stretch the number of English learners grew from 4,161 to 6,078 — a 46% increase — pushing the EL share of enrollment from 2.3% to 3.8%, its highest level on record.
library(nhschooldata)
library(dplyr)
library(ggplot2)
library(scales)

ell <- fetch_ell_multi(2014:2026, use_cache = TRUE)

state_el <- ell |>
  filter(is_state, el_status == "current") |>
  select(end_year, n_students, pct_of_enrollment) |>
  mutate(pct = round(pct_of_enrollment * 100, 2)) |>
  arrange(end_year)

stopifnot(nrow(state_el) > 0)
state_el |> filter(end_year %in% c(2014, 2019, 2024, 2026))
#>   end_year n_students pct_of_enrollment  pct
#> 1     2014       4161        0.02245305 2.25
#> 2     2019       5336        0.03008485 3.01
#> 3     2024       5459        0.03308445 3.31
#> 4     2026       6078        0.03792658 3.79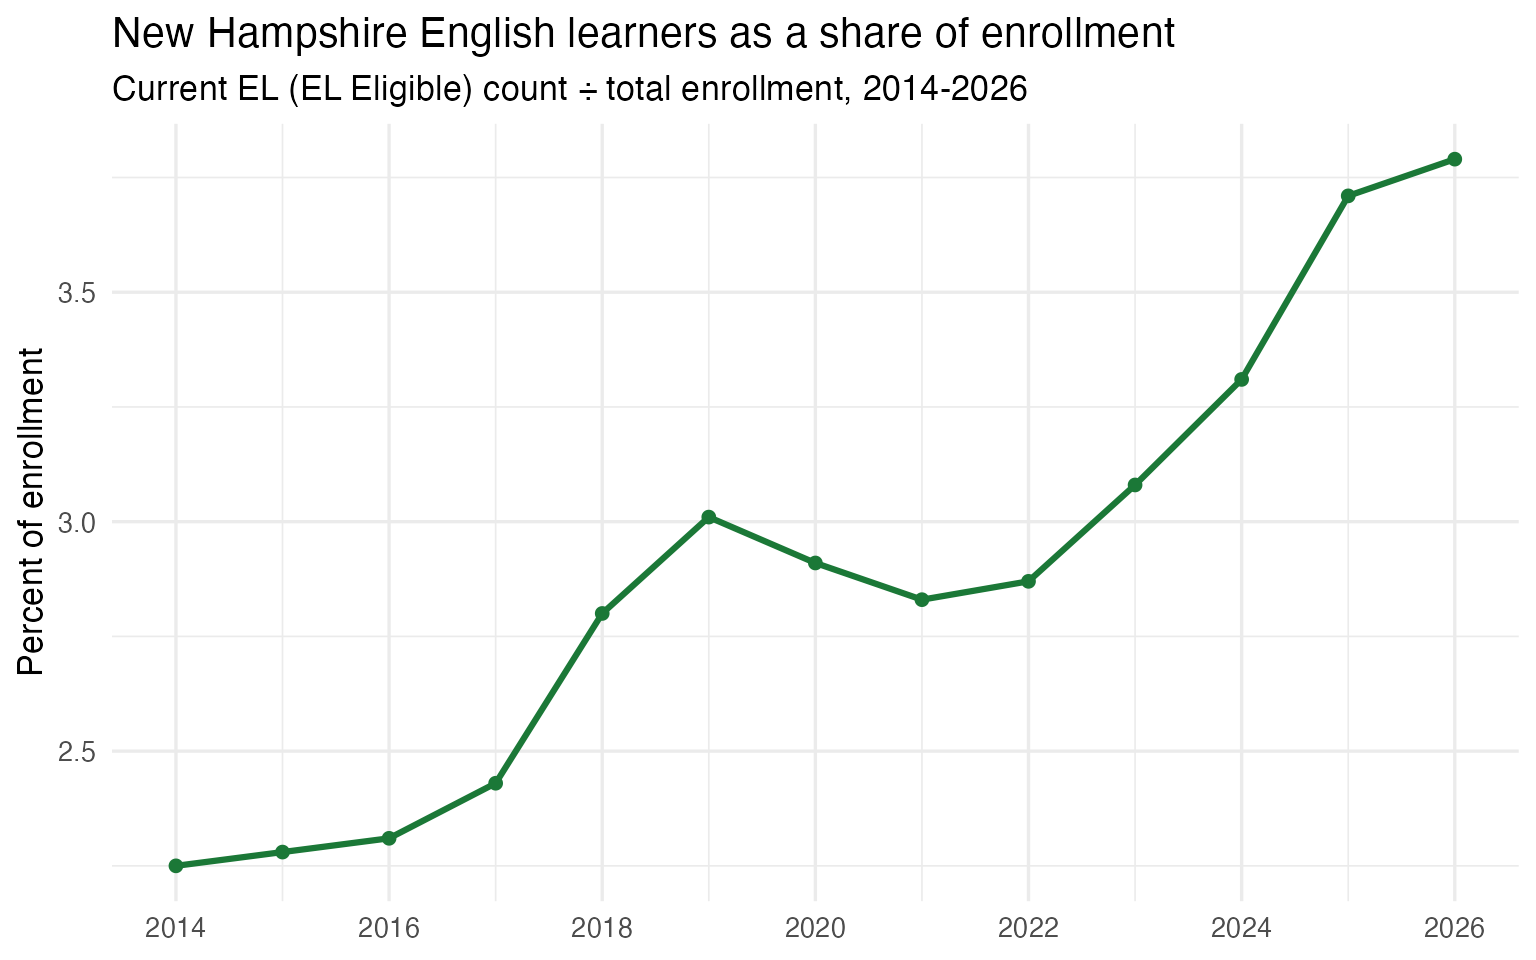
Data Taxonomy
| Category | Years | Function | Details |
|---|---|---|---|
| Enrollment | 2012–2026 |
fetch_enr() / fetch_enr_multi()
|
State, district, campus (the school-level flag is is_campus). Grade-level totals PK–12 plus ELEM/MIDDLE/HIGH/PG rollups |
| Assessments | 2009–2019, 2021–2025 |
fetch_assessment() / fetch_assessment_multi()
|
State, district, school. Subject, grade. Race, gender, econ_disadv, lep, special_ed, homeless, foster_care, military_family |
| Graduation | 2015–2025 |
fetch_graduation() / fetch_graduation_multi()
|
State, district, school. Cohort, graduate, HiSET, dropout counts |
| Directory | Current | fetch_directory() |
Live-only SAU, district, school and personnel register; never cached or bundled |
| Per-Pupil Spending | 2008–2025 |
fetch_finance() / fetch_finance_multi()
|
State, district. Cost per pupil, revenue and expenditure detail |
| Accountability | — | — | Not yet available |
| Chronic Absence | — | — | NHED publishes attendance rate, not chronic absenteeism |
| EL Progress | — | — | — |
| Special Ed | 2000–2024 |
fetch_sped() / fetch_sped_multi()
|
State. IDEA disability category, age band, race, gender |
See the full data category taxonomy.
The package also serves English learner population counts for 2014–2026 (fetch_ell() / fetch_ell_multi()): state and district counts for current EL and monitored former-EL students, with the published enrollment denominator. These are population counts, not ELP assessment results or reclassification rates.
Beyond the Tier 1–2 table, the package also serves staff/personnel (fetch_staff(), metric-specific windows: role FTE 2017–2022, student-teacher ratio 2008–2022, attainment 2008–2019 and 2021–2022, teacher average salary 2008–2024) and the NHED facilities inventory, attributes, capital needs, projects, finance and closures (fetch_facilities()).
Snapshot Status
The enrolled families use package-local derivatives verified by sha256 and byte length at read time. Derived records cite the parent publications retained under data-raw/ by path and digest. Unretained assessment CSV and crosswalk API parents are identified explicitly without claiming a retained publisher digest.
Directory is a deliberate exception to packaged-default acquisition: fetch_directory() has no arguments and freshly contacts the authoritative NH DOE source on every call, returning an honest declared miss if that current attempt fails.
Three surfaces are live-only, because no artifact for them is retained: chronic absence (fetch_absence()), the facilities environmental category, and the fetch_facility_gis() point layer. Calling any of them in package mode raises rather than returning a thinned frame. The federal NCES crosswalk has the same integrity checks; derived fixtures/caches are excluded from coverage.
Package-held inputs have no claimed live validation receipt. Every bundled data file is verified by sha256 and byte length at read time. A missing bundle or failed integrity check stops before parsing or network I/O. Digests identify retained bytes; they do not claim live validation. Retained-only surfaces reject live requests rather than reporting a new acquisition.
Quick Start
# install.packages("devtools")
devtools::install_github("almartin82/nhschooldata")

library(nhschooldata)
assessment <- fetch_assessment(2025)
source_provenance(assessment)$source
#> [1] "package"
# pip install git+https://github.com/almartin82/nhschooldata.git#subdirectory=pynhschooldata
import pynhschooldata as nh
assessment = nh.fetch_assessment(2025)
assessment.attrs["source_provenance"]["source"]
# 'package'Historical and facilities fetchers accept source, max_age_days, and refresh. Live access requires both source = "live" and the explicit maintainer opt-in NHSCHOOLDATA_ALLOW_LIVE=true; ordinary tests and documentation never use it.
Data Notes
Source. Every value comes from a New Hampshire state publication: the NH DOE Bureau of Education Statistics data reports and iPlatform, plus NHED facility survey and building-aid documents. Nothing is sourced from a federal aggregator. Federal NCES identifiers (nces_dist, nces_sch) are attached as optional join keys alongside the native NH ids; they never supply a value.
Acquisition. NHED sits behind an Akamai WAF that blocks on TLS fingerprint rather than IP, so a plain curl or httr request fails where a browser succeeds. Source files are harvested with headed Playwright (data-raw/*_playwright.py, REFRESH.md) and retained in the repository; they are not downloaded at call time.
Reporting periods. Enrollment is the October 1 membership count. The special education child count is the federal IDEA Section 618 December 1 census, a different collection from enrollment, so the two will not reconcile. EL counts are October 1.
Suppression and gaps. Suppressed source cells are NA, never zero, and never imputed. In the special-education race tables, blank cells are real zeros: the seven race cells reconcile to each published disability total. EL reports publish literal zeros without suppression. NH folds deafness into hearing impairment from 2008 on, so deafness is NA from 2008 rather than 0. Assessment year 2020 is absent because no statewide test was administered. Staff attainment has no 2020 file. NH’s 2012 and 2013 EL reports list zero for every district because the ESOL feed was not yet connected; those years are excluded rather than shown as false zeros. NH publishes no school-level EL count and no district-level special education child count, so those levels are absent rather than invented.