Exploring New Hampshire English Learner Data
Source:vignettes/nh-english-learners.Rmd
nh-english-learners.Rmdfetch_ell() returns New Hampshire’s English Learner (EL)
population in one tidy frame. This is NH DOE’s own “LEP Eligible and
Monitor Counts in Public School Districts” report (iPlatform), reported
at the state and district level each
October 1. Two EL statuses are published:
-
current(“EL Eligible”) — students currently identified as English Learners and receiving language services. -
monitored(“EL Monitor”) — students in the four-year monitored status after attaining English proficiency on the ACCESS for ELLs assessment (former EL students still tracked).
A few ground rules the data respects:
- Every number traces to a published NH DOE report. Nothing is modeled, interpolated, or hand-typed.
-
pct_of_enrollmentis a real ratio of published values — each count divided by that entity’s published total enrollment (“Enroll Count”) in the same report. It is never a fabricated denominator. - Coverage is 2014-2026. NH’s 2012 and 2013 reports list zero English learners for every district because the ESOL program data feed was not yet connected — those are not-collected, not real zeros, so they are excluded rather than shown as false zeros.
-
State and district only. NH publishes no
school-level EL count, so
is_schoolis alwaysFALSE.
ell <- fetch_ell_multi(2014:2026, use_cache = TRUE)
ell |>
  count(el_status,
        level = dplyr::case_when(is_state ~ "state", TRUE ~ "district"))
#>   el_status    level    n
#> 1   current district 2498
#> 2   current    state   13
#> 3 monitored district 2498
#> 4 monitored    state   13
1. English learners are rising while overall enrollment falls
New Hampshire’s total public-school enrollment shrank by about 25,000 students between 2014 and 2026. Over the same stretch the number of English learners grew from 4,161 to 6,078 — a 46% increase — pushing the EL share of enrollment from 2.3% to 3.8%, its highest level on record.
state_el <- ell |>
  filter(is_state, el_status == "current") |>
  select(end_year, n_students, pct_of_enrollment) |>
  mutate(pct = round(pct_of_enrollment * 100, 2)) |>
  arrange(end_year)

stopifnot(nrow(state_el) > 0)
state_el |> filter(end_year %in% c(2014, 2019, 2024, 2026))
#>   end_year n_students pct_of_enrollment  pct
#> 1     2014       4161        0.02245305 2.25
#> 2     2019       5336        0.03008485 3.01
#> 3     2024       5459        0.03308445 3.31
#> 4     2026       6078        0.03792658 3.79
ggplot(state_el, aes(end_year, pct)) +
  geom_line(color = "#1b7837", linewidth = 1.1) +
  geom_point(color = "#1b7837", size = 1.8) +
  scale_x_continuous(breaks = seq(2014, 2026, 2)) +
  labs(
    title = "New Hampshire English learners as a share of enrollment",
    subtitle = "Current EL (EL Eligible) count ÷ total enrollment, 2014-2026",
    x = NULL, y = "Percent of enrollment"
  ) +
  theme_minimal(base_size = 13)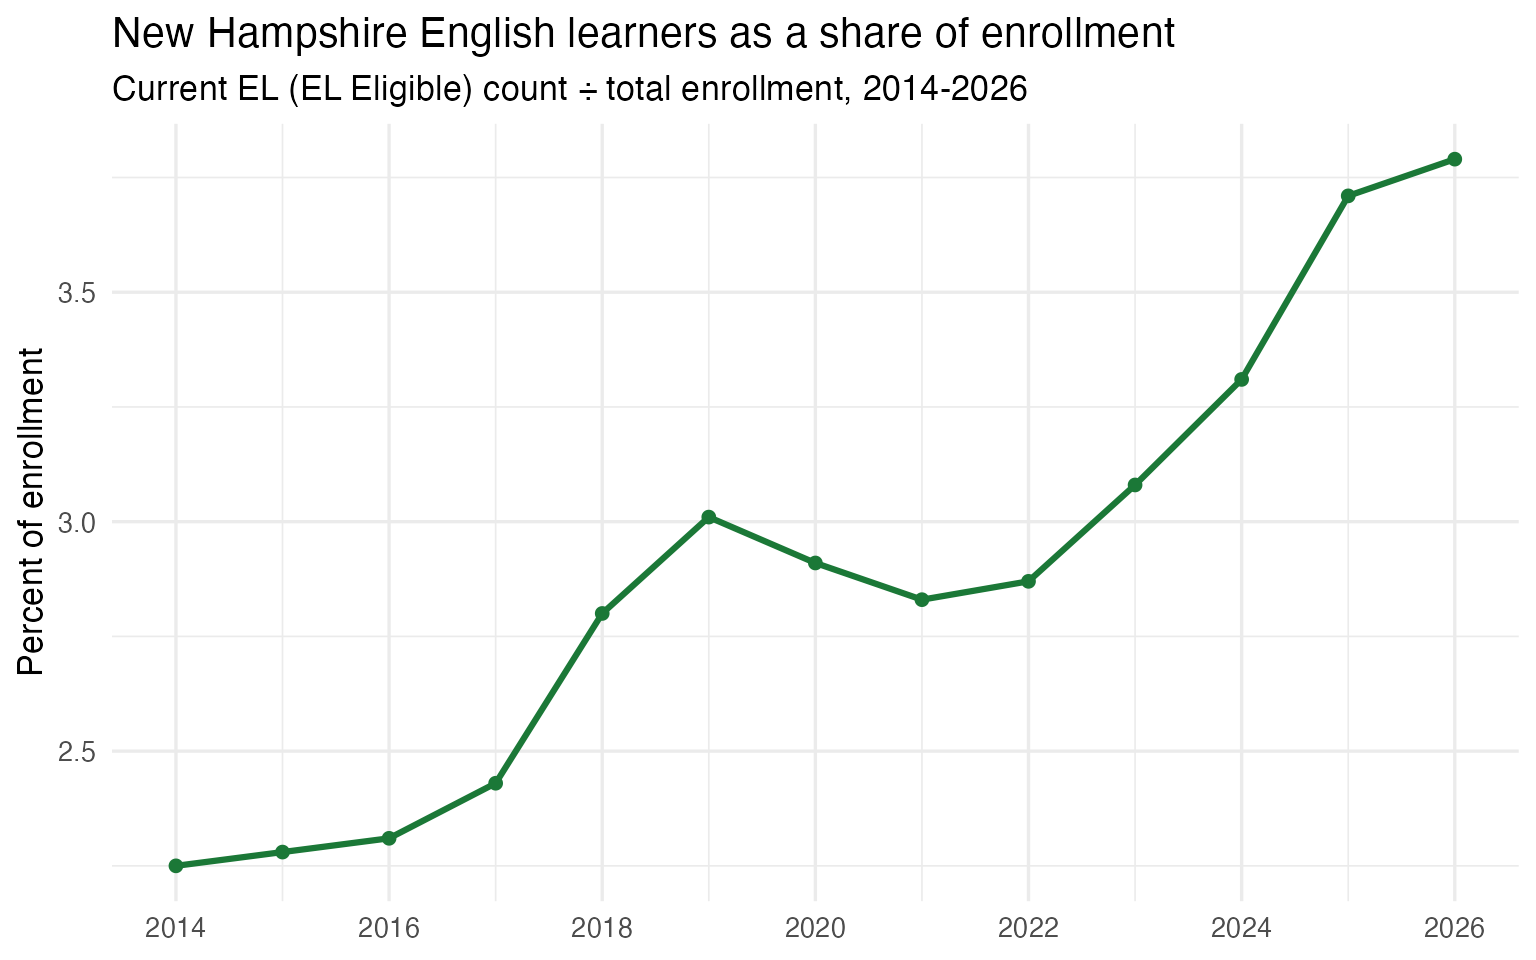
2. Two cities hold most of New Hampshire’s English learners
English learners are highly concentrated. In 2026 Manchester (2,184) and Nashua (1,648) together enrolled 3,832 of the state’s 6,078 current English learners — 63% of the statewide total — even though they are just two of more than 200 public school districts.
top_2026 <- ell |>
  filter(is_district, el_status == "current", end_year == 2026) |>
  arrange(desc(n_students)) |>
  mutate(pct = round(pct_of_enrollment * 100, 1)) |>
  select(district_name, n_students, pct)

stopifnot(nrow(top_2026) > 0)
top_2026 |> head(8)
#>   district_name n_students  pct
#> 1    Manchester       2184 18.6
#> 2        Nashua       1648 17.3
#> 3       Concord        201  5.4
#> 4         Dover        129  3.7
#> 5         Keene         91  3.1
#> 6       Bedford         90  2.3
#> 7    Portsmouth         86  3.6
#> 8         Salem         83  2.4

state_total_2026 <- ell |>
  filter(is_state, el_status == "current", end_year == 2026) |>
  pull(n_students)
two_city_share <- round(sum(top_2026$n_students[1:2]) / state_total_2026 * 100, 1)
two_city_share
#> [1] 63
ggplot(head(top_2026, 10),
       aes(reorder(district_name, n_students), n_students)) +
  geom_col(fill = "#2166ac") +
  coord_flip() +
  scale_y_continuous(labels = comma) +
  labs(
    title = "NH districts with the most English learners, 2026",
    x = NULL, y = "Current English learners"
  ) +
  theme_minimal(base_size = 12)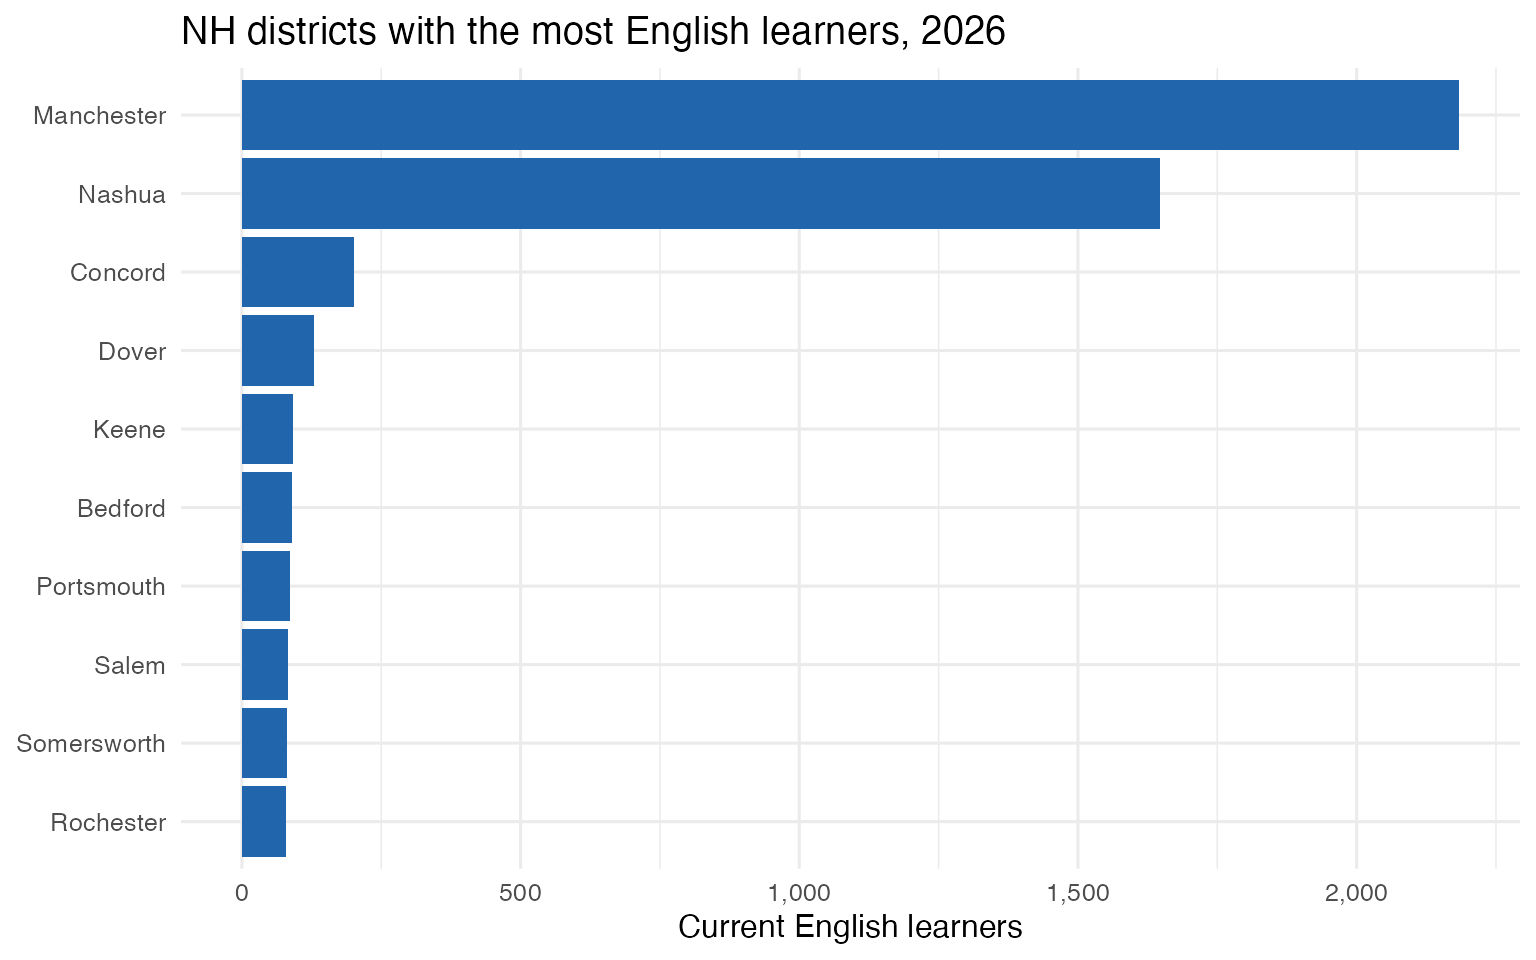
3. In Manchester and Nashua, EL share has climbed sharply
It is not just that the two cities are large — their English-learner intensity is rising fast. Nashua’s EL share more than doubled, from 7.0% of enrollment in 2014 to 17.3% in 2026, and Manchester’s rose from 10.9% to 18.6%. Nearly one in five students in each city is now an English learner.
cities <- ell |>
  filter(is_district, el_status == "current",
         district_name %in% c("Manchester", "Nashua")) |>
  mutate(pct = round(pct_of_enrollment * 100, 1)) |>
  select(end_year, district_name, n_students, pct) |>
  arrange(district_name, end_year)

stopifnot(nrow(cities) > 0)
cities |> filter(end_year %in% c(2014, 2020, 2026))
#>   end_year district_name n_students  pct
#> 1     2014    Manchester       1612 10.9
#> 2     2020    Manchester       2001 15.1
#> 3     2026    Manchester       2184 18.6
#> 4     2014        Nashua        813  7.0
#> 5     2020        Nashua       1178 10.7
#> 6     2026        Nashua       1648 17.3
ggplot(cities, aes(end_year, pct, color = district_name)) +
  geom_line(linewidth = 1.1) +
  geom_point(size = 1.6) +
  scale_x_continuous(breaks = seq(2014, 2026, 2)) +
  scale_color_manual(values = c(Manchester = "#d6604d", Nashua = "#4393c3"),
                     name = NULL) +
  labs(
    title = "English-learner share of enrollment: Manchester vs Nashua",
    x = NULL, y = "Percent of enrollment"
  ) +
  theme_minimal(base_size = 13) +
  theme(legend.position = "bottom")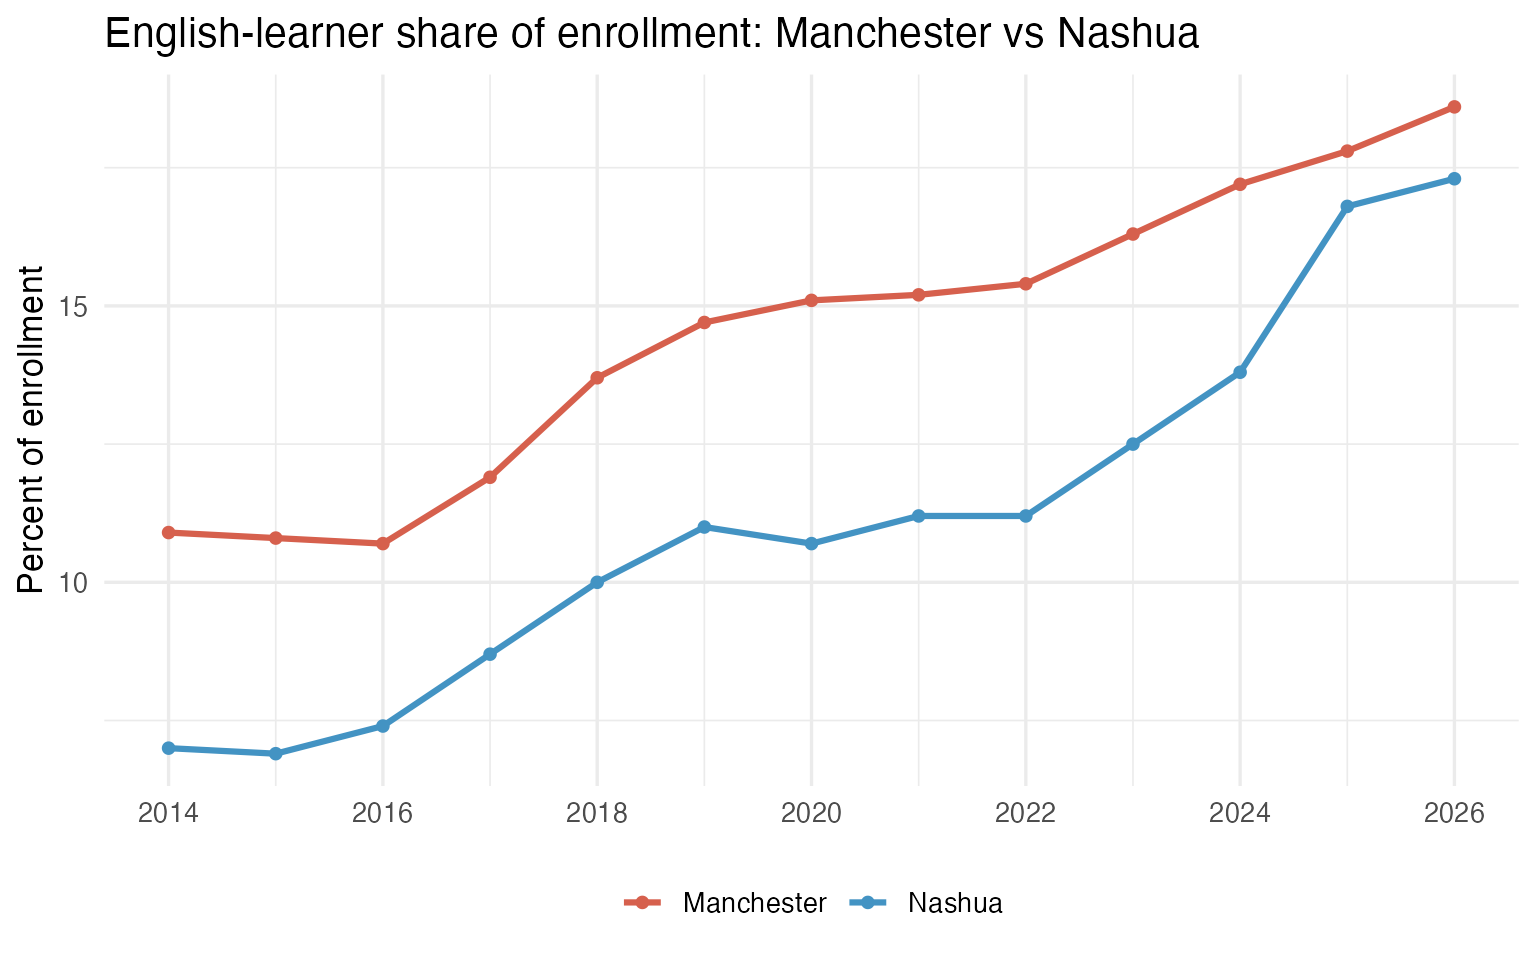
4. The monitored (former-EL) population
Students who reach English proficiency move into a four-year “monitored” status before exiting EL services entirely. New Hampshire’s monitored population dipped to just 472 in 2019 and then climbed back above 1,800 by 2026 — a reminder that the monitored count reflects how many students recently exited active EL status, not how many are currently learning English.
both <- ell |>
  filter(is_state) |>
  select(end_year, el_status, n_students) |>
  arrange(end_year, el_status)

stopifnot(nrow(both) > 0)
both |>
  tidyr::pivot_wider(names_from = el_status, values_from = n_students) |>
  filter(end_year %in% c(2014, 2018, 2019, 2023, 2026))
#> # A tibble: 5 × 3
#>   end_year current monitored
#>      <int>   <int>     <int>
#> 1     2014    4161      1337
#> 2     2018    4990       706
#> 3     2019    5336       472
#> 4     2023    5154      1916
#> 5     2026    6078      1819
ggplot(both, aes(end_year, n_students, fill = el_status)) +
  geom_col(position = "stack") +
  scale_y_continuous(labels = comma) +
  scale_x_continuous(breaks = seq(2014, 2026, 2)) +
  scale_fill_manual(values = c(current = "#1b7837", monitored = "#a6dba0"),
                    name = NULL,
                    labels = c("Current EL", "Monitored (former EL)")) +
  labs(
    title = "NH English learners by status, 2014-2026",
    x = NULL, y = "Students"
  ) +
  theme_minimal(base_size = 13) +
  theme(legend.position = "bottom")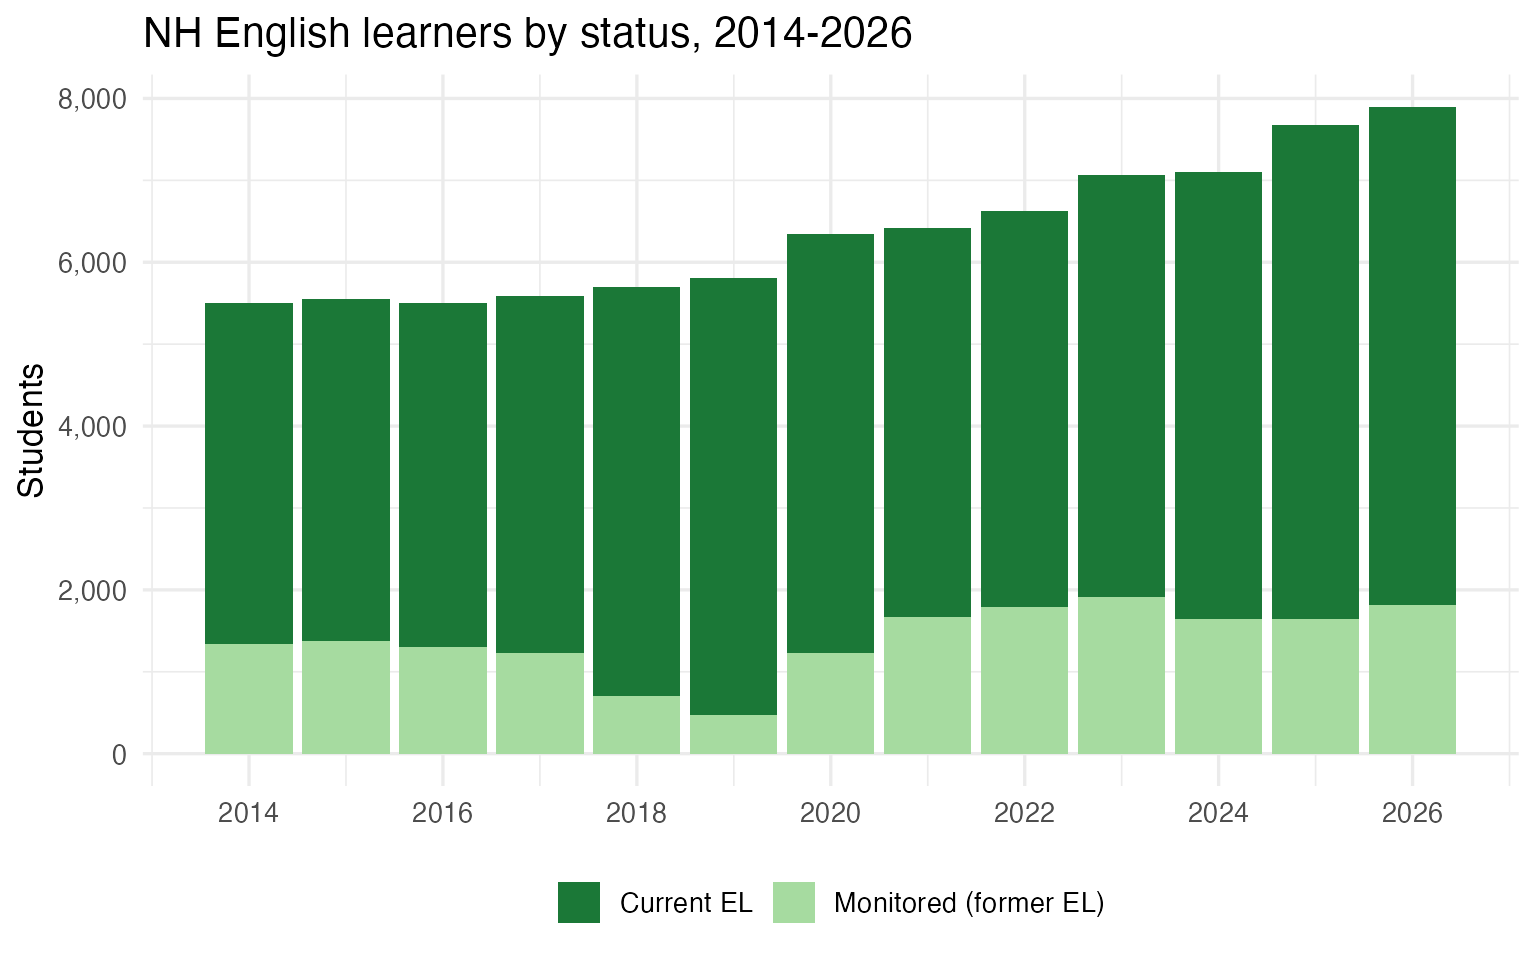
5. Most districts have very few English learners
The flip side of the concentration story: the typical New Hampshire district serves only a handful of English learners. In 2026 a large majority of districts reported fewer than ten current EL students, and many reported none — English learners are an intense local phenomenon in a few communities rather than a statewide one.
dist_2026 <- ell |>
  filter(is_district, el_status == "current", end_year == 2026) |>
  mutate(band = cut(n_students,
                    breaks = c(-1, 0, 9, 49, 199, Inf),
                    labels = c("0", "1-9", "10-49", "50-199", "200+"))) |>
  count(band)

stopifnot(nrow(dist_2026) > 0)
dist_2026
#>     band  n
#> 1      0 75
#> 2    1-9 65
#> 3  10-49 48
#> 4 50-199 11
#> 5   200+  3
ggplot(dist_2026, aes(band, n)) +
  geom_col(fill = "#762a83") +
  labs(
    title = "NH districts by number of English learners, 2026",
    x = "Current English learners in district", y = "Number of districts"
  ) +
  theme_minimal(base_size = 13)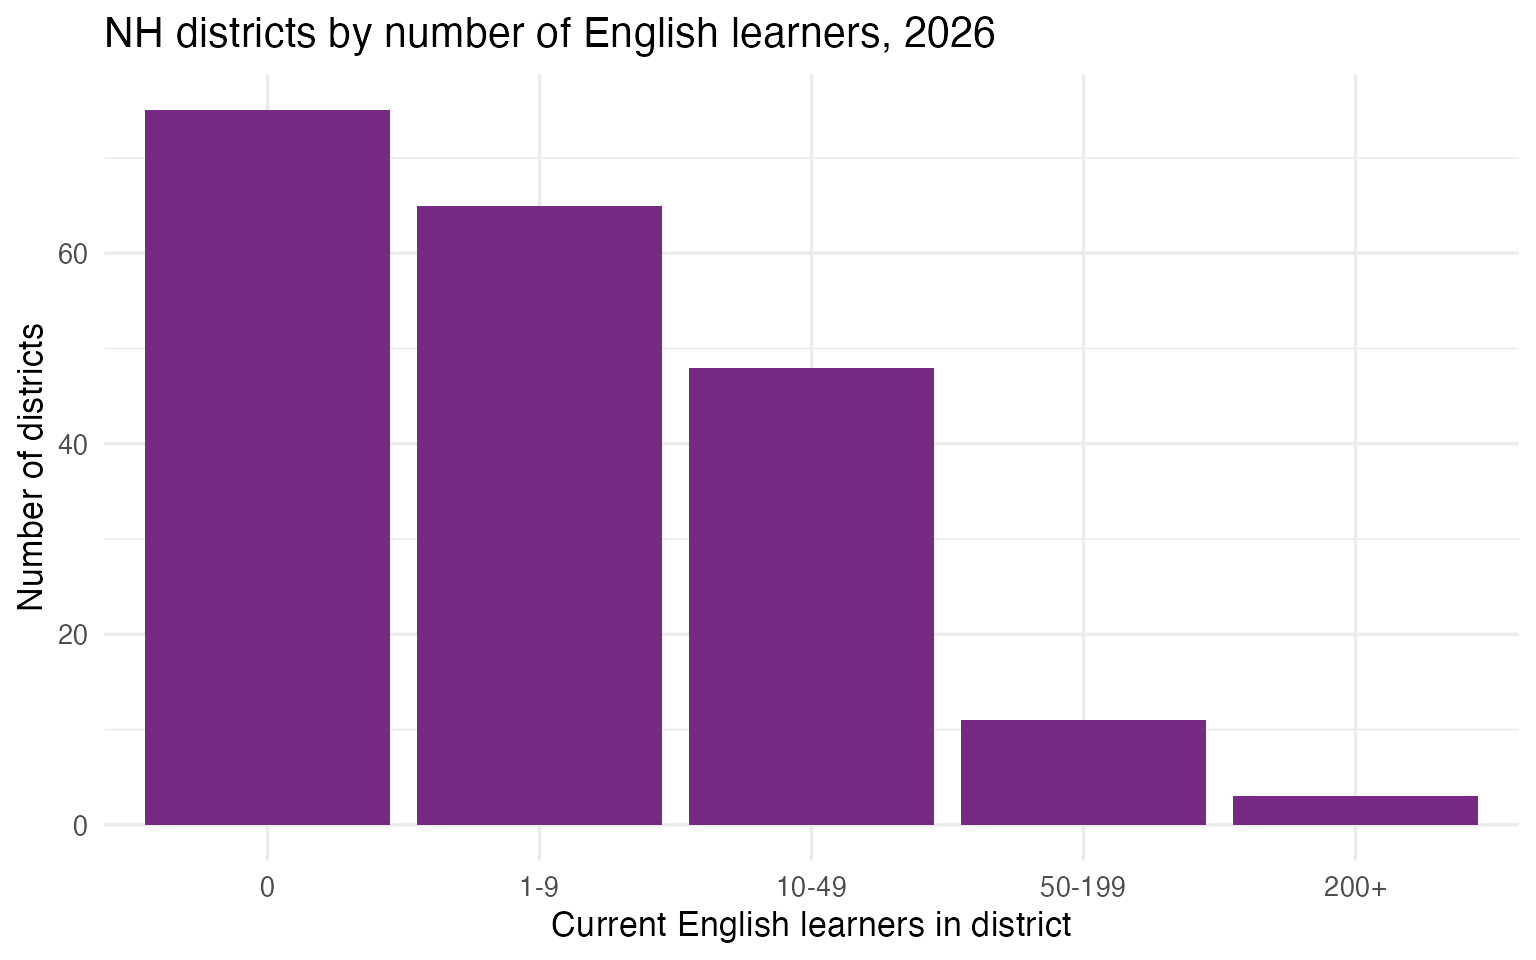
Notes on the data
- Source: NH DOE iPlatform public report “Limited English Proficiency Enrollment” (Enrollments — Demographic Categories). Data fed from the NH DOE ESOL program; “Total includes students in Public District Schools, Public Academies, Joint Maintenance Agreement and Charter Schools.”
-
Two statuses:
current= EL Eligible (currently identified English learners);monitored= EL Monitor (four-year post-proficiency monitoring on ACCESS for ELLs). These are distinct populations and are not summed. -
Share of enrollment:
pct_of_enrollmentdivides each count by the district’s published total enrollment in the same report. - Coverage: 2014-2026. 2012-2013 are excluded — those reports list zero EL students for every district (the ESOL data feed was not yet connected), which is not-collected rather than a true zero.
-
No suppression: counts are published as plain
integers, including legitimate district zeros, so
n_students_lower/n_students_upperequaln_students. - This is the EL population (a headcount feature). EL proficiency results (the ACCESS for ELLs assessment) are a separate, not-yet-available collection.
sessionInfo()
#> R version 4.5.0 (2025-04-11)
#> Platform: aarch64-apple-darwin22.6.0
#> Running under: macOS 26.1
#>
#> Matrix products: default
#> BLAS:   /opt/homebrew/Cellar/openblas/0.3.30/lib/libopenblasp-r0.3.30.dylib
#> LAPACK: /opt/homebrew/Cellar/r/4.5.0/lib/R/lib/libRlapack.dylib;  LAPACK version 3.12.1
#>
#> locale:
#> [1] en_US.UTF-8/en_US.UTF-8/en_US.UTF-8/C/en_US.UTF-8/en_US.UTF-8
#>
#> time zone: America/New_York
#> tzcode source: internal
#>
#> attached base packages:
#> [1] stats     graphics  grDevices utils     datasets  methods   base
#>
#> other attached packages:
#> [1] scales_1.4.0       ggplot2_4.0.1      dplyr_1.2.1        nhschooldata_0.3.4
#>
#> loaded via a namespace (and not attached):
#>  [1] tidyr_1.3.2        rappdirs_0.3.4     sass_0.4.10        generics_0.1.4
#>  [5] hms_1.1.4          digest_0.6.39      magrittr_2.0.5     evaluate_1.0.5
#>  [9] grid_4.5.0         RColorBrewer_1.1-3 fastmap_1.2.0      jsonlite_2.0.0
#> [13] purrr_1.2.2        codetools_0.2-20   textshaping_1.0.4  jquerylib_0.1.4
#> [17] cli_3.6.6          rlang_1.3.0        crayon_1.5.3       bit64_4.8.2
#> [21] withr_3.0.3        cachem_1.1.0       yaml_2.3.12        otel_0.2.0
#> [25] tools_4.5.0        parallel_4.5.0     tzdb_0.5.0         vctrs_0.7.3
#> [29] R6_2.6.1           lifecycle_1.0.5    fs_2.1.0           htmlwidgets_1.6.4
#> [33] bit_4.6.0          vroom_1.7.1        ragg_1.5.0         pkgconfig_2.0.3
#> [37] desc_1.4.3         pkgdown_2.2.0      pillar_1.11.1      bslib_0.9.0
#> [41] gtable_0.3.6       glue_1.8.1         systemfonts_1.3.1  xfun_0.55
#> [45] tibble_3.3.1       tidyselect_1.2.1   knitr_1.51         farver_2.1.2
#> [49] htmltools_0.5.9    rmarkdown_2.30     labeling_0.4.3     readr_2.2.0
#> [53] compiler_4.5.0     S7_0.2.1