Exploring New Hampshire School Facilities Data
Source:vignettes/newhampshire-facilities.Rmd
newhampshire-facilities.RmdNew Hampshire facilities data lives in a few public state systems
rather than one master facilities table. fetch_facilities()
pulls those sources into one canonical long schema:
available <- get_available_facilities()
available
#>         category               source source_agency source_type
#> 1      inventory nhed_facility_survey          NHED        xlsx
#> 2     attributes nhed_facility_survey          NHED        xlsx
#> 3  capital_needs nhed_facility_survey          NHED        xlsx
#> 4  capital_needs    nhed_building_aid          NHED         pdf
#> 5       projects    nhed_building_aid          NHED         pdf
#> 6        finance nhed_facility_survey          NHED        xlsx
#> 7        finance    nhed_building_aid          NHED         pdf
#> 8  environmental nhed_facility_survey          NHED        xlsx
#> 9  environmental           nhdes_lead         NHDES      arcgis
#> 10      closures     nhed_unused_2025          NHED         pdf
#> 11      closures     nhed_unused_2023          NHED         pdf
#>                                     vintage
#> 1            2018-2019 NHED facility survey
#> 2            2018-2019 NHED facility survey
#> 3            2018-2019 NHED facility survey
#> 4  FY2026 proposed building aid ranked list
#> 5  FY2026 proposed building aid ranked list
#> 6            2018-2019 NHED facility survey
#> 7  FY2026 proposed building aid ranked list
#> 8            2018-2019 NHED facility survey
#> 9        NHDES LeadInSchools live 2016-2026
#> 10              July 2025 unused facilities
#> 11              July 2023 unused facilities
The shipped coverage is intentionally partial. The NHED 2018-2019 facility survey contributes school inventory, building attributes, budget fields, and capital need flags. The NHED FY2026 proposed building-aid list adds project costs and estimated maximum aid awards. NHED unused-facility survey PDFs add closed/unused building records. No populated public statewide capacity/utilization or facility-condition-index source has been verified, so those categories are not returned as placeholders.
Two of the categories get_available_facilities() lists
are discoverable but not shipped: environmental (the NHDES
LeadInSchools outlet results) and the fetch_facility_gis()
point layer are live-only, because no artifact for them is retained in
the package. Calling either in package mode raises rather than returning
a thinned frame, so this article covers only the categories the package
can serve offline. To read them you need source = "live"
and the maintainer opt-in NHSCHOOLDATA_ALLOW_LIVE=true.
projects <- fetch_facilities("projects", use_cache = TRUE)
attributes <- fetch_facilities("attributes", use_cache = TRUE)
closures <- fetch_facilities_multi("closures", c(2023, 2025), use_cache = TRUE)
bind_rows(
  projects,
  attributes,
  closures
) |>
  count(category, entity_level) |>
  arrange(category, entity_level)
#>     category entity_level    n
#> 1 attributes       school 5417
#> 2   closures     building   40
#> 3   projects      project   31
1. FY2026 building aid is concentrated in seven projects
NHED’s FY2026 proposed building-aid ranked list contains seven projects with $125.6 million in estimated maximum building aid. The largest is Concord’s Rundlett Middle School replacement: $65.8 million in estimated maximum aid on a $164.6 million project.
project_awards <- projects |>
  select(entity_id, entity_name, metric, value) |>
  pivot_wider(names_from = metric, values_from = value) |>
  mutate(
    project_cost = as.numeric(estimated_project_cost),
    max_aid_award = as.numeric(estimated_max_building_aid_award),
    aid_rate = as.numeric(school_building_aid_rate)
  ) |>
  arrange(desc(max_aid_award))

stopifnot(nrow(project_awards) == 7)

project_awards |>
  transmute(
    school = entity_name,
    project = project_name,
    aid_rate = label_percent(scale = 1)(aid_rate),
    project_cost = dollar(project_cost),
    max_aid_award = dollar(max_aid_award)
  )
#> # A tibble: 7 × 5
#>   school                             project aid_rate project_cost max_aid_award
#>   <chr>                              <chr>   <chr>    <chr>        <chr>
#> 1 Rundlett Middle School             New Mi… 40%      $164,623,927 $65,849,571
#> 2 Mildred C. Lakeway Elementary Sch… New K … 45%      $41,250,312  $18,562,640
#> 3 Griffin Memorial School            New El… 30%      $45,412,700  $13,623,810
#> 4 Kearsarge Regional High School     Additi… 33%      $39,926,000  $13,175,580
#> 5 Woodsville Elementary School       Additi… 60%      $15,738,538  $9,443,123
#> 6 Windham Center School              Renova… 30%      $13,879,225  $4,163,768
#> 7 Monroe Consolidated School         Additi… 30%      $2,451,340   $735,402

project_awards |>
  summarize(
    projects = n(),
    total_project_cost = dollar(sum(project_cost)),
    total_max_aid_award = dollar(sum(max_aid_award))
  )
#> # A tibble: 1 × 3
#>   projects total_project_cost total_max_aid_award
#>      <int> <chr>              <chr>
#> 1        7 $323,282,042       $125,553,894
ggplot(project_awards, aes(x = reorder(entity_name, max_aid_award), y = max_aid_award)) +
  geom_col(fill = "#2c7fb8") +
  coord_flip() +
  scale_y_continuous(labels = label_dollar(scale = 1e-6, suffix = "M")) +
  labs(
    title = "NHED FY2026 proposed building aid by project",
    subtitle = "Estimated maximum school building aid award",
    x = NULL,
    y = "Estimated maximum aid"
  ) +
  theme_minimal()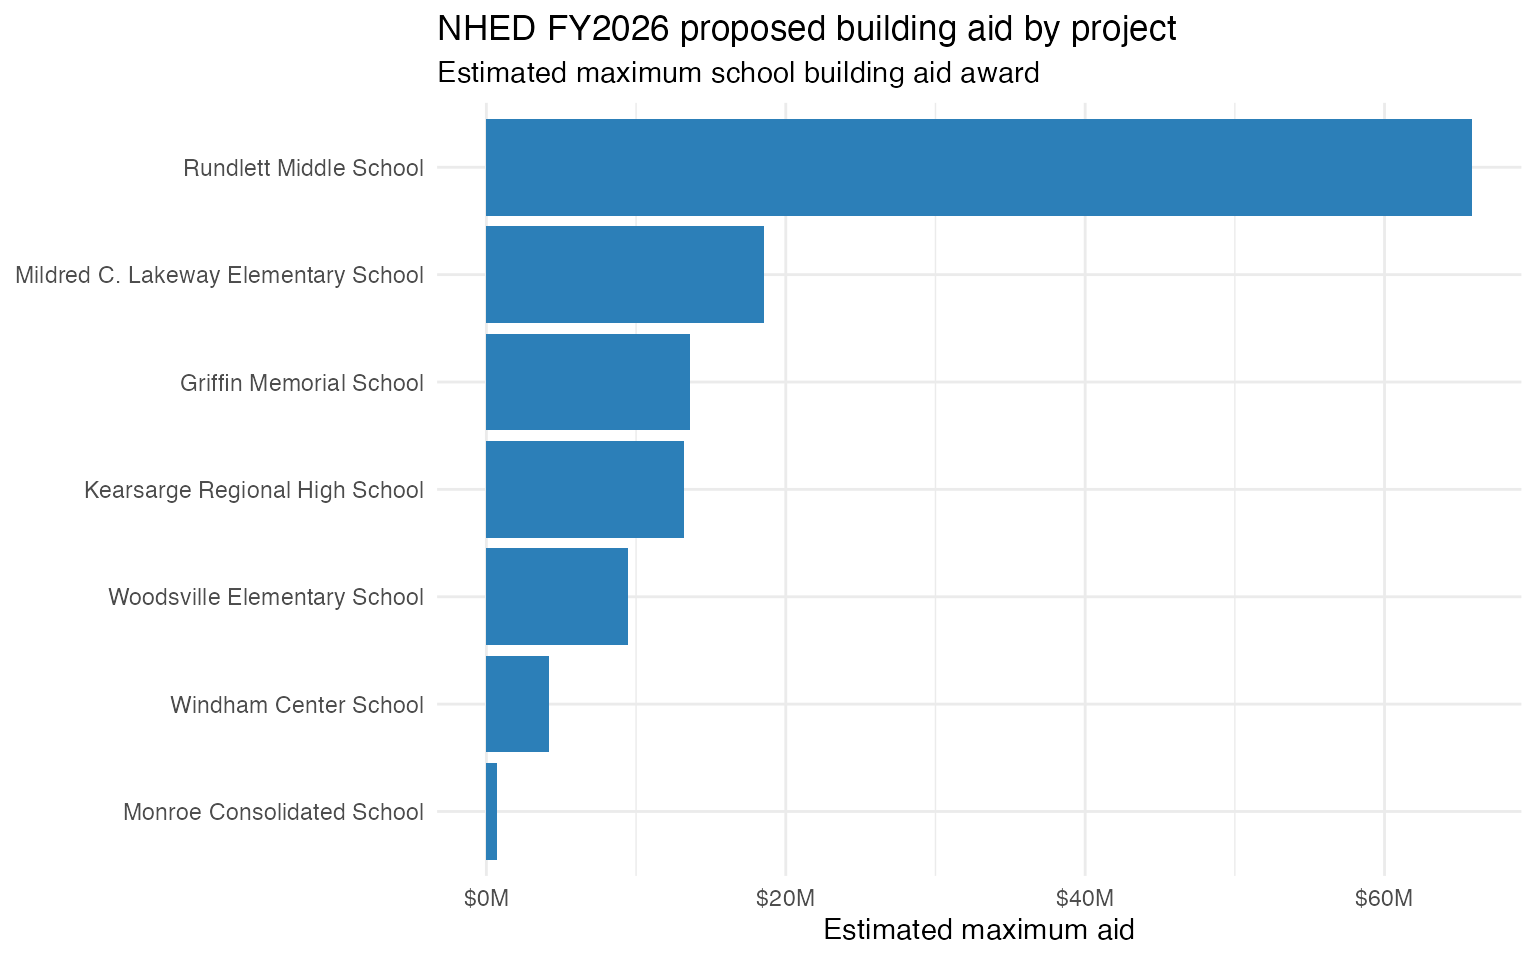
2. The 2018-2019 survey reports 21.6 million square feet
The NHED school facility survey has gross-square-footage responses for 284 schools. Those reported buildings add up to 21.6 million square feet, with a median school at about 59,000 square feet.
school_space <- attributes |>
  filter(metric == "gross_sq_ft") |>
  mutate(gross_sq_ft = as.numeric(value)) |>
  select(entity_name, gross_sq_ft, nces_dist, nces_sch) |>
  arrange(desc(gross_sq_ft))

stopifnot(nrow(school_space) > 0)

school_space |>
  summarize(
    schools_with_sq_ft = n(),
    total_sq_ft = comma(sum(gross_sq_ft)),
    median_sq_ft = comma(median(gross_sq_ft)),
    max_sq_ft = comma(max(gross_sq_ft))
  )
#>   schools_with_sq_ft total_sq_ft median_sq_ft max_sq_ft
#> 1                284  21,621,472       59,164   864,389

school_space |>
  slice_max(gross_sq_ft, n = 10) |>
  mutate(gross_sq_ft = comma(gross_sq_ft))
#>                         entity_name gross_sq_ft nces_dist     nces_sch
#> 1  Kingswood Regional Middle School     864,389   3303330 330333000512
#> 2       Alton Central School (Elem)     856,522   3301440 330144000003
#> 3               Woodman Park School     642,619   3302640 330264000094
#> 4               Concord High School     535,000   3302460 330246000055
#> 5                 Keene High School     342,562   3304050 330405000202
#> 6    Londonderry Senior High School     287,250   3304410 330441000484
#> 7               Bedford High School     226,000   3301740 330174000680
#> 8               Kennett High School     220,000   3302490 330249000076
#> 9             Merrimack High School     213,800   3304740 330474000278
#> 10              Alvirne High School     210,046   3303930 330393000179
school_space |>
  mutate(bucket = cut(
    gross_sq_ft,
    breaks = c(0, 25000, 50000, 100000, 200000, Inf),
    labels = c("<25k", "25k-50k", "50k-100k", "100k-200k", "200k+"),
    right = FALSE
  )) |>
  count(bucket) |>
  ggplot(aes(x = bucket, y = n)) +
  geom_col(fill = "#41ab5d") +
  labs(
    title = "NHED facility-survey school square footage, 2018-2019",
    subtitle = "284 schools reported gross square footage",
    x = "Reported gross square feet",
    y = "Schools"
  ) +
  theme_minimal()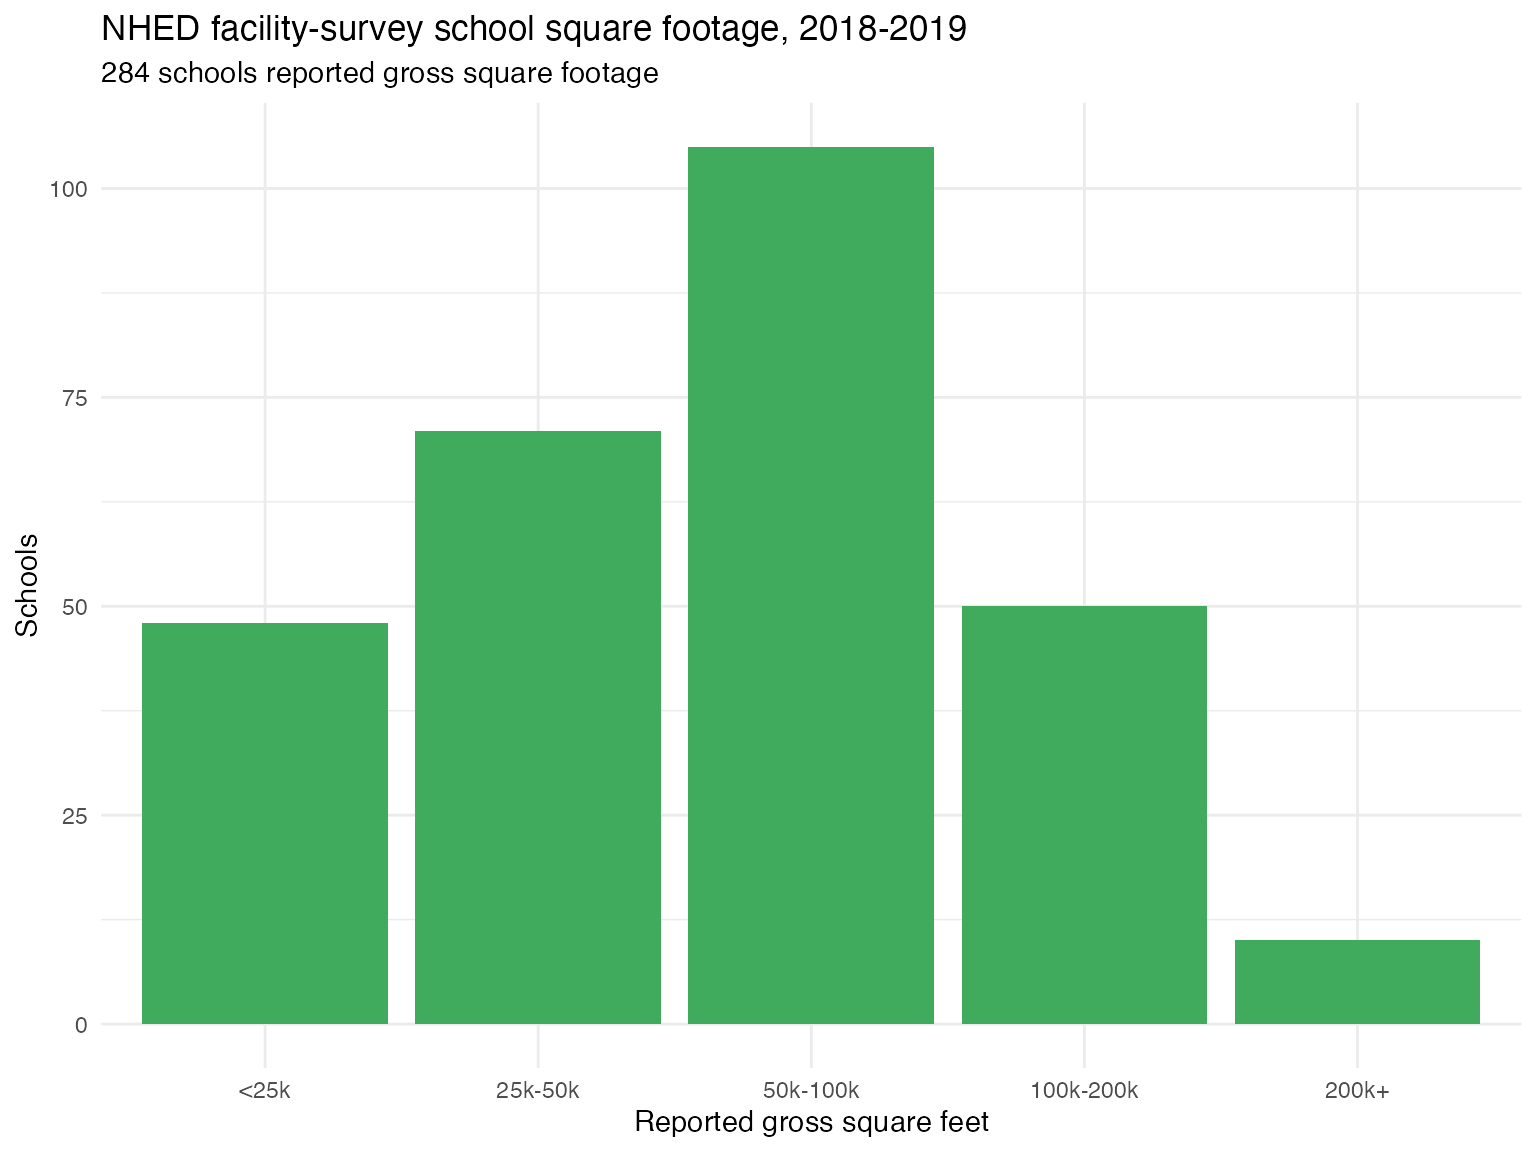
3. Unused-facility surveys list ten public school buildings
NHED’s July 2023 and July 2025 unused-facility survey PDFs list ten building records across two vintages. Concord’s Eastman School appears in both survey years, which means the combined file is useful for tracking source snapshots, not for deduplicating buildings into a current inventory.
unused_buildings <- closures |>
  select(vintage, entity_id, entity_name, metric, value) |>
  pivot_wider(names_from = metric, values_from = value) |>
  arrange(vintage, entity_name)

stopifnot(nrow(unused_buildings) > 0)

unused_buildings |>
  count(vintage)
#> # A tibble: 2 × 2
#>   vintage                         n
#>   <chr>                       <int>
#> 1 July 2023 unused facilities     2
#> 2 July 2025 unused facilities     8

unused_buildings |>
  transmute(
    vintage,
    district = district_name,
    building = entity_name,
    address,
    gross_sq_ft = as.numeric(gross_sq_ft)
  )
#> # A tibble: 10 × 5
#>    vintage                     district             building address gross_sq_ft
#>    <chr>                       <chr>                <chr>    <chr>         <dbl>
#>  1 July 2023 unused facilities Concord              Eastman… 15 Sha…       16500
#>  2 July 2023 unused facilities Winchester           Ford Bu… 83 Par…        2100
#>  3 July 2025 unused facilities Concord              Eastman… 15 Sha…       16500
#>  4 July 2025 unused facilities Mascenic Regional    Lower l… 16 Sch…        4675
#>  5 July 2025 unused facilities Amherst              Museum   1 Scho…        1000
#>  6 July 2025 unused facilities Lempster             Old SAU… 29 Sch…          75
#>  7 July 2025 unused facilities Farmington           Red Sch… 23 Sch…        2100
#>  8 July 2025 unused facilities Farmington           Tan bui… 35 Sch…        2413
#>  9 July 2025 unused facilities Pembroke             The Gra… 302 Pe…         400
#> 10 July 2025 unused facilities Fall Mountain Regio… Village… 509 Ri…       11500
unused_buildings |>
  mutate(gross_sq_ft = as.numeric(gross_sq_ft)) |>
  ggplot(aes(x = reorder(entity_name, gross_sq_ft), y = gross_sq_ft, fill = vintage)) +
  geom_col() +
  coord_flip() +
  scale_y_continuous(labels = comma) +
  labs(
    title = "NHED unused public school facilities",
    subtitle = "July 2023 and July 2025 survey snapshots",
    x = NULL,
    y = "Gross square feet",
    fill = NULL
  ) +
  theme_minimal()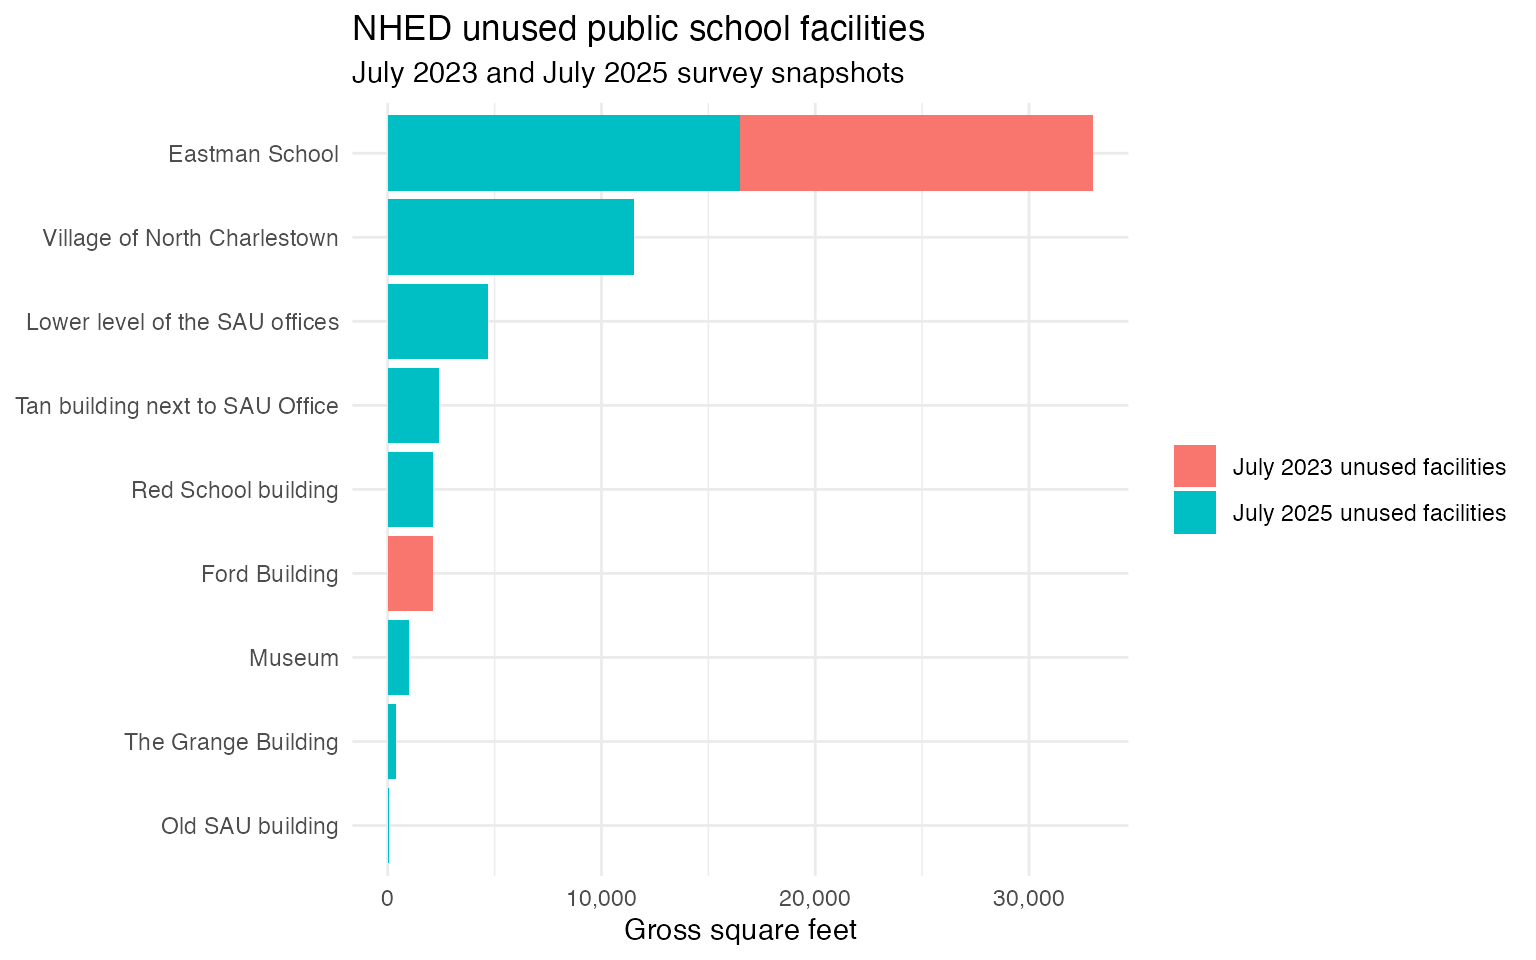
Notes on the data
Every value comes from a New Hampshire public state source: NHED XLSX and PDF files here, and the NHDES ArcGIS service for the live-only categories. Federal NCES identifiers are used only as optional join keys where a school or district can be matched; they do not supply facility values. Missing and blank source cells are dropped rather than zero-filled or imputed.
The value column is character by design. Cast metrics
such as gross_sq_ft, estimated_project_cost,
and estimated_max_building_aid_award only after filtering
to those metrics.