Exploring New Hampshire Special Education Data
Source:vignettes/newhampshire-special-education.Rmd
newhampshire-special-education.Rmdfetch_sped() returns New Hampshire’s special-education
child count in one tidy frame. This is the state’s own publication of
its federal IDEA Section 618 December-1 child count — the “Statewide
Census by Disability” — reported at the state level. Coverage:
- Disability-category totals, every year 2000-2024 (the backbone series).
- IDEA age bands (ages 3-5 and 6-21) for all disabilities, 2000-2023.
- Disability × race and gender counts, 2012-2018 and 2020-2023.
A few ground rules the data respects:
- Every number traces to a published NH DOE census PDF. Nothing is modeled, interpolated, or hand-typed.
-
Suppressed cells are
NA, never 0. NH folds deafness into hearing impairment starting in 2008, sodeafnessisNAfrom 2008 on (it is not zero students — it is no longer reported separately). -
child_countis the December-1 IDEA count, a different collection from the October-1 enrollment membership infetch_enr(). NH publishes no district- or school-level child count and no educational-environment (LRE) placement, so those are absent rather than invented.
sped <- fetch_sped_multi(2000:2024, use_cache = TRUE)
sped |>
  count(measure, subgroup_kind = dplyr::case_when(
    subgroup == "total" & is.na(age_group) ~ "disability total",
    !is.na(age_group)                      ~ "age band",
    subgroup %in% c("male", "female")      ~ "gender",
    TRUE                                   ~ "race"
  ))
#>       measure    subgroup_kind    n
#> 1 child_count         age band   48
#> 2 child_count disability total  375
#> 3 child_count           gender   22
#> 4 child_count             race 1078
1. Autism child count grew almost tenfold since 2000
In 2000, 397 New Hampshire students carried autism as their primary disability. By 2024 that figure was 3,990 — roughly a tenfold rise, even as the overall special-education population barely moved. Autism went from 1.3% of all students with disabilities to more than 12%.
autism <- sped |>
  filter(disability_category == "autism", subgroup == "total", is.na(age_group)) |>
  select(end_year, n_students, pct) |>
  arrange(end_year)

stopifnot(nrow(autism) > 0)
autism |> filter(end_year %in% c(2000, 2008, 2016, 2024))
#>   end_year n_students        pct
#> 1     2000        397 0.01319945
#> 2     2008       1427 0.04732060
#> 3     2016       2870 0.09918783
#> 4     2024       3990 0.12343769
ggplot(autism, aes(end_year, n_students)) +
  geom_line(color = "#1b7837", linewidth = 1.1) +
  geom_point(color = "#1b7837", size = 1.6) +
  scale_y_continuous(labels = comma) +
  labs(
    title = "New Hampshire autism child count, 2000-2024",
    subtitle = "Students with autism as their primary IDEA disability",
    x = NULL, y = "Students"
  ) +
  theme_minimal(base_size = 13)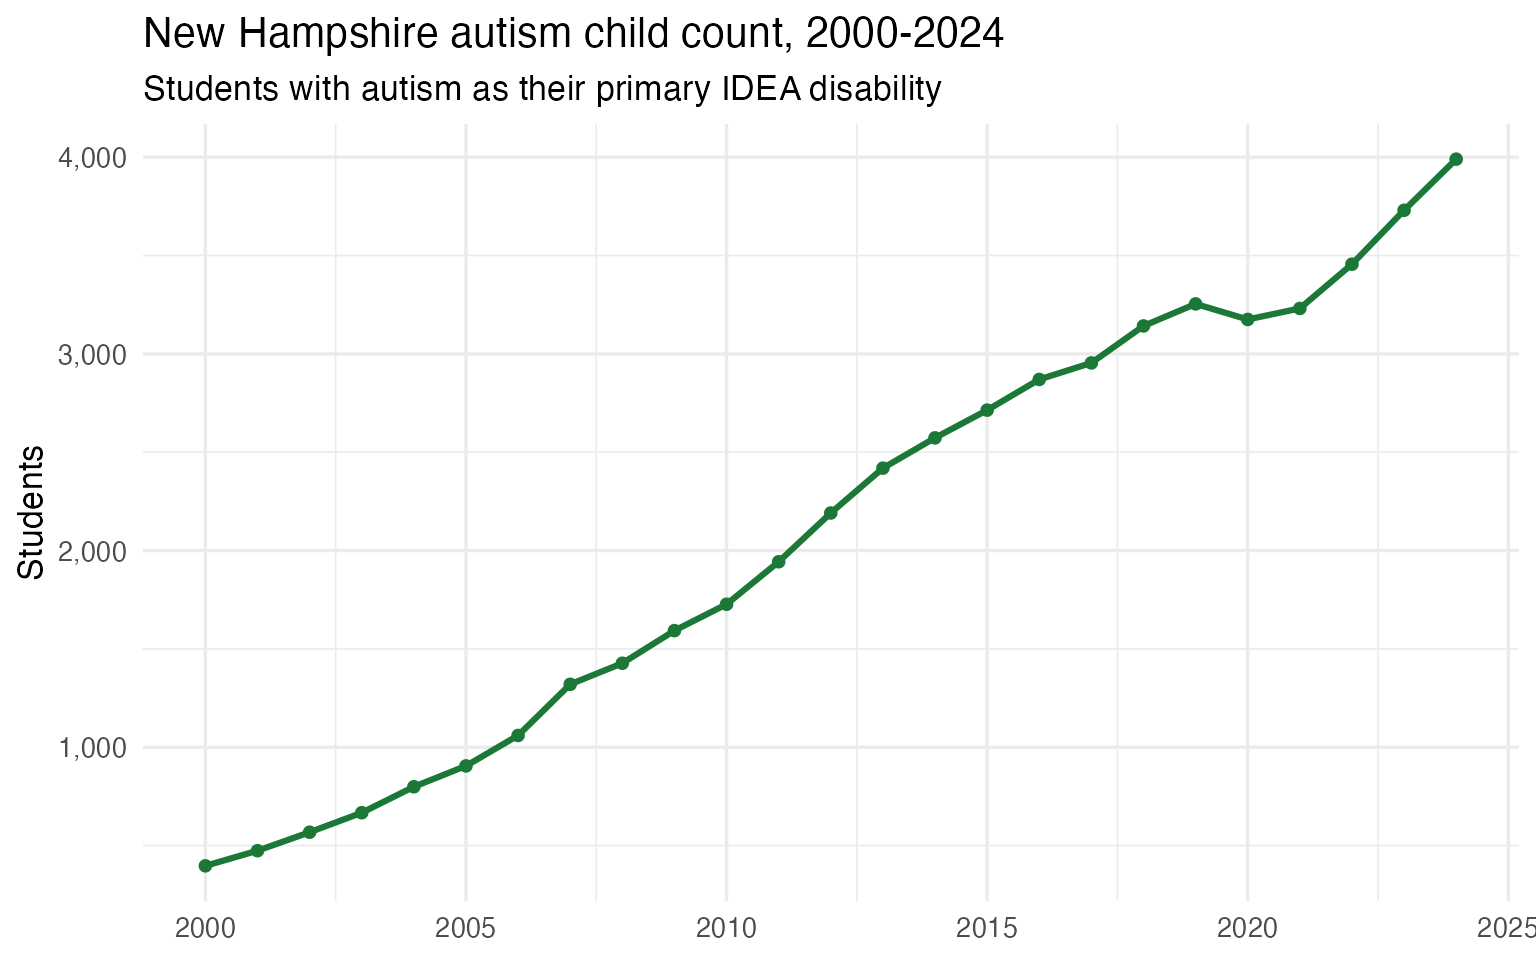
2. Learning disabilities are losing their dominance
Specific learning disability (SLD) was long the single largest category by far — 13,342 students, 44% of the total, in 2000. It is still #1, but its count has fallen to about 10,100 and its share to 31%, while autism and developmental delay have climbed into the top tier.
top4 <- c("specific_learning_disability", "other_health_impairment",
          "developmental_delay", "autism")

trend <- sped |>
  filter(disability_category %in% top4, subgroup == "total", is.na(age_group)) |>
  select(end_year, disability_category, n_students)

stopifnot(nrow(trend) > 0)
trend |>
  filter(end_year %in% c(2000, 2024)) |>
  arrange(disability_category, end_year)
#>   end_year          disability_category n_students
#> 1     2000                       autism        397
#> 2     2024                       autism       3990
#> 3     2000          developmental_delay       1009
#> 4     2024          developmental_delay       5135
#> 5     2000      other_health_impairment       3747
#> 6     2024      other_health_impairment       6190
#> 7     2000 specific_learning_disability      13342
#> 8     2024 specific_learning_disability      10148
ggplot(trend, aes(end_year, n_students, color = disability_category)) +
  geom_line(linewidth = 1) +
  scale_y_continuous(labels = comma) +
  scale_color_brewer(palette = "Dark2", name = NULL,
                     labels = c("Autism", "Developmental delay",
                                "Other health impairment",
                                "Specific learning disability")) +
  labs(
    title = "The four largest NH disability categories, 2000-2024",
    x = NULL, y = "Students"
  ) +
  theme_minimal(base_size = 13) +
  theme(legend.position = "bottom")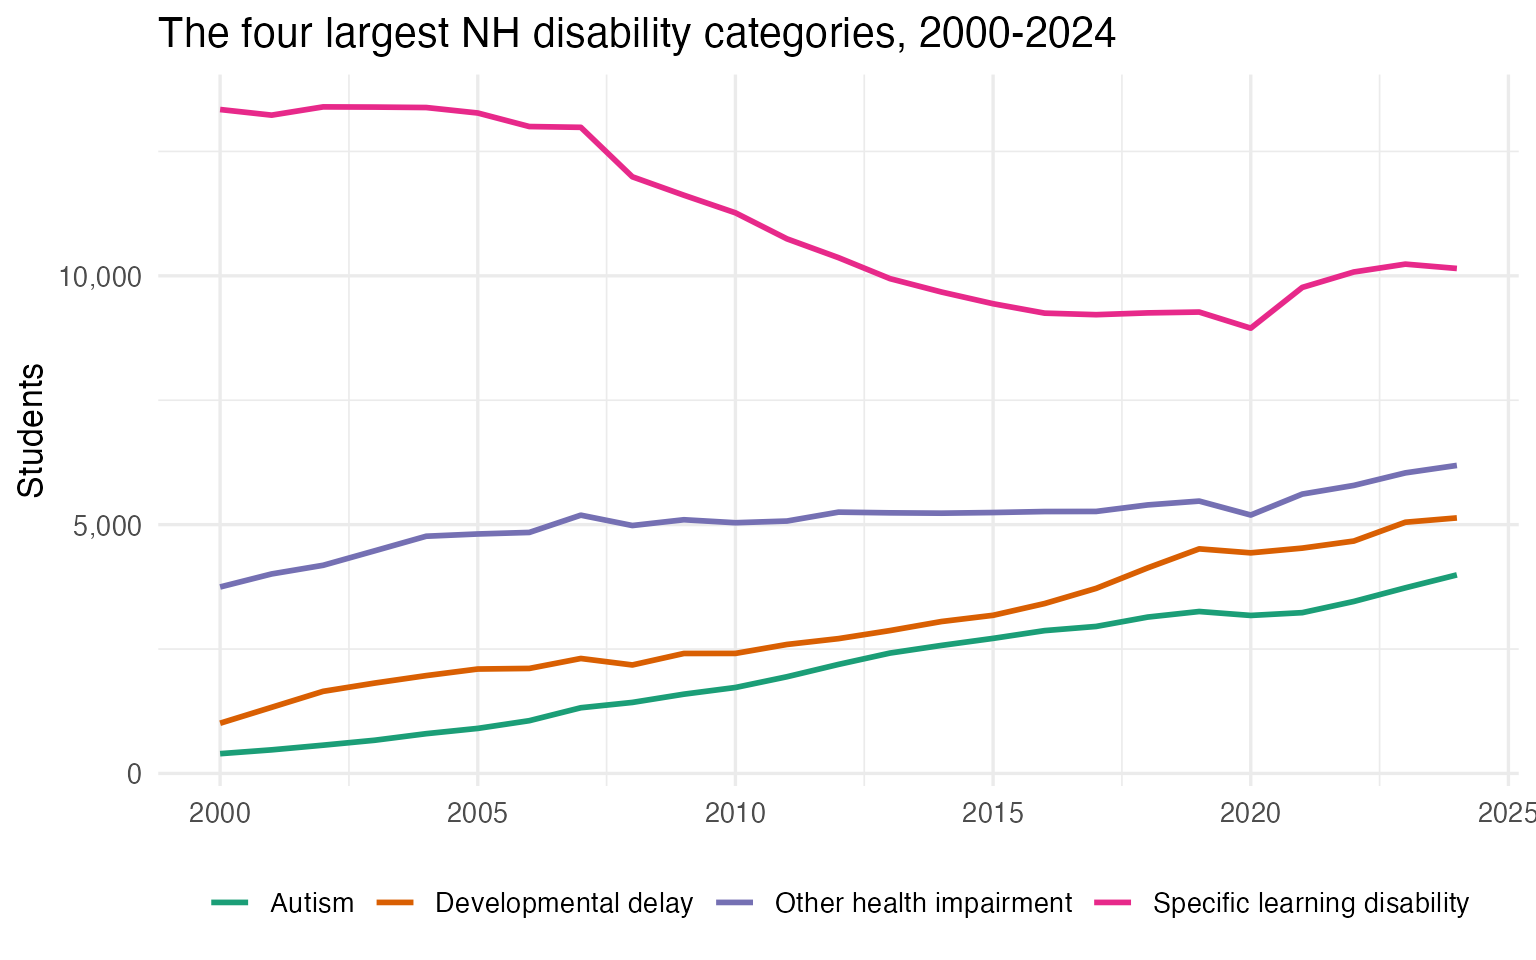
3. Developmental delay has grown fivefold
Developmental delay — a category for younger children — has grown from about 1,000 students in 2000 to over 5,100 in 2024, the steepest sustained rise of any category and now the third-largest group of students with disabilities.
dd <- sped |>
  filter(disability_category == "developmental_delay", subgroup == "total",
         is.na(age_group)) |>
  select(end_year, n_students) |>
  arrange(end_year)

stopifnot(nrow(dd) > 0)
dd |> filter(end_year %in% c(2000, 2012, 2024))
#>   end_year n_students
#> 1     2000       1009
#> 2     2012       2709
#> 3     2024       5135
ggplot(dd, aes(end_year, n_students)) +
  geom_area(fill = "#7570b3", alpha = 0.5) +
  geom_line(color = "#54278f", linewidth = 1) +
  scale_y_continuous(labels = comma) +
  labs(
    title = "New Hampshire developmental-delay child count, 2000-2024",
    x = NULL, y = "Students"
  ) +
  theme_minimal(base_size = 13)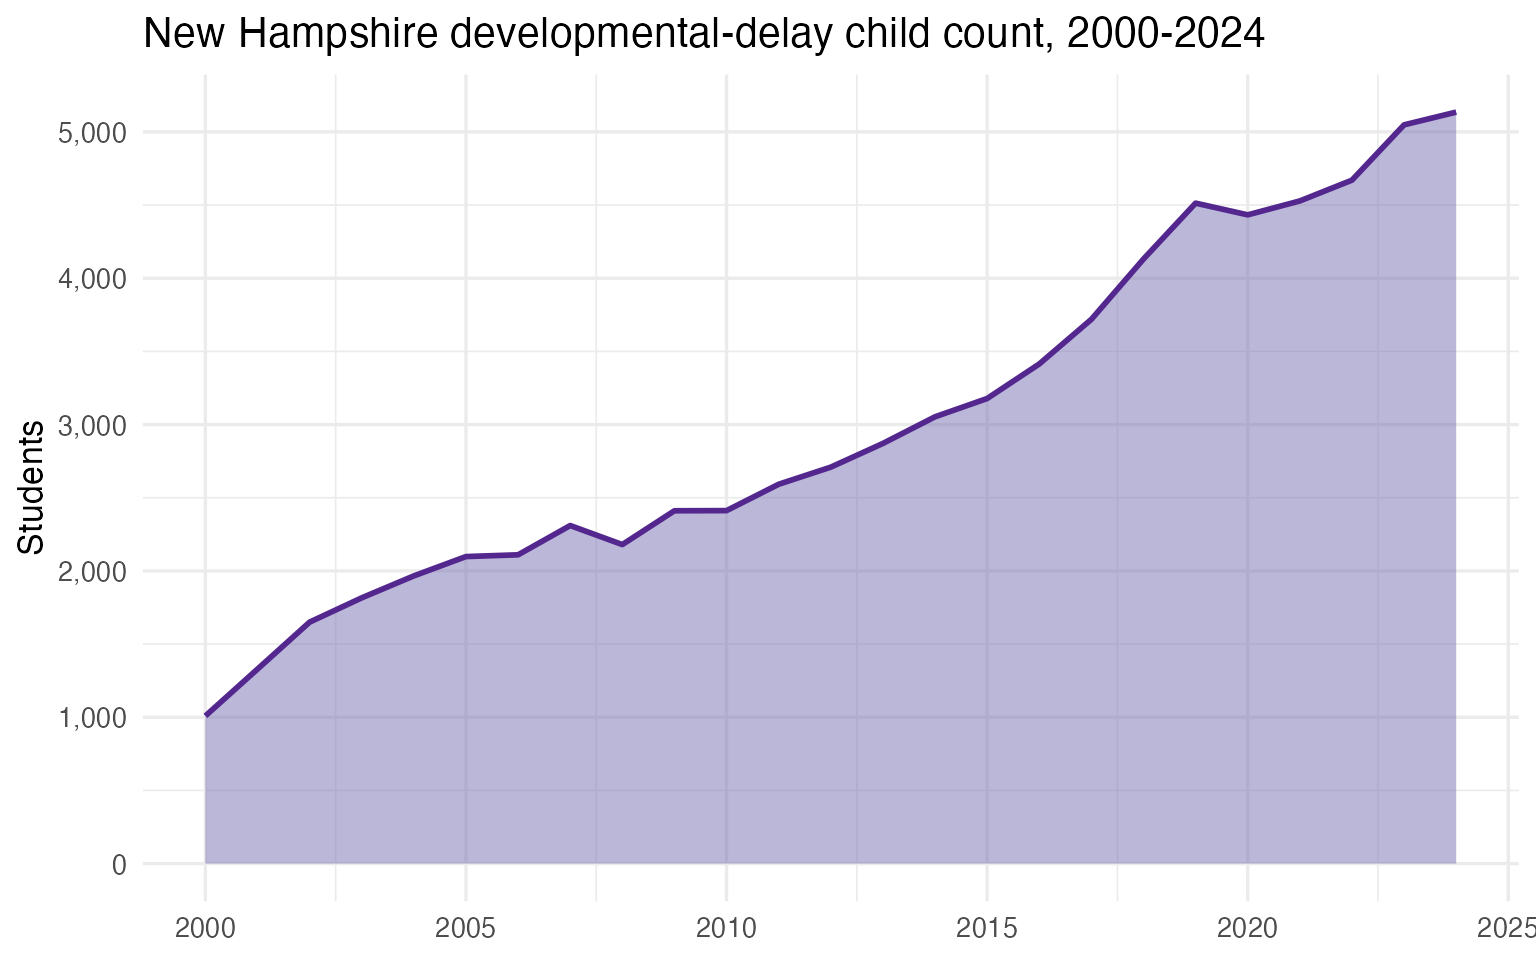
4. What the 2024 census looks like
A single-year snapshot of how New Hampshire’s roughly 32,000 students with disabilities are distributed across the IDEA categories.
snap <- sped |>
  filter(end_year == 2024, subgroup == "total", is.na(age_group),
         disability_category != "all_disabilities", !is.na(n_students)) |>
  arrange(desc(n_students)) |>
  select(disability_category, n_students, pct)

stopifnot(nrow(snap) > 0)
snap
#>             disability_category n_students          pct
#> 1  specific_learning_disability      10148 0.3139462938
#> 2       other_health_impairment       6190 0.1914985769
#> 3           developmental_delay       5135 0.1588602896
#> 4                        autism       3990 0.1234376934
#> 5    speech_language_impairment       3517 0.1088046034
#> 6         emotional_disturbance       1700 0.0525925009
#> 7       intellectual_disability        864 0.0267293652
#> 8         multiple_disabilities        403 0.0124675164
#> 9            hearing_impairment        169 0.0052283133
#> 10            visual_impairment         85 0.0026296250
#> 11       traumatic_brain_injury         79 0.0024440045
#> 12        orthopedic_impairment         35 0.0010827868
#> 13               deaf_blindness          9 0.0002784309
ggplot(snap, aes(reorder(disability_category, n_students), n_students)) +
  geom_col(fill = "#2166ac") +
  coord_flip() +
  scale_y_continuous(labels = comma) +
  labs(
    title = "NH students with disabilities by category, 2024",
    x = NULL, y = "Students"
  ) +
  theme_minimal(base_size = 12)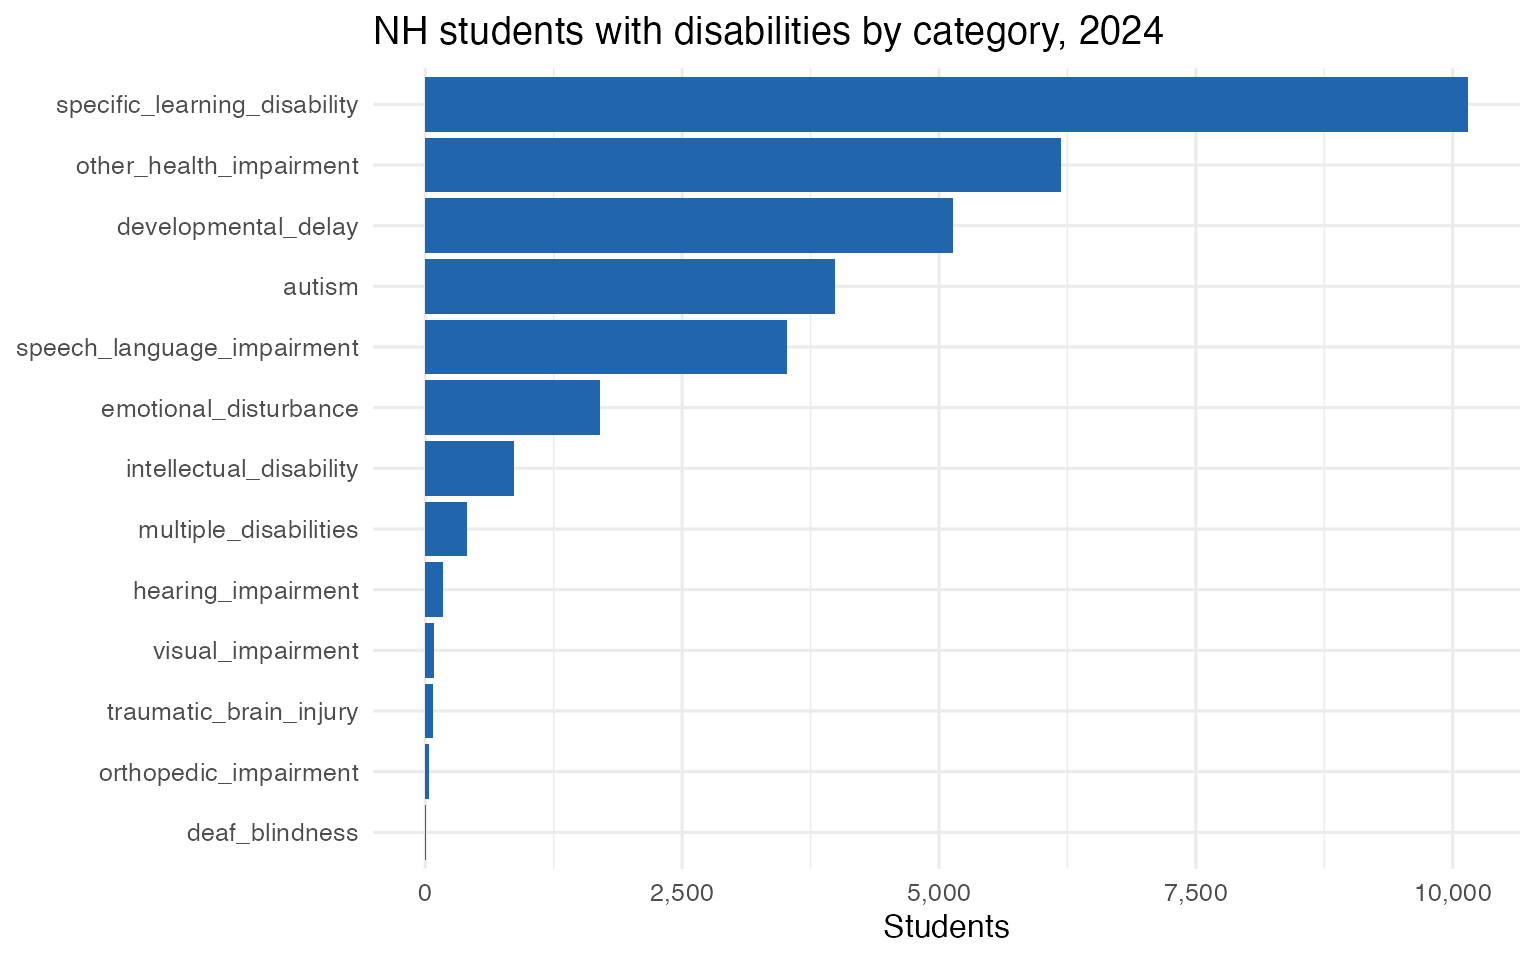
5. Boys outnumber girls roughly two to one
Across every year that NH publishes a gender split, about two-thirds of students with disabilities are male — a ratio that has held remarkably steady.
gender <- sped |>
  filter(subgroup %in% c("male", "female"), disability_category == "all_disabilities") |>
  select(end_year, subgroup, n_students) |>
  arrange(end_year, subgroup)

stopifnot(nrow(gender) > 0)
gender |>
  tidyr::pivot_wider(names_from = subgroup, values_from = n_students) |>
  mutate(pct_male = round(male / (male + female) * 100, 1)) |>
  filter(end_year %in% c(2012, 2017, 2023))
#> # A tibble: 3 × 4
#>   end_year female  male pct_male
#>      <int>  <int> <int>    <dbl>
#> 1     2012   9972 19357     66
#> 2     2017   9948 19223     65.9
#> 3     2023  11474 20545     64.2
ggplot(gender, aes(end_year, n_students, fill = subgroup)) +
  geom_col(position = "stack") +
  scale_y_continuous(labels = comma) +
  scale_fill_manual(values = c(female = "#d6604d", male = "#4393c3"),
                    name = NULL) +
  labs(
    title = "NH students with disabilities by gender",
    x = NULL, y = "Students"
  ) +
  theme_minimal(base_size = 13) +
  theme(legend.position = "bottom")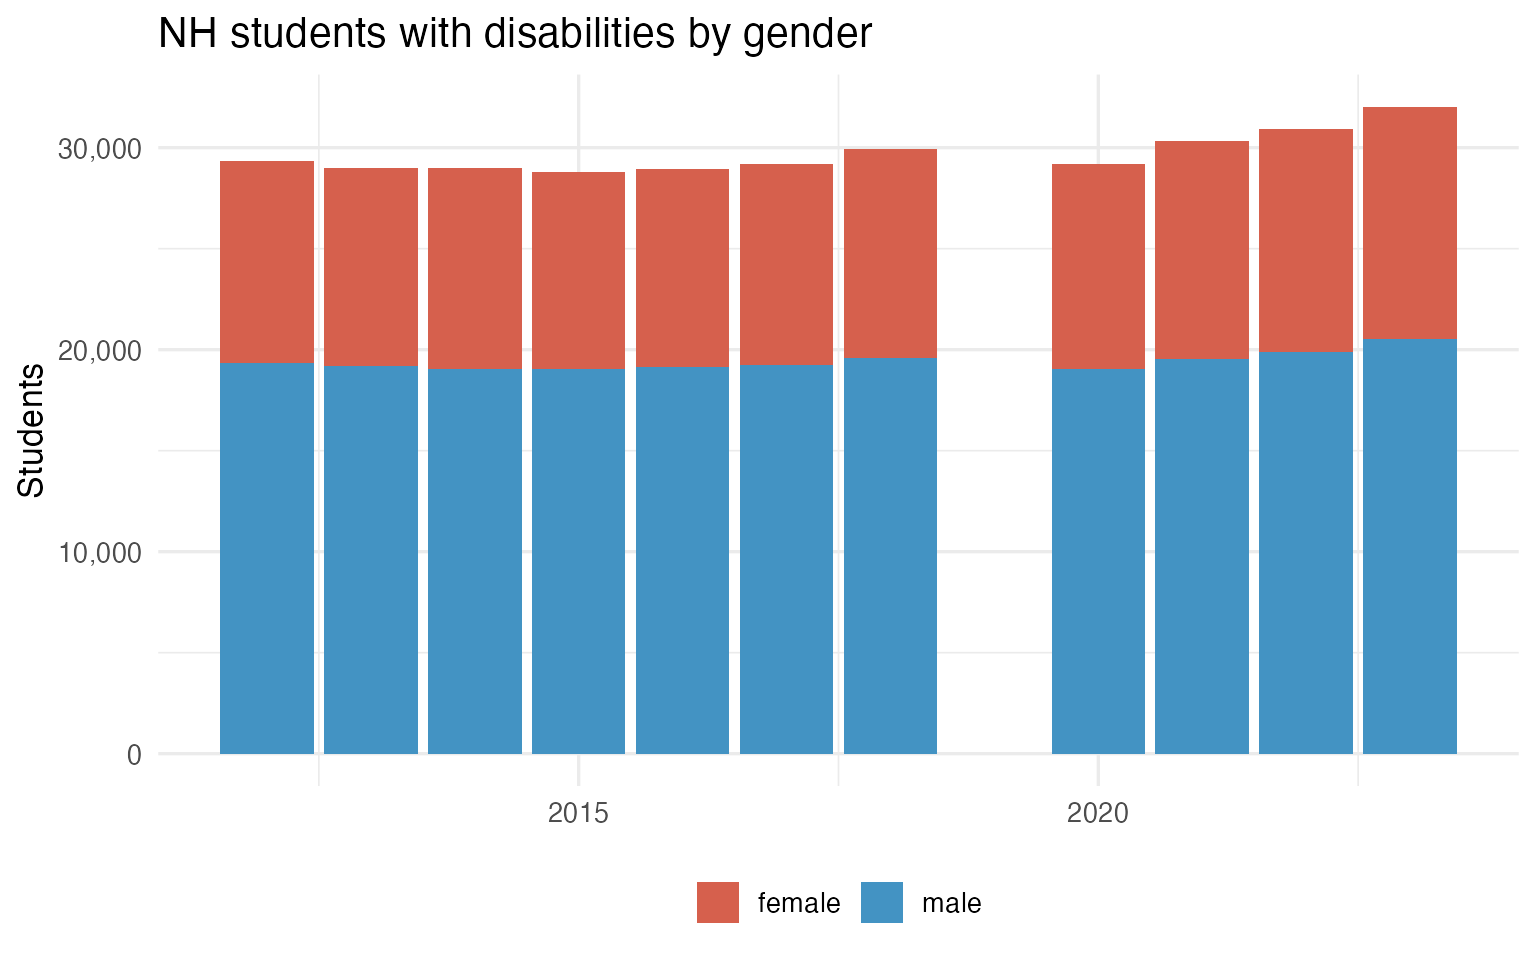
6. Autism is becoming more racially diverse
When NH began publishing disability-by-race detail (2012), autism was overwhelmingly white (94%). By 2023 the Hispanic share had more than tripled and white students were 82% of the autism count — a shift that mirrors the state’s broader demographic change.
aut_race <- sped |>
  filter(disability_category == "autism",
         subgroup %in% c("white", "hispanic", "asian", "black", "multiracial"),
         end_year %in% c(2012, 2023)) |>
  group_by(end_year) |>
  mutate(share = round(n_students / sum(n_students) * 100, 1)) |>
  ungroup() |>
  select(end_year, subgroup, n_students, share) |>
  arrange(end_year, desc(n_students))

stopifnot(nrow(aut_race) > 0)
aut_race
#> # A tibble: 10 × 4
#>    end_year subgroup    n_students share
#>       <int> <chr>            <int> <dbl>
#>  1     2012 white             2041  93.6
#>  2     2012 hispanic            55   2.5
#>  3     2012 asian               37   1.7
#>  4     2012 black               35   1.6
#>  5     2012 multiracial         13   0.6
#>  6     2023 white             3043  81.9
#>  7     2023 hispanic           342   9.2
#>  8     2023 multiracial        125   3.4
#>  9     2023 asian              118   3.2
#> 10     2023 black               89   2.4
ggplot(aut_race, aes(factor(end_year), share, fill = subgroup)) +
  geom_col(position = "stack") +
  scale_fill_brewer(palette = "Set2", name = NULL) +
  labs(
    title = "Race composition of NH students with autism",
    subtitle = "Share of the autism child count, 2012 vs 2023",
    x = NULL, y = "Percent"
  ) +
  theme_minimal(base_size = 13) +
  theme(legend.position = "bottom")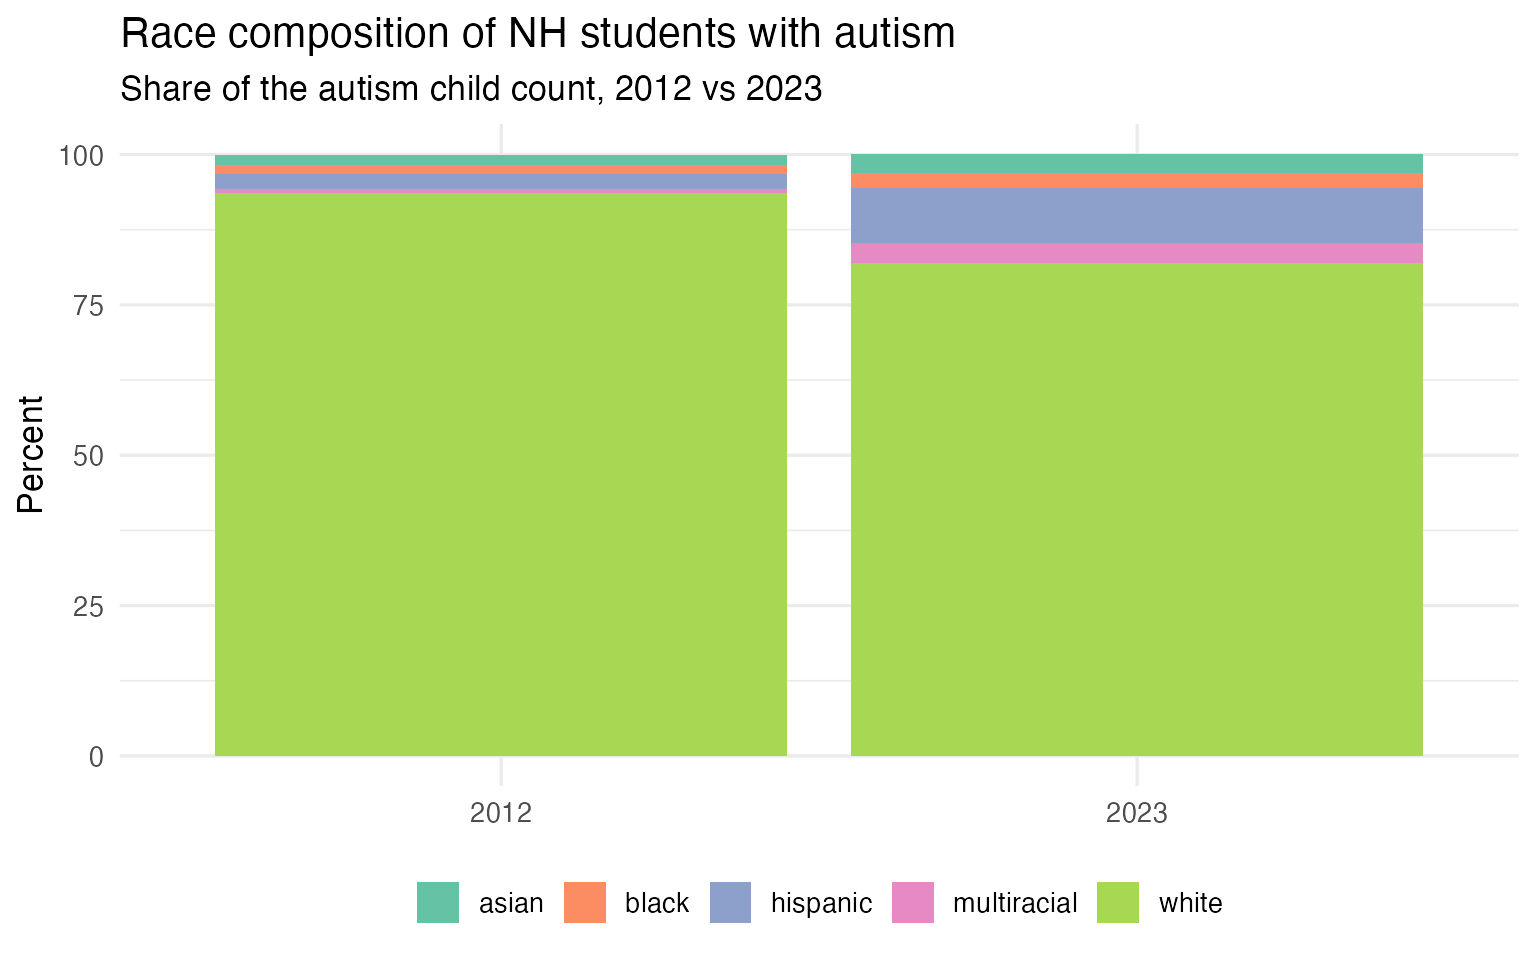
Notes on the data
- Source: NH DOE Bureau of Special Education Support, “Special Education Data” page — the Statewide Census by Disability reports.
- Reporting basis: counts use each student’s primary disability; this is the December-1 federal IDEA child count.
-
Comparability: deafness is folded into
hearing impairment from 2008, so
deafnessisNA(not 0) from 2008 onward. - 2019 detail: NH’s 2019 per-year census PDF is internally inconsistent, so race/gender detail is omitted for 2019; the 2019 disability totals (from the consistent backbone summary) are present.
- Minor revisions: the backbone summary reflects NH’s latest published vintage; a couple of years (e.g., 2017) differ by a few dozen students from the original single-year census.
sessionInfo()
#> R version 4.5.0 (2025-04-11)
#> Platform: aarch64-apple-darwin22.6.0
#> Running under: macOS 26.1
#>
#> Matrix products: default
#> BLAS:   /opt/homebrew/Cellar/openblas/0.3.30/lib/libopenblasp-r0.3.30.dylib
#> LAPACK: /opt/homebrew/Cellar/r/4.5.0/lib/R/lib/libRlapack.dylib;  LAPACK version 3.12.1
#>
#> locale:
#> [1] en_US.UTF-8/en_US.UTF-8/en_US.UTF-8/C/en_US.UTF-8/en_US.UTF-8
#>
#> time zone: America/New_York
#> tzcode source: internal
#>
#> attached base packages:
#> [1] stats     graphics  grDevices utils     datasets  methods   base
#>
#> other attached packages:
#> [1] scales_1.4.0       ggplot2_4.0.1      dplyr_1.2.1        nhschooldata_0.3.4
#>
#> loaded via a namespace (and not attached):
#>  [1] utf8_1.2.6         tidyr_1.3.2        rappdirs_0.3.4     sass_0.4.10
#>  [5] generics_0.1.4     hms_1.1.4          digest_0.6.39      magrittr_2.0.5
#>  [9] evaluate_1.0.5     grid_4.5.0         RColorBrewer_1.1-3 fastmap_1.2.0
#> [13] jsonlite_2.0.0     purrr_1.2.2        codetools_0.2-20   textshaping_1.0.4
#> [17] jquerylib_0.1.4    cli_3.6.6          rlang_1.3.0        crayon_1.5.3
#> [21] bit64_4.8.2        withr_3.0.3        cachem_1.1.0       yaml_2.3.12
#> [25] otel_0.2.0         tools_4.5.0        parallel_4.5.0     tzdb_0.5.0
#> [29] vctrs_0.7.3        R6_2.6.1           lifecycle_1.0.5    fs_2.1.0
#> [33] htmlwidgets_1.6.4  bit_4.6.0          vroom_1.7.1        ragg_1.5.0
#> [37] pkgconfig_2.0.3    desc_1.4.3         pkgdown_2.2.0      pillar_1.11.1
#> [41] bslib_0.9.0        gtable_0.3.6       glue_1.8.1         systemfonts_1.3.1
#> [45] xfun_0.55          tibble_3.3.1       tidyselect_1.2.1   knitr_1.51
#> [49] farver_2.1.2       htmltools_0.5.9    rmarkdown_2.30     labeling_0.4.3
#> [53] readr_2.2.0        compiler_4.5.0     S7_0.2.1