Exploring New Hampshire School Finance Data
Source:vignettes/newhampshire-finance.Rmd
newhampshire-finance.Rmdfetch_finance() returns New Hampshire Bureau of School
Finance data in one tidy frame. Two NH DOE datasets are combined:
-
Cost Per Pupil by District (FY2008-FY2025) — the
per-pupil current operating cost for every school district, broken out
by grade band, plus a published statewide average. Metrics
per_pupil_total,per_pupil_elementary,per_pupil_middle,per_pupil_high(is_per_pupil = TRUE). -
State Summary Revenue & Expenditures
(FY2008-FY2020) — statewide revenue by source and expenditure by
function, in absolute dollars (
is_per_pupil = FALSE).
Years are fiscal-year / school-year ends: FY2025 is the 2024-25 school year. A few ground rules the data respects:
- Every number traces to a downloaded NH DOE CSV. Nothing is modeled, interpolated, or hand-typed.
-
Not-applicable and suppressed cells become
NA, never 0. A district that operates no middle school shows a dash for the Middle column; that becomes a dropped/absent value, not a misleading zero. - Cost per pupil is comparable only within a grade range. NH DOE warns that two districts are comparable only when they serve the same grades; even then use the total figure.
fin <- fetch_finance_multi(2008:2025, use_cache = TRUE)
fin |>
  count(is_per_pupil, is_state, is_district) |>
  arrange(desc(is_per_pupil))
#>   is_per_pupil is_state is_district    n
#> 1         TRUE    FALSE        TRUE 8131
#> 2         TRUE     TRUE       FALSE   72
#> 3        FALSE     TRUE       FALSE  322
1. New Hampshire’s cost per pupil has more than doubled since 2008
The statewide average cost per pupil rose from $11,135 in FY2008 to $22,700 in FY2025 — a 104% increase in nominal dollars over 17 years. (These are nominal, not inflation-adjusted, dollars, straight from the NH DOE Cost Per Pupil reports.)
state_trend <- fin |>
  filter(is_state, metric == "per_pupil_total") |>
  select(end_year, value) |>
  arrange(end_year)

stopifnot(nrow(state_trend) > 0)
print(state_trend)
#>    end_year    value
#> 1      2008 11135.10
#> 2      2009 11745.55
#> 3      2010 12213.99
#> 4      2011 12775.15
#> 5      2012 13159.15
#> 6      2013 13459.39
#> 7      2014 14001.08
#> 8      2015 14374.93
#> 9      2016 14901.93
#> 10     2017 15310.67
#> 11     2018 15865.26
#> 12     2019 16346.45
#> 13     2020 16823.88
#> 14     2021 18434.21
#> 15     2022 19399.97
#> 16     2023 20322.52
#> 17     2024 21542.83
#> 18     2025 22699.85

state_trend |>
  filter(end_year %in% c(2008, 2025)) |>
  mutate(pct_change = round((value / first(value) - 1) * 100, 1))
#>   end_year    value pct_change
#> 1     2008 11135.10        0.0
#> 2     2025 22699.85      103.9
ggplot(state_trend, aes(x = end_year, y = value)) +
  geom_line(color = "#2c7fb8", linewidth = 1.1) +
  geom_point(color = "#2c7fb8", size = 2) +
  scale_y_continuous(labels = scales::dollar) +
  scale_x_continuous(breaks = seq(2008, 2025, 3)) +
  labs(
    title = "NH statewide average cost per pupil, FY2008-FY2025",
    subtitle = "Nominal dollars, NH DOE Bureau of School Finance",
    x = "Fiscal year (school-year end)", y = "Cost per pupil"
  ) +
  theme_minimal()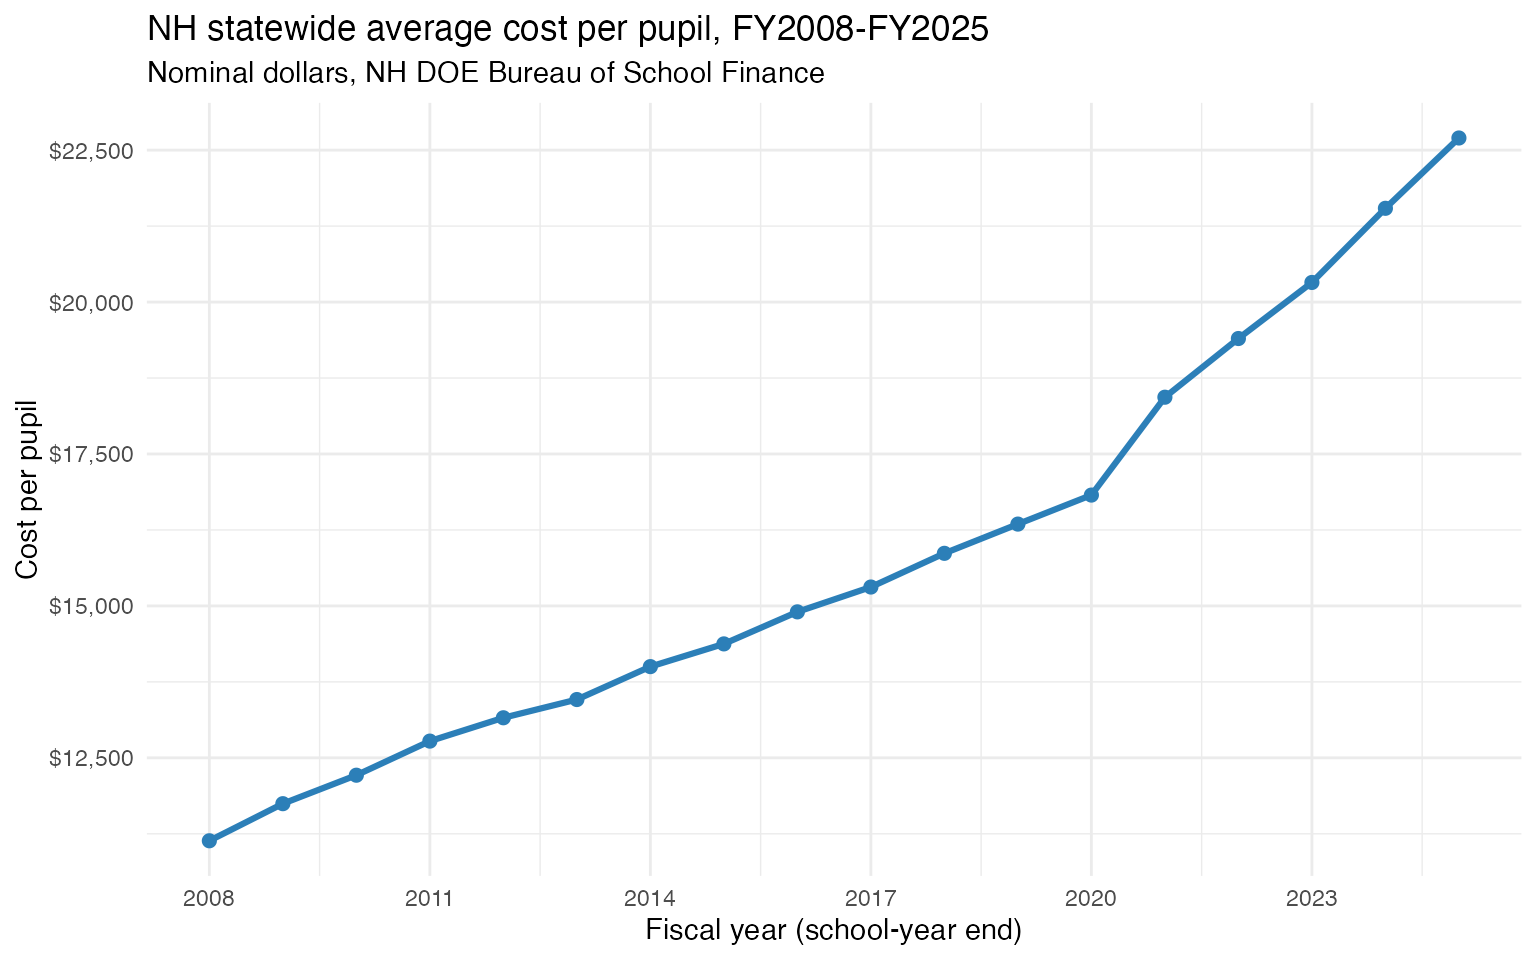
2. The most expensive districts are tiny and rural, not the big cities
Per-pupil spending varies more than three-to-one across NH districts. The highest-spending districts in FY2025 are small rural towns — Jackson, Freedom, Pittsburg, Errol — where a handful of students carry the fixed cost of running a school. The lowest-spending are larger suburban and city districts (Auburn, Goffstown, Manchester, Nashua) that spread costs across many more pupils. This is the diseconomy of small scale, not a quality ranking.
cpp25 <- fin |>
  filter(end_year == 2025, is_district, metric == "per_pupil_total") |>
  select(entity_name, value)

stopifnot(nrow(cpp25) > 0)

cat("districts:", nrow(cpp25),
    "| min:", scales::dollar(min(cpp25$value)),
    "| max:", scales::dollar(max(cpp25$value)),
    "| ratio:", round(max(cpp25$value) / min(cpp25$value), 1), "\n")
#> districts: 162 | min: $14,653.36 | max: $50,323.71 | ratio: 3.4

extremes <- bind_rows(
  cpp25 |> slice_max(value, n = 10) |> mutate(grp = "Highest 10"),
  cpp25 |> slice_min(value, n = 10) |> mutate(grp = "Lowest 10")
)
print(extremes)
#>          entity_name    value        grp
#> 1            Jackson 50323.71 Highest 10
#> 2            Freedom 41267.88 Highest 10
#> 3          Pittsburg 40610.32 Highest 10
#> 4              Errol 40487.22 Highest 10
#> 5          Newington 40353.62 Highest 10
#> 6  Waterville Valley 40150.32 Highest 10
#> 7              Unity 39750.64 Highest 10
#> 8             Monroe 38114.64 Highest 10
#> 9           Tamworth 37750.65 Highest 10
#> 10       Harrisville 36960.67 Highest 10
#> 11            Auburn 14653.36  Lowest 10
#> 12         Goffstown 17811.49  Lowest 10
#> 13          Hooksett 17848.74  Lowest 10
#> 14        Manchester 18020.90  Lowest 10
#> 15            Nashua 18376.45  Lowest 10
#> 16        Nottingham 18527.62  Lowest 10
#> 17       Mont Vernon 18635.77  Lowest 10
#> 18               Bow 18864.23  Lowest 10
#> 19         Rochester 19176.58  Lowest 10
#> 20           Chester 19221.02  Lowest 10
ggplot(extremes, aes(x = reorder(entity_name, value), y = value, fill = grp)) +
  geom_col() +
  coord_flip() +
  scale_y_continuous(labels = scales::dollar) +
  scale_fill_manual(values = c("Highest 10" = "#d95f0e", "Lowest 10" = "#2c7fb8")) +
  labs(
    title = "Highest- and lowest-cost NH districts per pupil, FY2025",
    x = NULL, y = "Cost per pupil", fill = NULL
  ) +
  theme_minimal()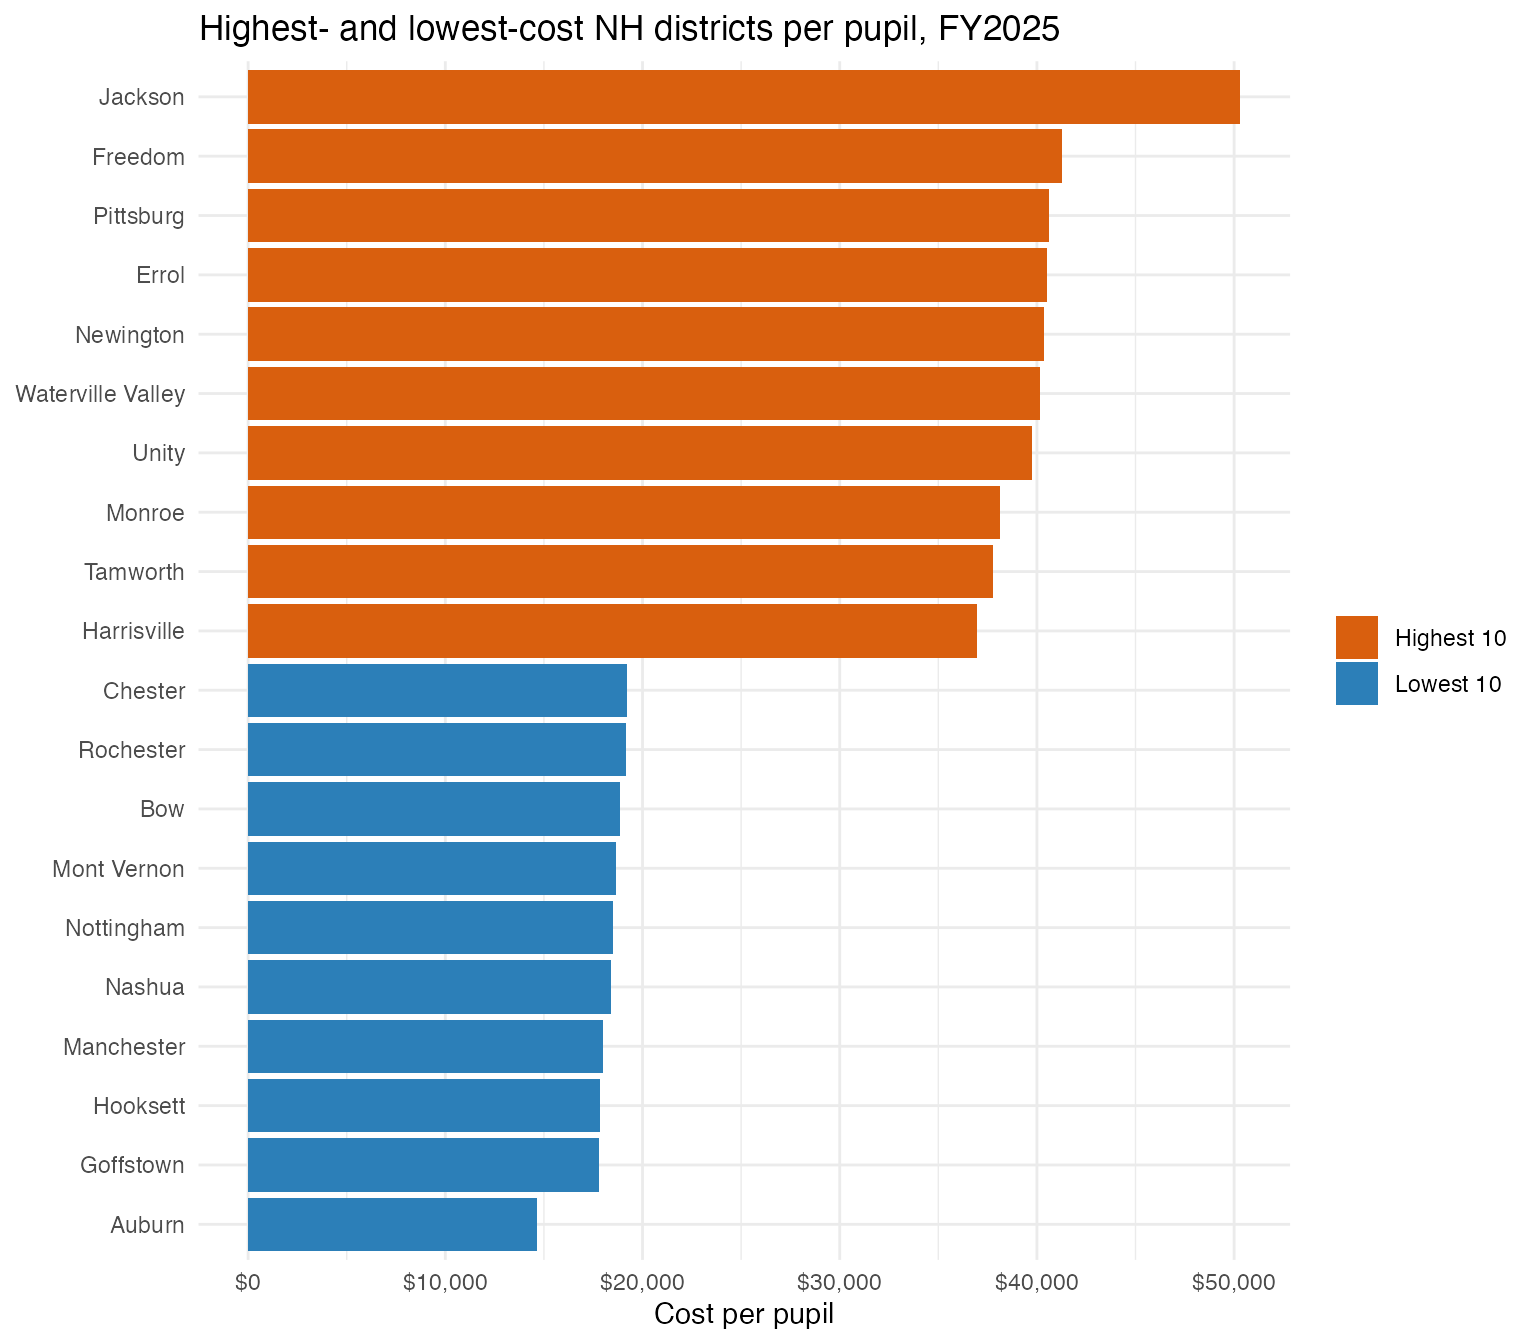
3. New Hampshire schools run on the local property tax
New Hampshire has no broad income or sales tax, and it shows in how schools are funded. In FY2020, local property taxation supplied 62.6% of all school revenue, state equitable education aid 28.7%, and federal sources just 4.8%. The local share has only grown — from 54.1% in FY2008 to 62.6% in FY2020 — while the federal share shrank.
rev_mix <- fin |>
  filter(end_year == 2020, is_state, grepl("^revenue", metric), metric != "revenue_total") |>
  select(metric, value) |>
  arrange(desc(value))

rev_total <- fin |>
  filter(end_year == 2020, is_state, metric == "revenue_total") |>
  pull(value)

stopifnot(nrow(rev_mix) > 0, length(rev_total) == 1)

rev_mix <- rev_mix |>
  mutate(pct = round(value / rev_total * 100, 1))
print(rev_mix)
#>                           metric      value  pct
#> 1     revenue_local_property_tax 2099195588 62.6
#> 2 revenue_state_equitable_ed_aid  961613351 28.7
#> 3                revenue_federal  161745104  4.8
#> 4            revenue_state_other   93473735  2.8
#> 5            revenue_local_other   39279701  1.2
#> 6                  revenue_other     145685  0.0

# local property-tax share over time
fin |>
  filter(is_state, metric %in% c("revenue_local_property_tax", "revenue_total")) |>
  select(end_year, metric, value) |>
  tidyr::pivot_wider(names_from = metric, values_from = value) |>
  mutate(local_pct = round(revenue_local_property_tax / revenue_total * 100, 1)) |>
  filter(end_year %in% c(2008, 2014, 2020)) |>
  select(end_year, local_pct)
#> # A tibble: 3 × 2
#>   end_year local_pct
#>      <int>     <dbl>
#> 1     2008      54.1
#> 2     2014      57.7
#> 3     2020      62.6
ggplot(rev_mix, aes(x = reorder(metric, value), y = value)) +
  geom_col(fill = "#41b6c4") +
  coord_flip() +
  scale_y_continuous(labels = scales::label_dollar(scale = 1e-9, suffix = "B")) +
  labs(
    title = "NH school revenue by source, FY2020",
    subtitle = "Local property tax dwarfs every other source",
    x = NULL, y = "Revenue"
  ) +
  theme_minimal()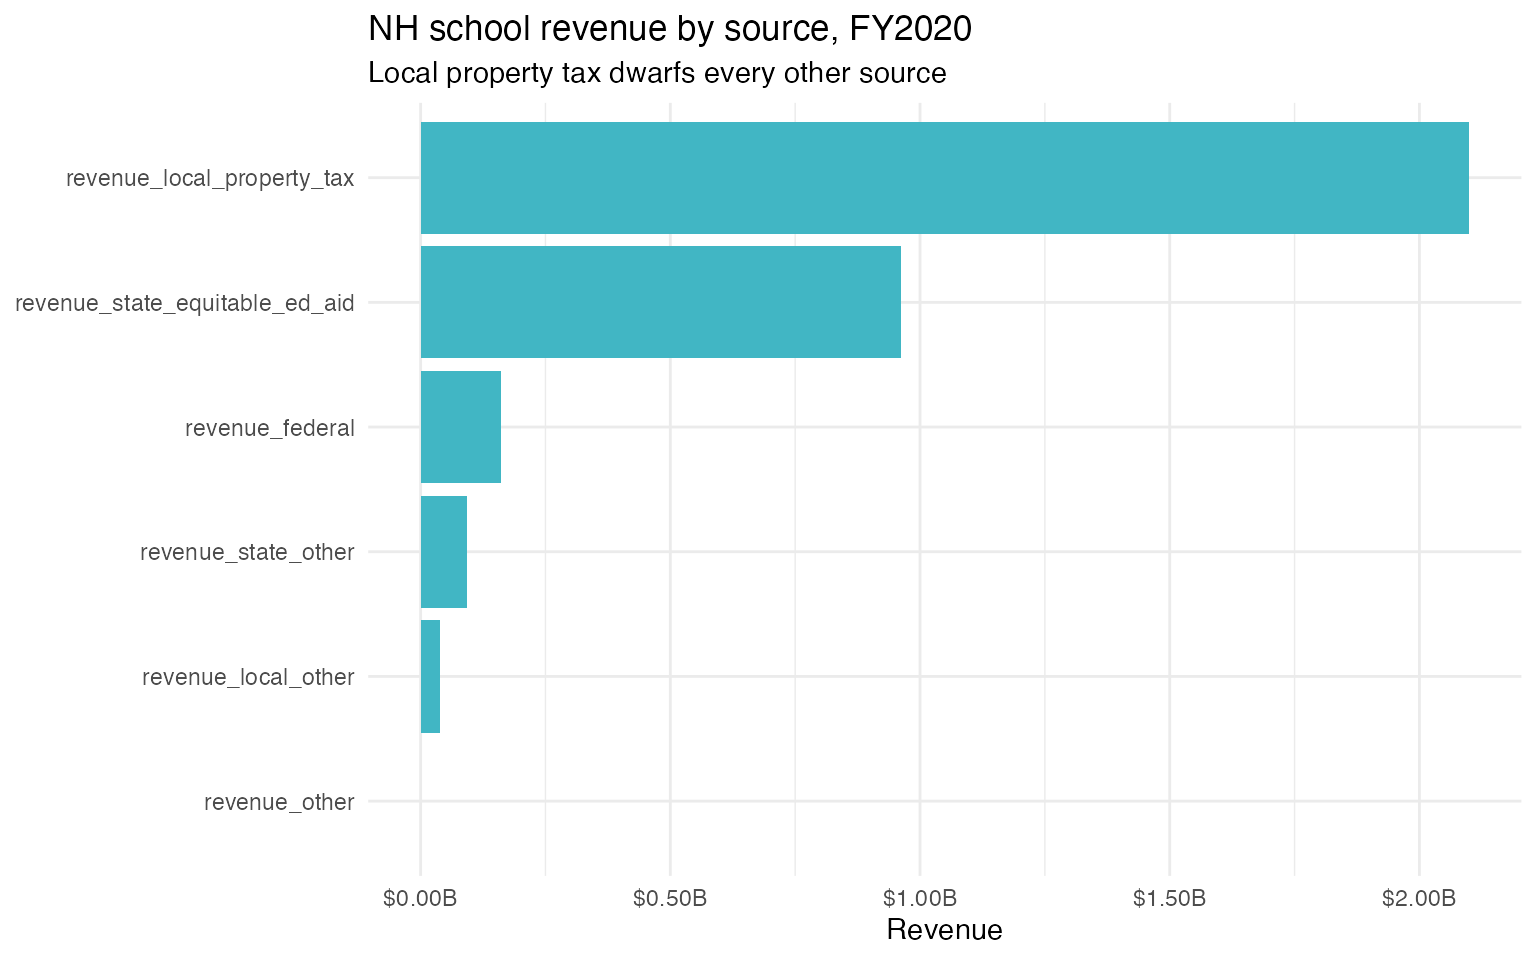
4. Where the money goes: instruction is the largest slice
On the expenditure side, regular instruction is the single biggest function (about 40% of recurring spending in FY2020), but special programs, support services, administration, transportation, and facilities together account for the majority. The State Summary file reports each function as an absolute dollar total.
exp_mix <- fin |>
  filter(end_year == 2020, is_state, grepl("^expenditure", metric),
         !metric %in% c("expenditure_total", "expenditure_recurring_total")) |>
  select(metric, value) |>
  arrange(desc(value))

stopifnot(nrow(exp_mix) > 0)
print(exp_mix)
#>                                     metric      value
#> 1                  expenditure_instruction 1267298441
#> 2             expenditure_special_programs  627421803
#> 3       expenditure_operations_maintenance  253144014
#> 4             expenditure_support_services  249685289
#> 5        expenditure_school_administration  176854587
#> 6               expenditure_administration  138525640
#> 7               expenditure_transportation  130542355
#> 8  expenditure_instructional_staff_support  110077517
#> 9            expenditure_other_instruction   47019857
#> 10               expenditure_debt_interest   42715307
#> 11                  expenditure_vocational   40801036
#> 12                expenditure_food_service   39775739
#> 13           expenditure_business_services   21645805
#> 14          expenditure_community_programs    5655509
#> 15      expenditure_charter_other_agencies    2249701
#> 16         expenditure_non_public_programs     249132
exp_mix |>
  slice_max(value, n = 10) |>
  ggplot(aes(x = reorder(metric, value), y = value)) +
  geom_col(fill = "#7fcdbb") +
  coord_flip() +
  scale_y_continuous(labels = scales::label_dollar(scale = 1e-6, suffix = "M")) +
  labs(
    title = "NH school expenditure by function (top 10), FY2020",
    x = NULL, y = "Expenditure"
  ) +
  theme_minimal()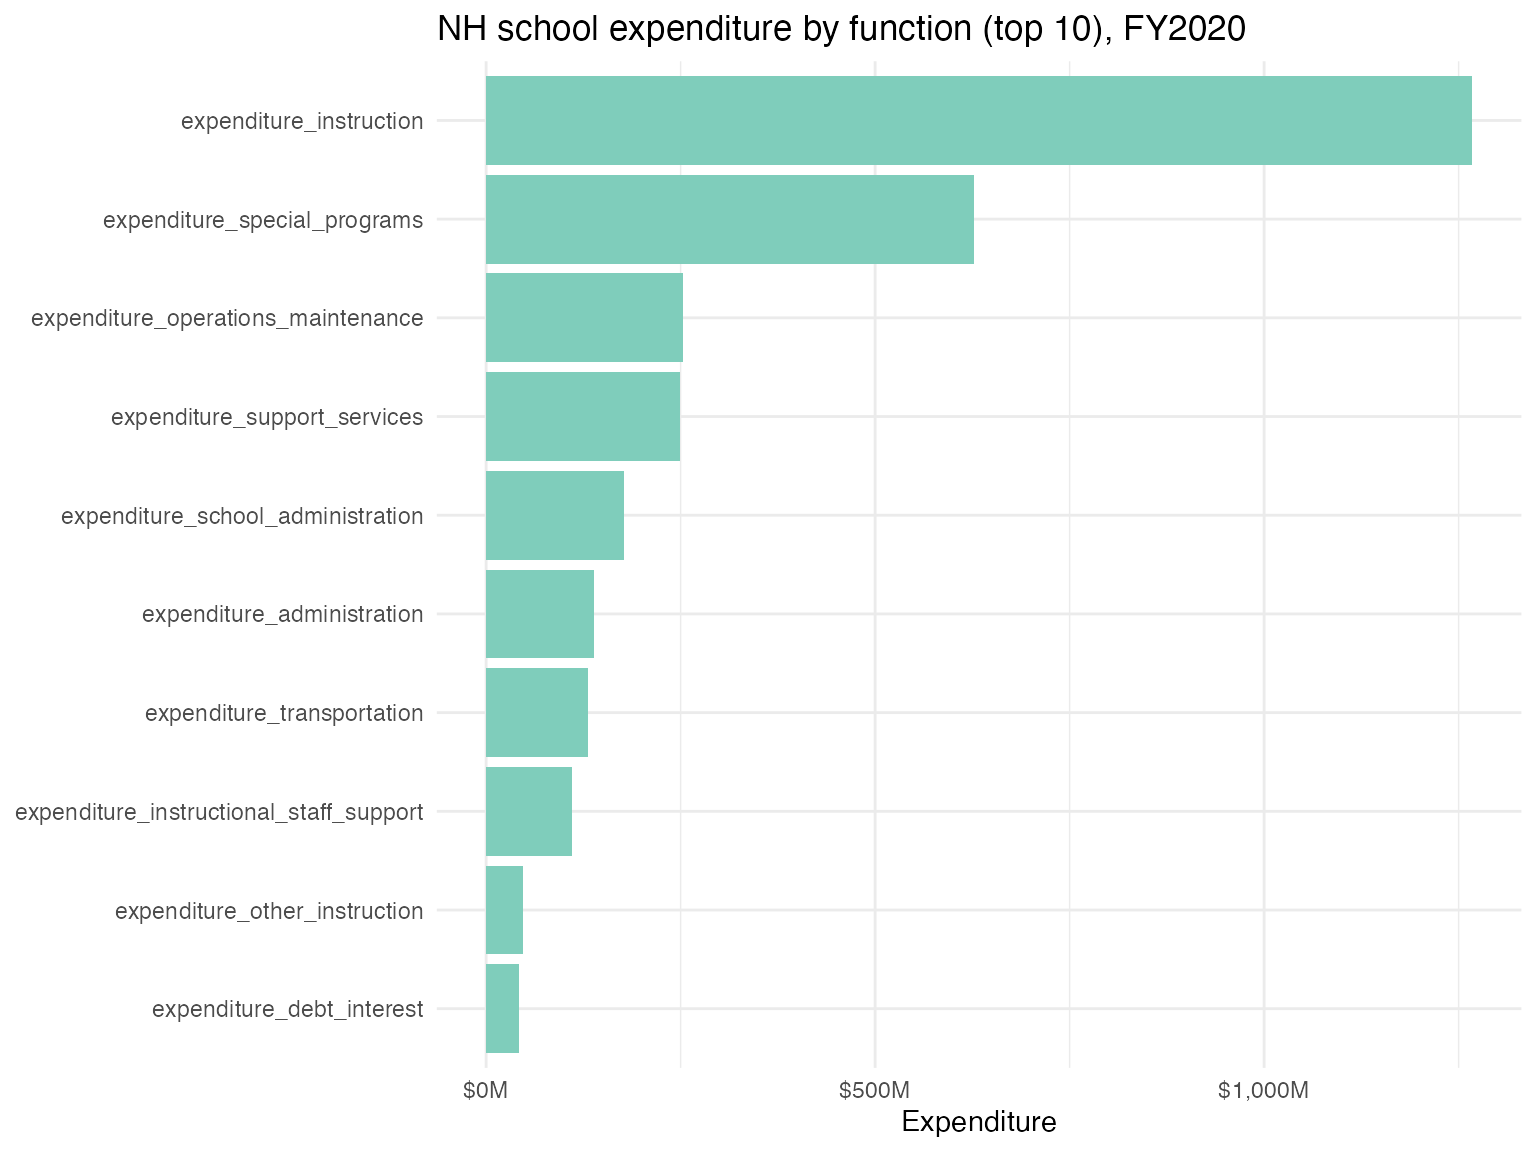
Notes on the data
- Source: NH DOE Bureau of School Finance, “Financial Reports” page, harvested via headed browser (the NH DOE Akamai WAF blocks headless HTTP) and bundled with the package.
-
FY ↔︎ SY:
end_yearis the fiscal-year / school-year end. FY2025 = the 2024-25 school year (the “Cost Per Pupil by District, 2024-2025” report). -
NCES ids: district rows carry the federal
nces_dist(LEAID) via the bundled CCD crosswalk — join keys only, never a data value. State rows and unmatched districts stayNA. - Coverage: cost per pupil FY2008-FY2025; statewide revenue/expenditure FY2008-FY2020.
sessionInfo()
#> R version 4.5.0 (2025-04-11)
#> Platform: aarch64-apple-darwin22.6.0
#> Running under: macOS 26.1
#>
#> Matrix products: default
#> BLAS:   /opt/homebrew/Cellar/openblas/0.3.30/lib/libopenblasp-r0.3.30.dylib
#> LAPACK: /opt/homebrew/Cellar/r/4.5.0/lib/R/lib/libRlapack.dylib;  LAPACK version 3.12.1
#>
#> locale:
#> [1] en_US.UTF-8/en_US.UTF-8/en_US.UTF-8/C/en_US.UTF-8/en_US.UTF-8
#>
#> time zone: America/New_York
#> tzcode source: internal
#>
#> attached base packages:
#> [1] stats     graphics  grDevices utils     datasets  methods   base
#>
#> other attached packages:
#> [1] scales_1.4.0       ggplot2_4.0.1      dplyr_1.2.1        nhschooldata_0.3.4
#>
#> loaded via a namespace (and not attached):
#>  [1] gtable_0.3.6       jsonlite_2.0.0     compiler_4.5.0     tidyselect_1.2.1
#>  [5] tidyr_1.3.2        jquerylib_0.1.4    systemfonts_1.3.1  textshaping_1.0.4
#>  [9] yaml_2.3.12        fastmap_1.2.0      R6_2.6.1           labeling_0.4.3
#> [13] generics_0.1.4     knitr_1.51         htmlwidgets_1.6.4  tibble_3.3.1
#> [17] desc_1.4.3         bslib_0.9.0        pillar_1.11.1      RColorBrewer_1.1-3
#> [21] rlang_1.3.0        cachem_1.1.0       xfun_0.55          S7_0.2.1
#> [25] fs_2.1.0           sass_0.4.10        otel_0.2.0         cli_3.6.6
#> [29] withr_3.0.3        pkgdown_2.2.0      magrittr_2.0.5     digest_0.6.39
#> [33] grid_4.5.0         lifecycle_1.0.5    vctrs_0.7.3        evaluate_1.0.5
#> [37] glue_1.8.1         farver_2.1.2       ragg_1.5.0         purrr_1.2.2
#> [41] rmarkdown_2.30     tools_4.5.0        pkgconfig_2.0.3    htmltools_0.5.9