Fetch and analyze New Mexico school enrollment data from the New Mexico Public Education Department (PED) in R or Python. Part of the njschooldata family.
Full documentation — all 15 stories with interactive charts, getting-started guide, and complete function reference.
Highlights
library(nmschooldata)
library(dplyr)
library(tidyr)
library(ggplot2)

theme_set(theme_minimal(base_size = 14))

all_years <- fetch_enr_multi(2016:2025, use_cache = TRUE)
enr_2025 <- fetch_enr(2025, use_cache = TRUE)
1. 72% of NM students were economically disadvantaged – until 2025
New Mexico’s economically disadvantaged rate hovered around 72-78% from 2019-2023, then plummeted to 37.1% in 2025. The dramatic drop likely reflects a change in how NM PED measures economic disadvantage, not an actual improvement in child poverty.
ed_trend <- all_years |>
  filter(is_state, subgroup == "econ_disadv", grade_level == "TOTAL") |>
  mutate(pct = round(pct * 100, 1)) |>
  select(end_year, n_students, pct)

stopifnot(nrow(ed_trend) > 0)
ed_trend
#> end_year n_students pct
#> 1 2019 242160 72.3
#> 2 2020 242159 72.8
#> 3 2021 236008 74.1
#> 4 2022 238033 74.8
#> 5 2023 245845 77.7
#> 6 2025 113772 37.1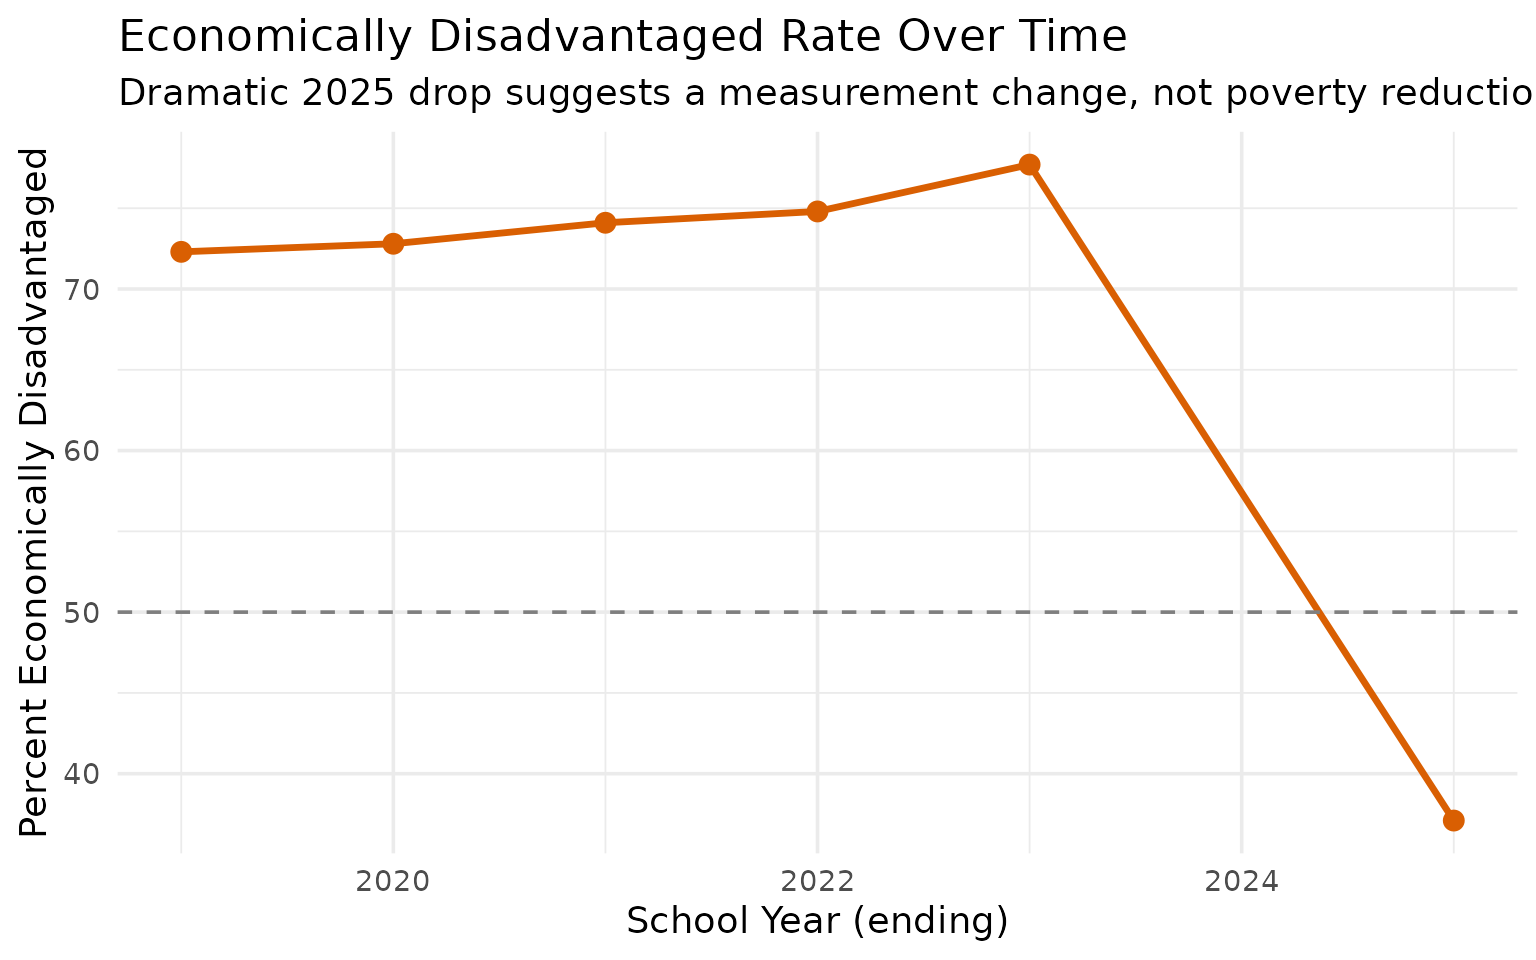
2. COVID wiped out 14,000 students in a single year
The 2021 school year (2020-21) saw a staggering 4.3% enrollment drop – 14,323 students vanished from NM classrooms. Enrollment has never recovered.
covid_era <- all_years |>
  filter(is_state, subgroup == "total_enrollment", grade_level == "TOTAL",
         end_year %in% c(2019, 2020, 2021, 2022, 2023)) |>
  select(end_year, n_students) |>
  mutate(change = n_students - lag(n_students),
         pct_change = round(change / lag(n_students) * 100, 2))

stopifnot(nrow(covid_era) > 0)
covid_era
#> end_year n_students change pct_change
#> 1 2019 335131 NA NA
#> 2 2020 332672 -2459 -0.73
#> 3 2021 318349 -14323 -4.31
#> 4 2022 318353 4 0.00
#> 5 2023 316478 -1875 -0.59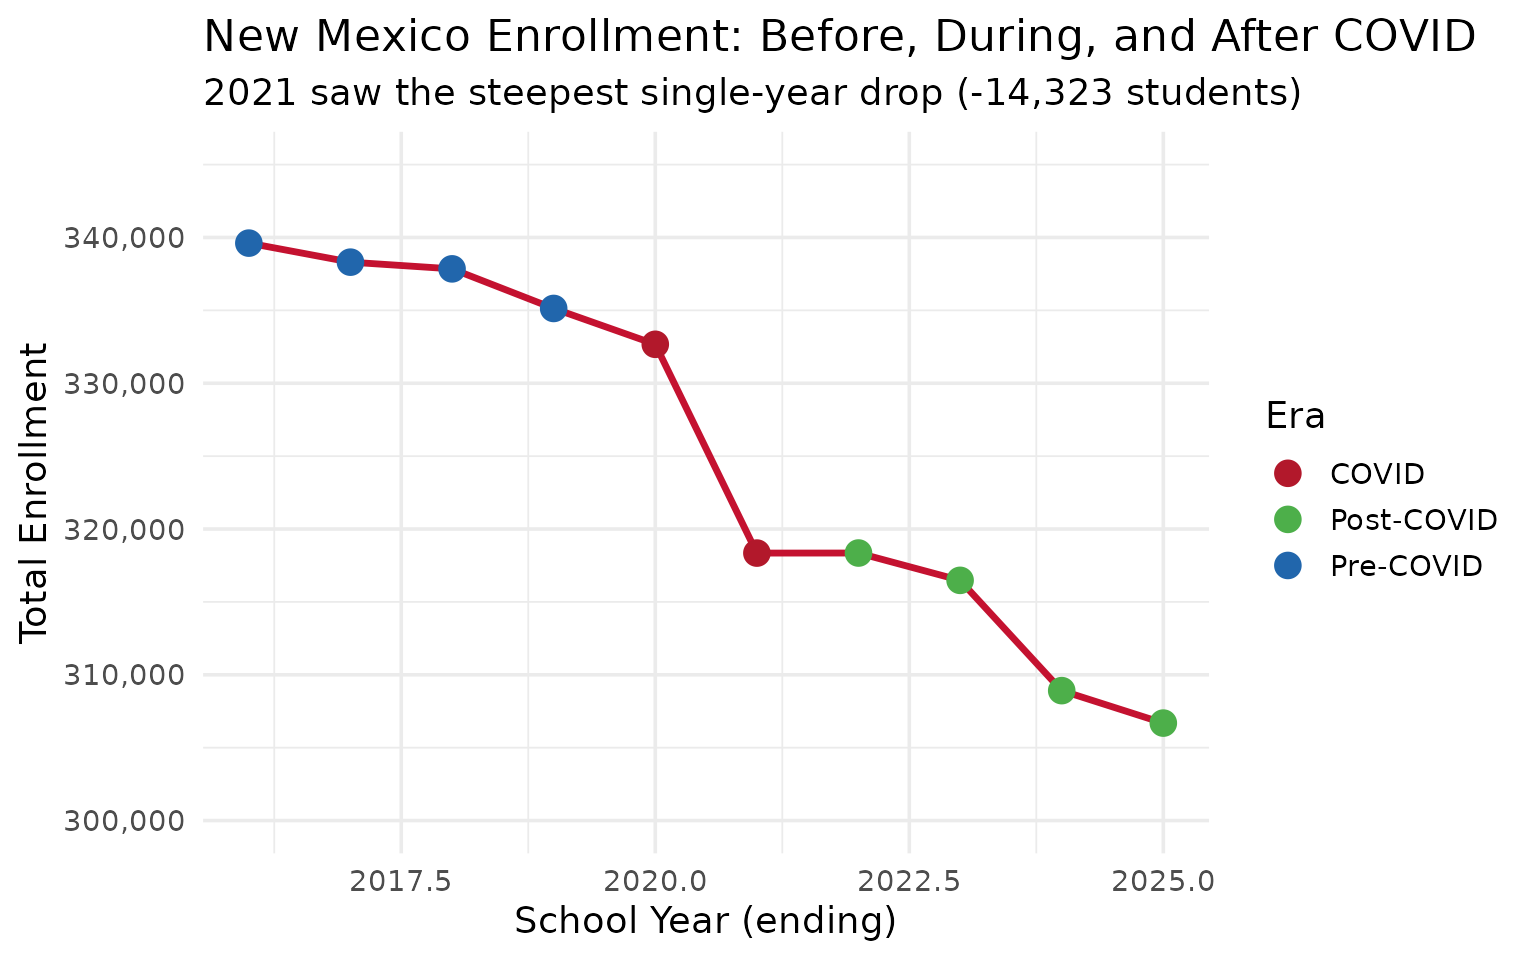
3. Albuquerque lost 17,000 students while Gallup grew 11%
Not all districts are declining. Gallup gained 1,289 students (+11.3%) from 2019 to 2025, while Albuquerque hemorrhaged over 15,000. The divergence reveals a stark urban-rural-tribal split.
enr_2019 <- fetch_enr(2019, use_cache = TRUE)

d_2019 <- enr_2019 |>
  filter(is_school, subgroup == "total_enrollment", grade_level == "TOTAL") |>
  group_by(district_name) |>
  summarize(n_2019 = sum(n_students))

d_2025 <- enr_2025 |>
  filter(is_district, subgroup == "total_enrollment", grade_level == "TOTAL") |>
  select(district_name, n_2025 = n_students)

growth <- inner_join(d_2019, d_2025, by = "district_name") |>
  mutate(change = n_2025 - n_2019,
         pct_change = round((n_2025 / n_2019 - 1) * 100, 1)) |>
  filter(n_2019 >= 1000) |>
  arrange(pct_change)

stopifnot(nrow(growth) > 0)
growth |> select(district_name, n_2019, n_2025, pct_change)
#> # A tibble: 35 x 4
#> district_name n_2019 n_2025 pct_change
#> <chr> <dbl> <dbl> <dbl>
#> 1 LAS VEGAS CITY 1512 1121 -25.9
#> 2 ESPANOLA 3555 2664 -25.1
#> 3 POJOAQUE 1965 1506 -23.4
#> 4 ZUNI 1343 1052 -21.7
#> 5 TAOS 2741 2184 -20.3
#> 6 SOCORRO 1654 1329 -19.6
#> 7 AZTEC 3002 2449 -18.4
#> 8 ALAMOGORDO 6396 5229 -18.2
#> 9 ALBUQUERQUE 90240 75040 -16.8
#> 10 SANTA FE 13270 11226 -15.4
#> # ... 25 more rows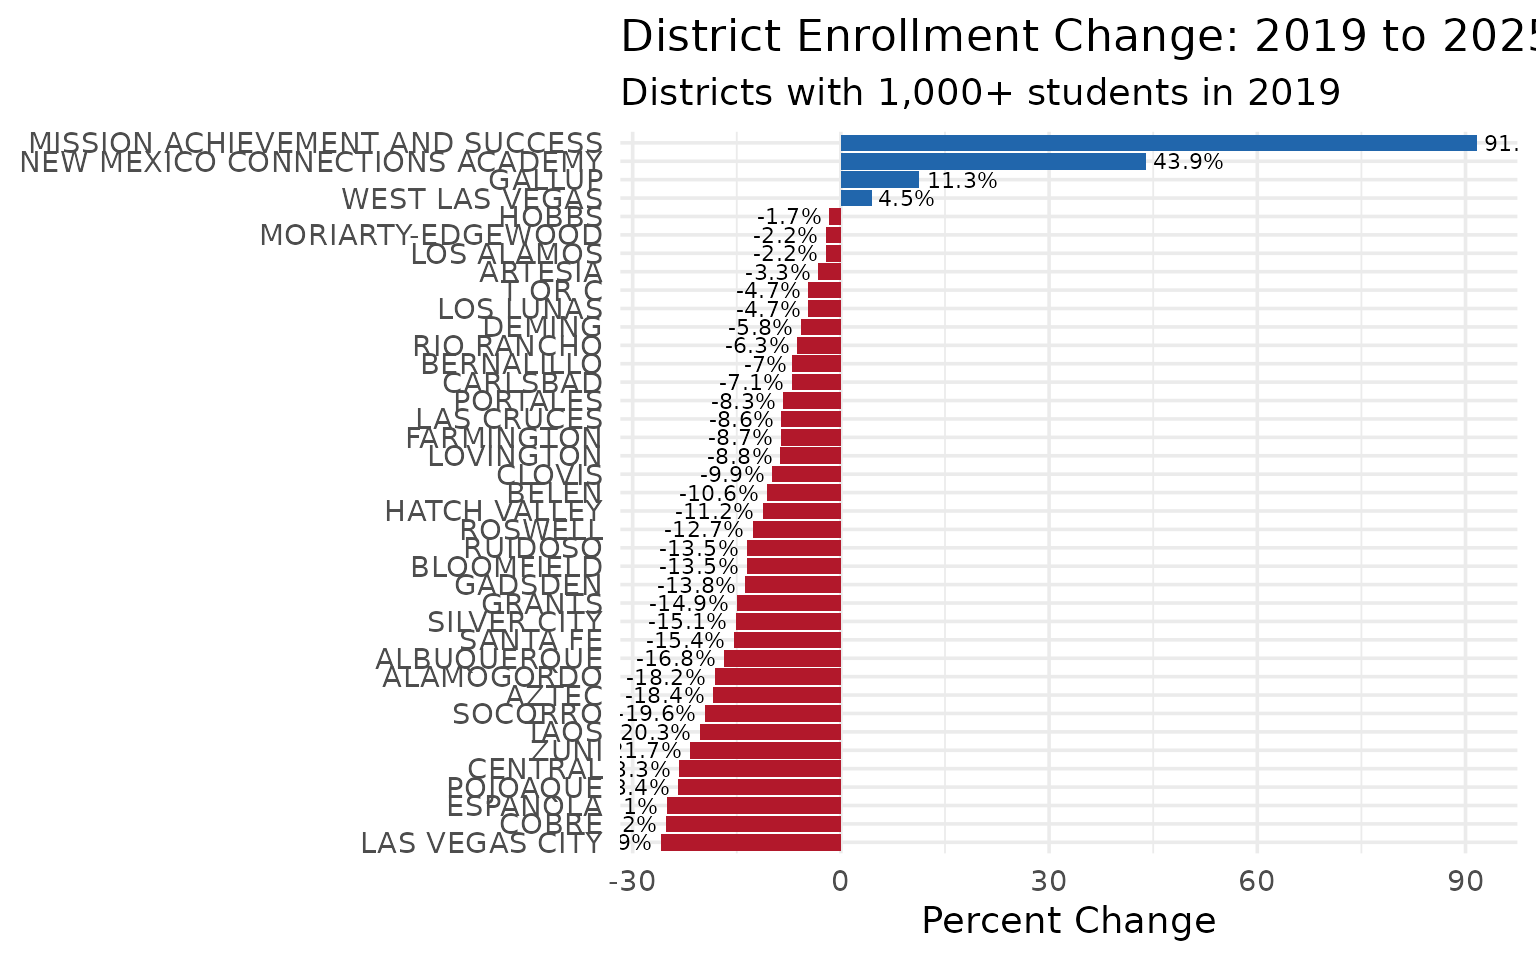
Data Taxonomy
| Category | Years | Function | Details |
|---|---|---|---|
| Enrollment | 2016-2025 |
fetch_enr() / fetch_enr_multi()
|
State, district, school. Race, gender, FRPL, SpEd, LEP |
| Assessments | — | — | Not yet available |
| Graduation | — | — | Not yet available |
| Directory | current | fetch_directory() |
School names, addresses, principals, superintendents |
| Per-Pupil Spending | — | — | Not yet available |
| Accountability | — | — | Not yet available |
| Chronic Absence | — | — | Not yet available |
| EL Progress | — | — | Not yet available |
| Special Ed | — | — | Not yet available |
See DATA-CATEGORY-TAXONOMY.md for what each category covers.
Quick Start
R
# install.packages("remotes")
remotes::install_github("almartin82/state-schooldata", subdir = "nmschooldata")
library(nmschooldata)
library(dplyr)

# Fetch one year
enr_2025 <- fetch_enr(2025)

# Fetch multiple years
enr_multi <- fetch_enr_multi(2019:2025)

# State totals
enr_2025 %>%
  filter(is_state, subgroup == "total_enrollment", grade_level == "TOTAL")

# District breakdown
enr_2025 %>%
  filter(is_district, subgroup == "total_enrollment", grade_level == "TOTAL") %>%
  arrange(desc(n_students))

# Demographics statewide
enr_2025 %>%
  filter(is_state, grade_level == "TOTAL",
         subgroup %in% c("hispanic", "white", "native_american", "black", "asian")) %>%
  select(subgroup, n_students, pct)
Python
import pynmschooldata as nm

# Check available years
years = nm.get_available_years()
print(f"Data available: {years['min_year']}-{years['max_year']}")

# Fetch one year
enr_2025 = nm.fetch_enr(2025)

# Fetch multiple years
enr_multi = nm.fetch_enr_multi([2019, 2020, 2021, 2022, 2023, 2025])

# State totals
state_total = enr_2025[
    (enr_2025['is_state'] == True) &
    (enr_2025['subgroup'] == 'total_enrollment') &
    (enr_2025['grade_level'] == 'TOTAL')
]

# District breakdown
districts = enr_2025[
    (enr_2025['is_district'] == True) &
    (enr_2025['subgroup'] == 'total_enrollment') &
    (enr_2025['grade_level'] == 'TOTAL')
].sort_values('n_students', ascending=False)
Explore More
- Full documentation — 15 stories with interactive charts
- Enrollment vignette — 15 stories
- Function reference
Data Notes
Data source
New Mexico Public Education Department: - PED Main - STARS System - NM Vistas
Data availability
| Years | Source | Aggregation Levels | Demographics | Grade Breakdown |
|---|---|---|---|---|
| 2025 | 40-Day subgroup | State, District, School | 13 subgroups | TOTAL only |
| 2024 | 80-Day only | State, District | None | PK through 12 |
| 2019-2023 | 40-Day subgroup | State, School | 13 subgroups | TOTAL only |
| 2016-2018 | 40-Day enrollment | State, District, School | None | PK through 12 |
What’s available by year range
- Demographics: 13 subgroups (race/ethnicity, gender, special populations) available for 2019-2023 and 2025. No demographics for 2016-2018 or 2024.
- Grade Breakdown: Individual grade counts (PK-12) available for 2016-2018 and 2024. Only TOTAL for 2019-2023 and 2025.
- 40-Day vs 80-Day: New Mexico reports enrollment at 40-day and 80-day counts. This package uses 40-day data when available (the standard snapshot used for funding). Note: 2024 only has 80-Day data – the 40-Day subgroup file was never published by NM PED.
-
Suppression: NM PED suppresses counts below certain thresholds with
*markers, converted toNAby this package. -
pct column: The
pctcolumn in tidy output is on a 0-1 scale (not 0-100). Multiply by 100 for display percentages.
Data quality caveats
- Multiracial reclassification (2025): Multiracial went from 0 to 7,221 in 2025 – a reporting/classification change, not real population growth. This inflates apparent declines in other race/ethnicity groups (Hispanic -6%, White -22%, Black -22% are partly reclassification effects). Any 2019-2025 demographic comparison must account for this.
- Econ_disadv methodology change: The economically disadvantaged rate dropped from 77.7% (2023) to 37.1% (2025), almost certainly a definition change (likely CEP/direct certification transition). Do not compare econ_disadv rates across this break.
-
District name changes (2023-2024): Several districts were renamed (CENTRAL CONS. to CENTRAL, HATCH to HATCH VALLEY, FT SUMNER to FORT SUMNER, etc.). Use
district_idfor longitudinal tracking. -
Charter identification: The
is_charterflag is derived from NM PED’s official school directory (bundled with the package), not name-pattern matching. Covers 98 charter schools (58 state-chartered, 42 locally-authorized) at 10.8% of enrollment.
Deeper Dive
4. New Mexico lost 33,000 students in a decade
From 2016 to 2025, statewide enrollment fell from 340,000 to 307,000 – a 9.7% decline that accelerated dramatically during the pandemic year of 2021.
state_totals <- all_years |>
  filter(is_state, subgroup == "total_enrollment", grade_level == "TOTAL") |>
  select(end_year, n_students) |>
  mutate(change = n_students - lag(n_students),
         pct_change = round(change / lag(n_students) * 100, 2))

stopifnot(nrow(state_totals) > 0)
state_totals
#> end_year n_students change pct_change
#> 1 2016 339613 NA NA
#> 2 2017 338307 -1306 -0.38
#> 3 2018 337847 -460 -0.14
#> 4 2019 335131 -2716 -0.80
#> 5 2020 332672 -2459 -0.73
#> 6 2021 318349 -14323 -4.31
#> 7 2022 318353 4 0.00
#> 8 2023 316478 -1875 -0.59
#> 9 2024 308913 -7565 -2.39
#> 10 2025 306686 -2227 -0.72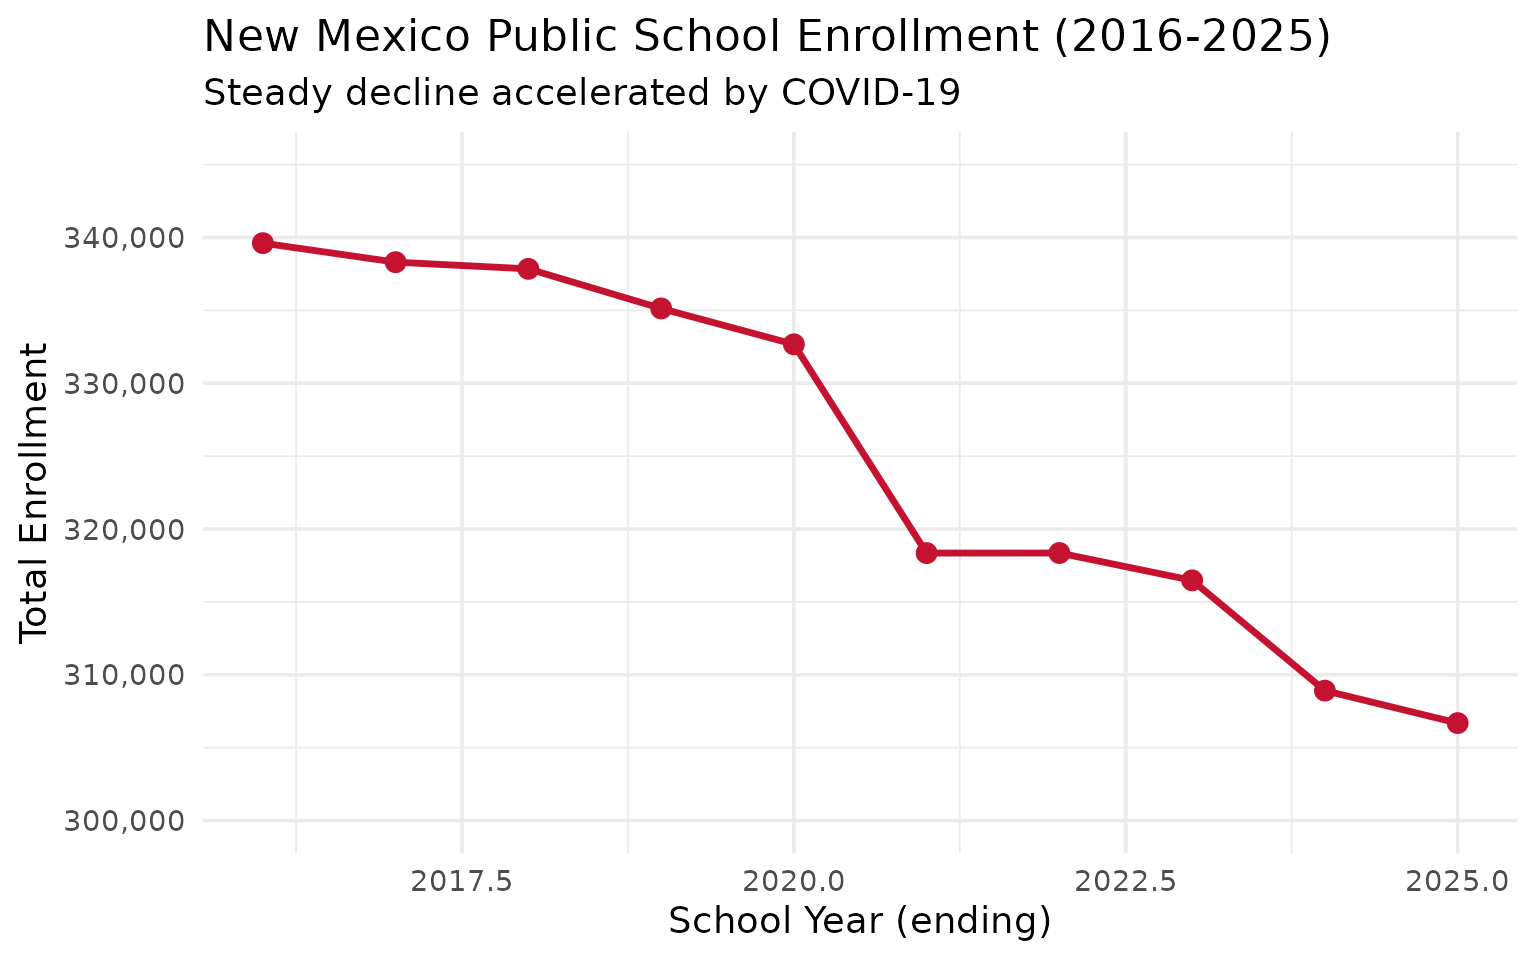
5. Albuquerque enrolls 1 in 4 NM students but is shrinking fastest
Albuquerque Public Schools is a colossus – 75,000 students, nearly 25% of the entire state. But APS lost 17,000 students since 2016, a decline steeper than the state average.
top_districts <- enr_2025 |>
  filter(is_district, subgroup == "total_enrollment", grade_level == "TOTAL") |>
  arrange(desc(n_students)) |>
  head(10) |>
  select(district_name, n_students)

stopifnot(nrow(top_districts) > 0)
top_districts
#> district_name n_students
#> 1 ALBUQUERQUE 75040
#> 2 LAS CRUCES 22709
#> 3 RIO RANCHO 16463
#> 4 GALLUP 12737
#> 5 GADSDEN 11739
#> 6 SANTA FE 11226
#> 7 FARMINGTON 10768
#> 8 HOBBS 10119
#> 9 ROSWELL 9184
#> 10 LOS LUNAS 8208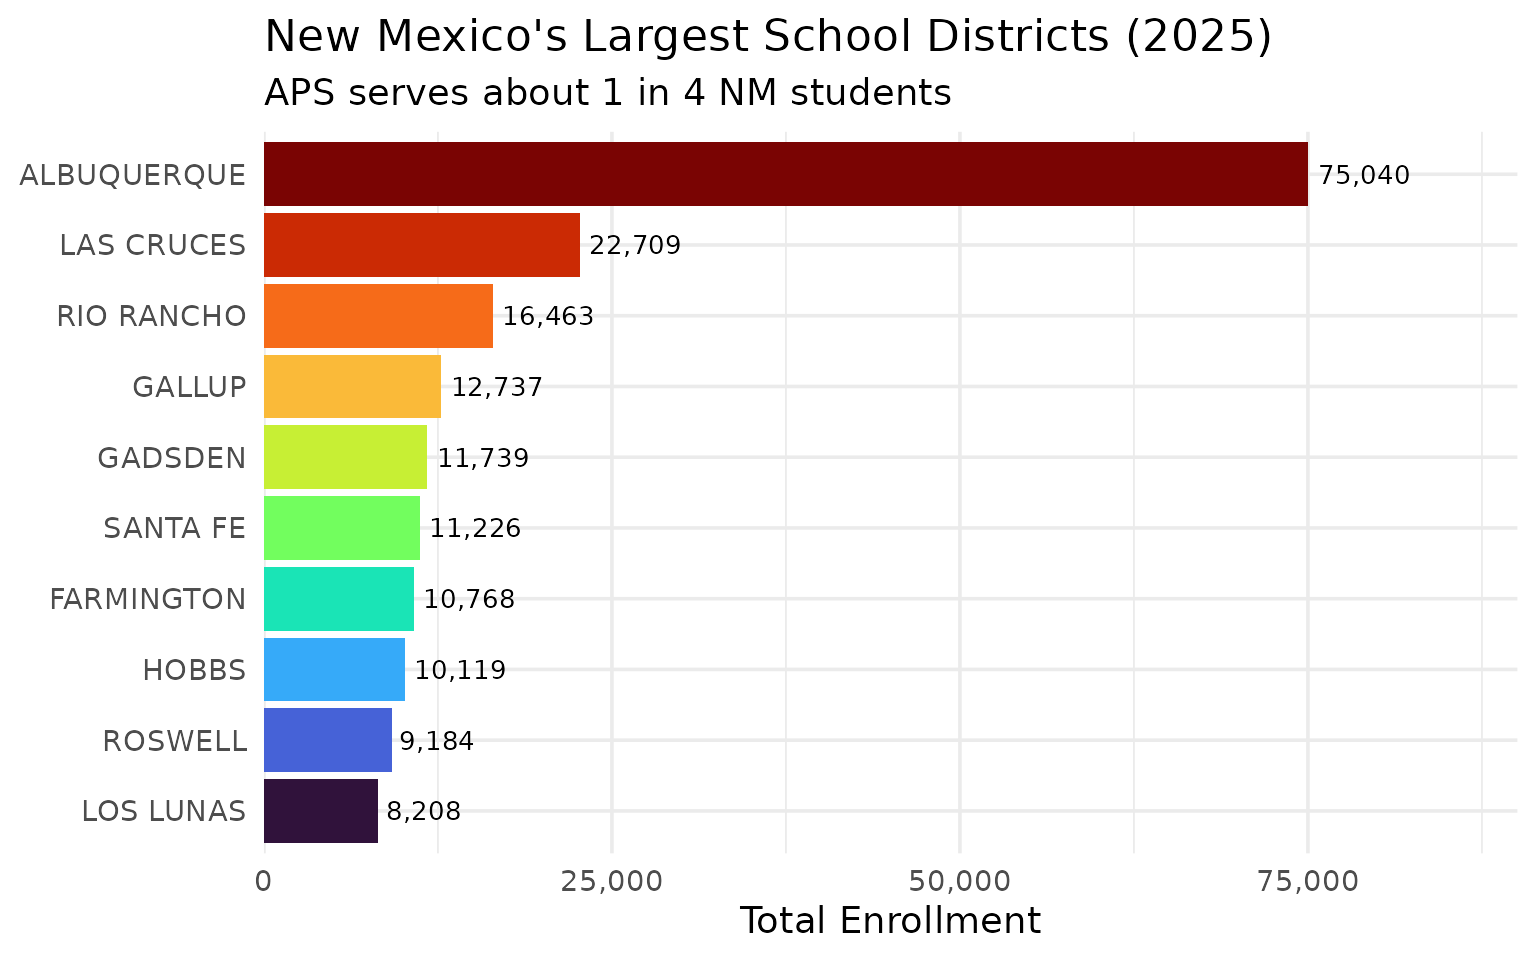
6. Hispanic students are 63% of enrollment – and the share keeps rising
New Mexico is one of only two majority-Hispanic states in the country. The Hispanic share of enrollment has grown from 61.8% in 2019 to 63.5% in 2025 even as overall enrollment shrinks.
Data caveat: In 2025, NM PED began reporting multiracial students as a separate category (7,221 students, previously 0). Some apparent declines in other race/ethnicity groups between 2023 and 2025 are partly reclassification effects, not actual population changes.
demographics <- enr_2025 |>
  filter(is_state, grade_level == "TOTAL",
         subgroup %in% c("hispanic", "white", "native_american", "black", "asian", "multiracial")) |>
  mutate(pct = round(pct * 100, 1)) |>
  select(subgroup, n_students, pct) |>
  arrange(desc(n_students))

stopifnot(nrow(demographics) > 0)
demographics
#> subgroup n_students pct
#> 1 hispanic 194595 63.5
#> 2 white 61345 20.0
#> 3 native_american 30602 10.0
#> 4 multiracial 7221 2.4
#> 5 black 5580 1.8
#> 6 asian 3926 1.3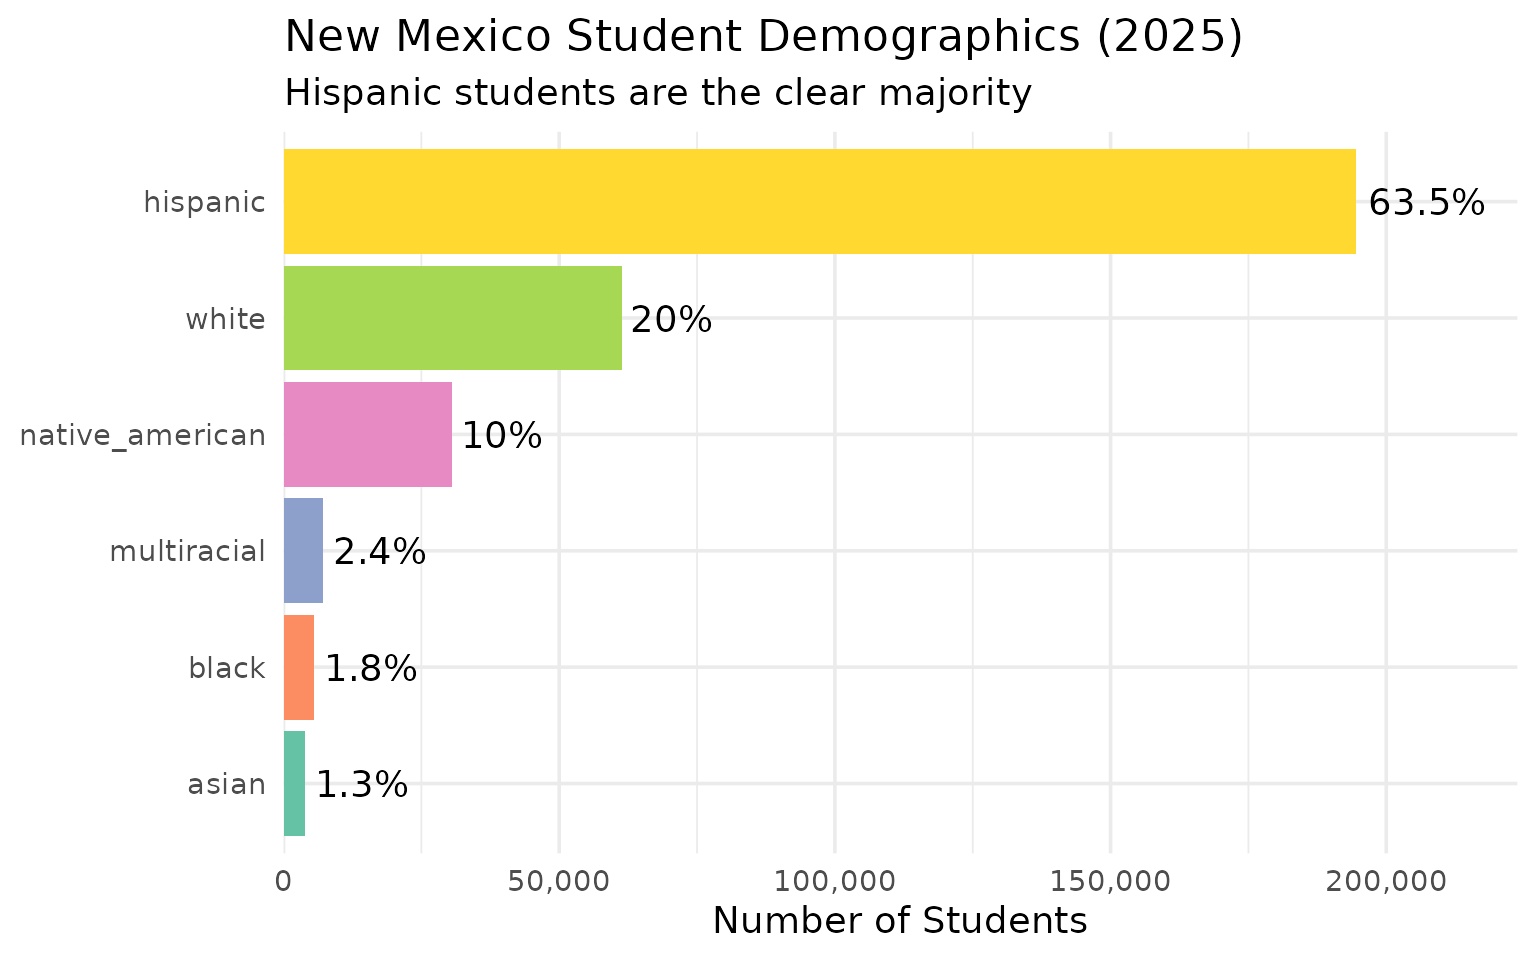
7. Gallup leads the state in Native American enrollment
New Mexico has the third-highest Native American student population in the country, concentrated in districts near the Navajo Nation, Zuni, and numerous Pueblos. Gallup alone enrolls over 8,000 Native American students.
native_am <- enr_2025 |>
  filter(is_district, subgroup == "native_american", grade_level == "TOTAL") |>
  arrange(desc(n_students)) |>
  head(10) |>
  select(district_name, n_students, pct) |>
  mutate(pct = round(pct * 100, 1))

stopifnot(nrow(native_am) > 0)
native_am
#> district_name n_students pct
#> 1 GALLUP 8027 63.0
#> 2 ALBUQUERQUE 4093 5.5
#> 3 CENTRAL 3903 86.4
#> 4 FARMINGTON 3896 36.2
#> 5 GRANTS 1472 48.2
#> 6 BERNALILLO 1272 45.9
#> 7 ZUNI 966 91.8
#> 8 BLOOMFIELD 961 40.2
#> 9 RIO RANCHO 637 3.9
#> 10 CUBA 508 70.5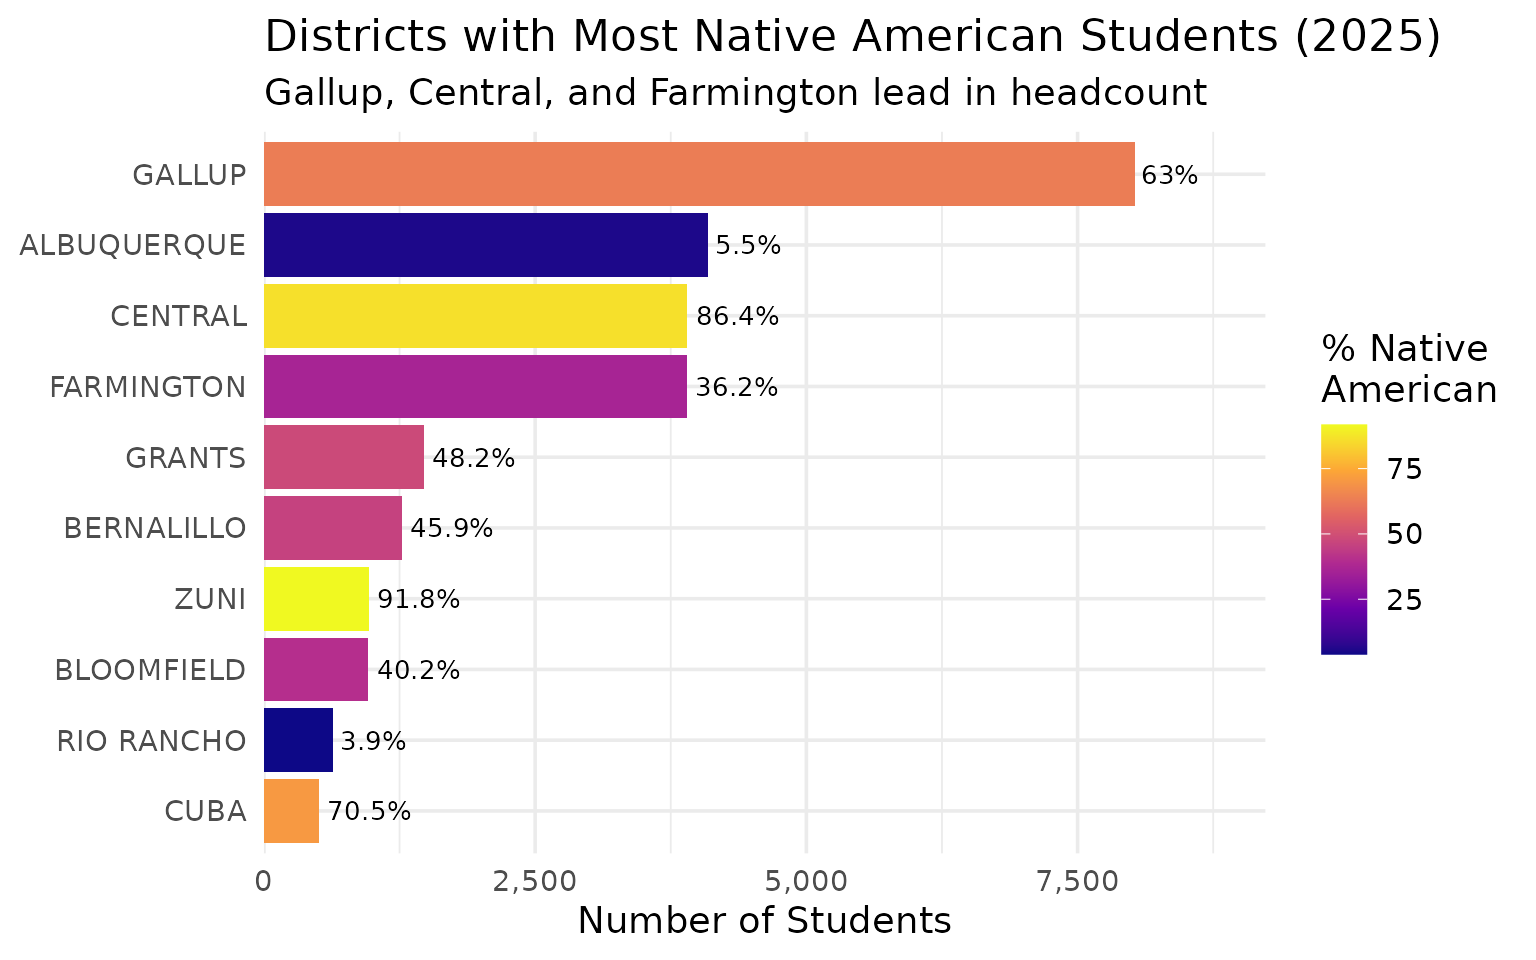
8. Albuquerque vs Las Cruces: Two cities, one direction
New Mexico’s two largest districts both lost students from 2016 to 2025, but Albuquerque’s decline (-18.6%) far outpaced Las Cruces (-9.0%).
enr_era1 <- fetch_enr_multi(2016:2018, use_cache = TRUE)

abq_lc_era1 <- enr_era1 |>
  filter(is_district, subgroup == "total_enrollment", grade_level == "TOTAL",
         district_name %in% c("ALBUQUERQUE", "LAS CRUCES")) |>
  select(end_year, district_name, n_students)

abq_lc_2025 <- enr_2025 |>
  filter(is_district, subgroup == "total_enrollment", grade_level == "TOTAL",
         district_name %in% c("ALBUQUERQUE", "LAS CRUCES")) |>
  select(end_year, district_name, n_students)

abq_lc <- bind_rows(abq_lc_era1, abq_lc_2025)
stopifnot(nrow(abq_lc) > 0)
abq_lc |> pivot_wider(names_from = end_year, values_from = n_students)
#> # A tibble: 2 x 5
#> district_name `2016` `2017` `2018` `2025`
#> <chr> <dbl> <dbl> <dbl> <dbl>
#> 1 ALBUQUERQUE 92152 91426 91110 75040
#> 2 LAS CRUCES 24965 25174 24751 22709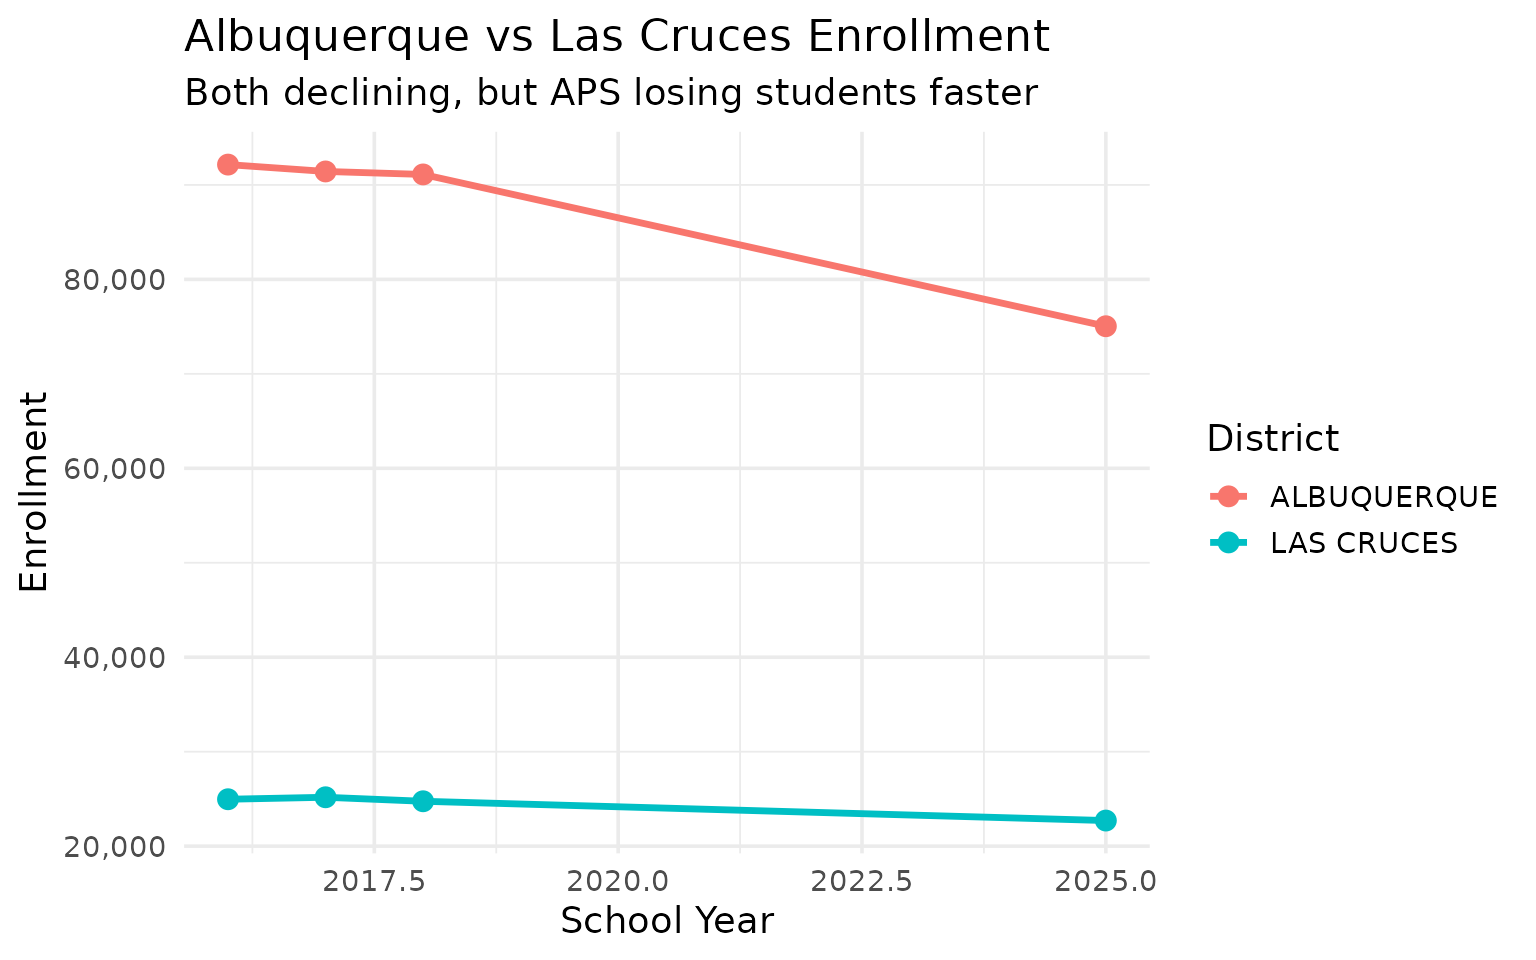
9. 1 in 5 NM students is an English Learner
New Mexico’s ELL rate of 18.2% is among the highest in the nation – more than double the national average. Border districts like Gadsden (43.8%) and Deming (44.0%) have the highest rates.
ell_trend <- all_years |>
  filter(is_state, subgroup == "ell", grade_level == "TOTAL") |>
  mutate(pct = round(pct * 100, 1)) |>
  select(end_year, n_students, pct)

stopifnot(nrow(ell_trend) > 0)
ell_trend
#> end_year n_students pct
#> 1 2019 50952 15.2
#> 2 2020 52719 15.8
#> 3 2021 49320 15.5
#> 4 2022 53572 16.8
#> 5 2023 55715 17.6
#> 6 2025 55798 18.2
ell_districts <- enr_2025 |>
  filter(is_district, subgroup == "ell", grade_level == "TOTAL",
         n_students >= 100) |>
  arrange(desc(pct)) |>
  head(10) |>
  select(district_name, n_students, pct) |>
  mutate(pct = round(pct * 100, 1))

stopifnot(nrow(ell_districts) > 0)
ell_districts
#> district_name n_students pct
#> 1 HATCH VALLEY 614 53.6
#> 2 DEMING 2251 44.0
#> 3 GADSDEN 5139 43.8
#> 4 ALBUQUERQUE BILINGUAL ACADEMY 136 41.5
#> 5 ZUNI 408 38.8
#> 6 CUBA 243 33.7
#> 7 CENTRAL 1478 32.7
#> 8 MISSION ACHIEVEMENT AND SUCCESS 719 32.2
#> 9 LOVINGTON 1071 31.4
#> 10 BERNALILLO 836 30.1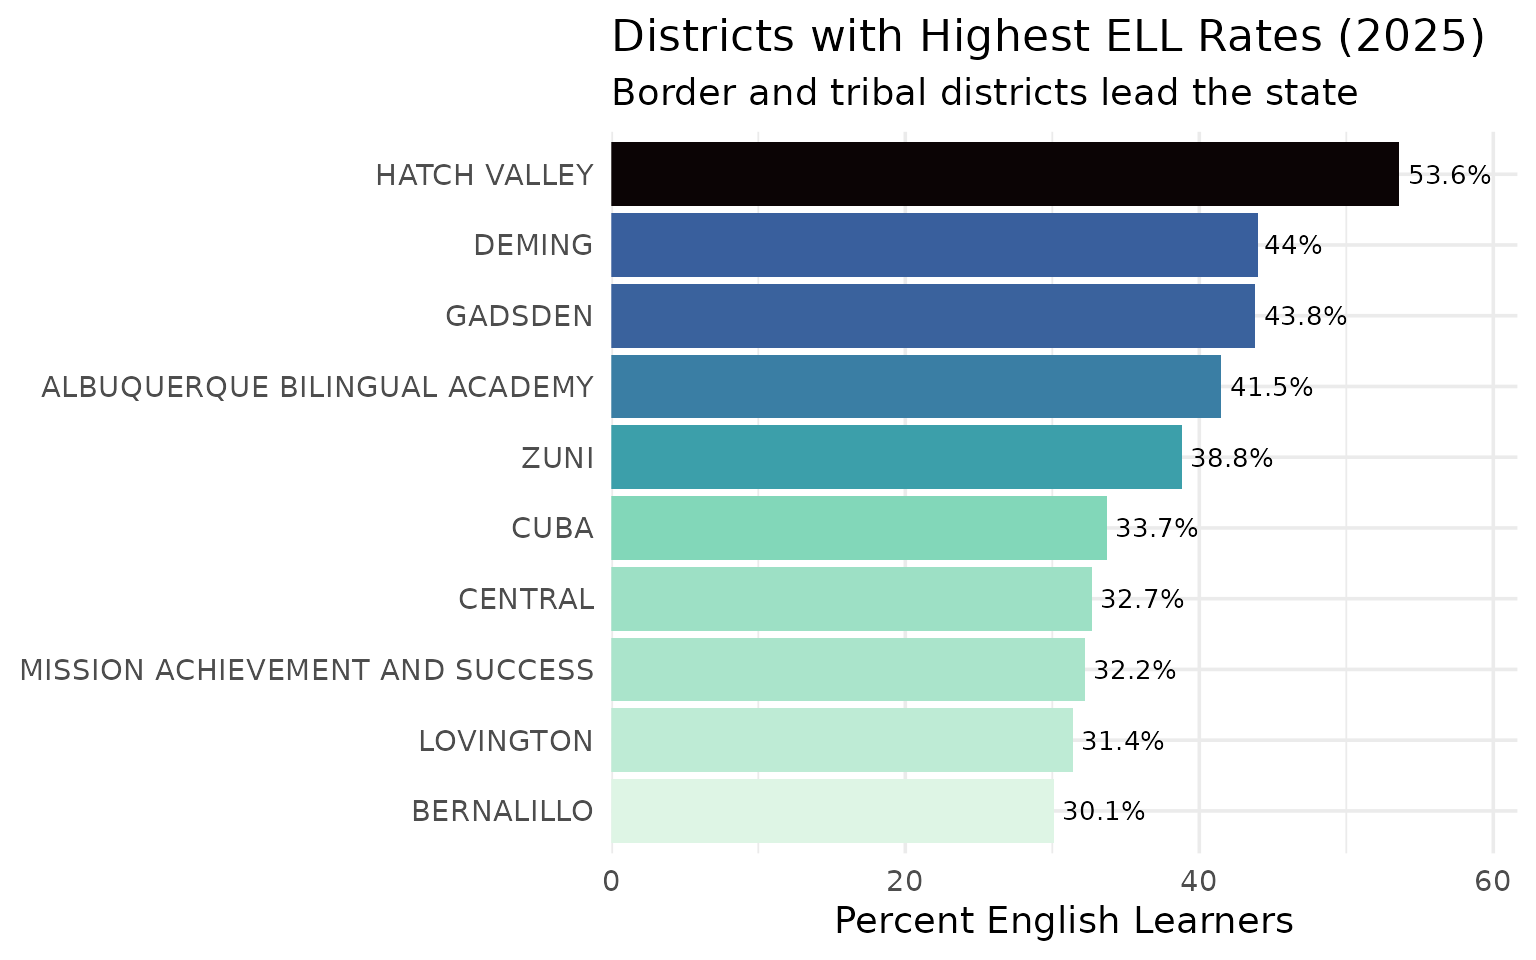
10. Special education enrollment is surging
The special education rate climbed from 15.9% in 2019 to 19.6% in 2025 – an increase of nearly 7,000 students even as total enrollment fell. Nearly 1 in 5 NM students now receives special education services.
sped_trend <- all_years |>
  filter(is_state, subgroup == "special_ed", grade_level == "TOTAL") |>
  mutate(pct = round(pct * 100, 1)) |>
  select(end_year, n_students, pct)

stopifnot(nrow(sped_trend) > 0)
sped_trend
#> end_year n_students pct
#> 1 2019 53253 15.9
#> 2 2020 55070 16.6
#> 3 2021 53477 16.8
#> 4 2022 53762 16.9
#> 5 2023 55537 17.5
#> 6 2025 60257 19.6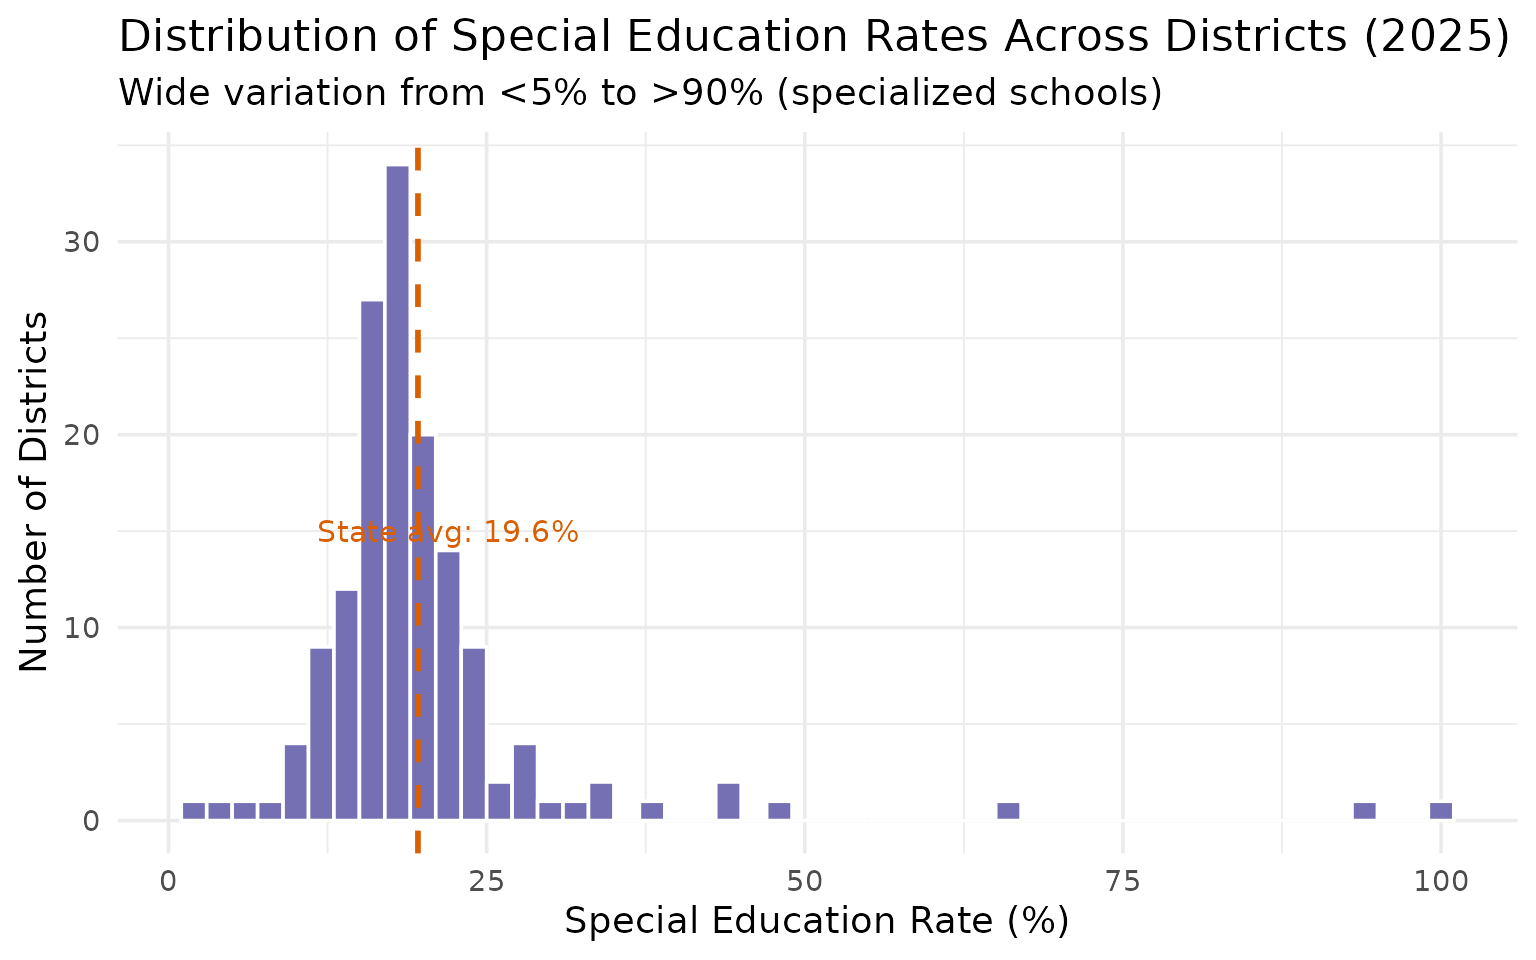
11. 9th grade is the biggest grade – a demographic bulge
New Mexico’s 9th grade consistently has thousands more students than any other grade. In 2024, 9th grade had 27,396 students versus just 19,688 in kindergarten – a 39% gap that signals both grade retention and rising dropout risk.
enr_2024 <- fetch_enr(2024, use_cache = TRUE)

grade_data <- enr_2024 |>
  filter(is_state, subgroup == "total_enrollment",
         grade_level %in% c("PK", "K", "01", "02", "03", "04", "05",
                            "06", "07", "08", "09", "10", "11", "12")) |>
  select(grade_level, n_students) |>
  mutate(grade_level = factor(grade_level,
    levels = c("PK", "K", "01", "02", "03", "04", "05",
               "06", "07", "08", "09", "10", "11", "12")))

stopifnot(nrow(grade_data) > 0)
grade_data
#> grade_level n_students
#> 1 PK 11456
#> 2 K 19688
#> 3 01 20926
#> 4 02 21999
#> 5 03 21425
#> 6 04 22022
#> 7 05 22511
#> 8 06 22529
#> 9 07 22962
#> 10 08 23522
#> 11 09 27396
#> 12 10 26300
#> 13 11 23660
#> 14 12 22516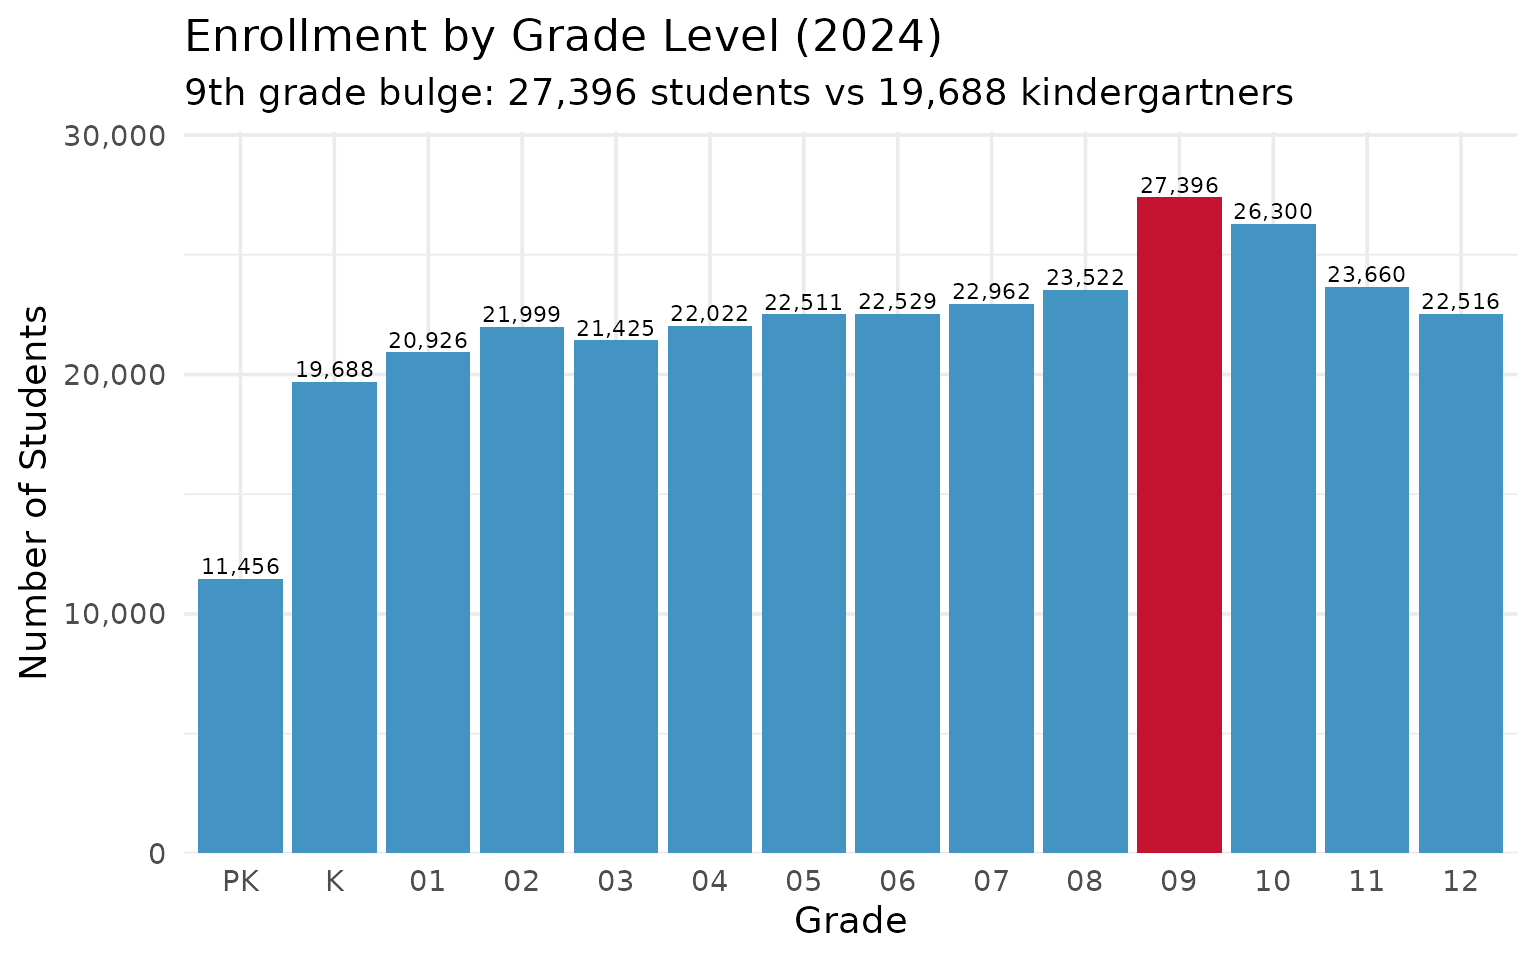
12. Charter schools enroll 10.8% of students across 98 schools
New Mexico has 98 charter schools enrolling 33,163 students – 10.8% of statewide enrollment. The charter sector includes 58 state-chartered schools (authorized by the Public Education Commission, operating as their own LEA) and 42 locally-authorized charters within traditional districts (30 under APS alone). The is_charter flag is derived from NM PED’s official school directory, not name-pattern matching.
charters <- enr_2025 |>
  filter(is_school, subgroup == "total_enrollment", grade_level == "TOTAL") |>
  group_by(is_charter) |>
  summarize(
    n_schools = n(),
    total_enrollment = sum(n_students),
    .groups = "drop"
  ) |>
  mutate(pct_enrollment = round(total_enrollment / sum(total_enrollment) * 100, 1))

stopifnot(nrow(charters) > 0)
charters
#> # A tibble: 2 x 4
#> is_charter n_schools total_enrollment pct_enrollment
#> <lgl> <int> <dbl> <dbl>
#> 1 FALSE 778 273415 89.2
#> 2 TRUE 98 33163 10.8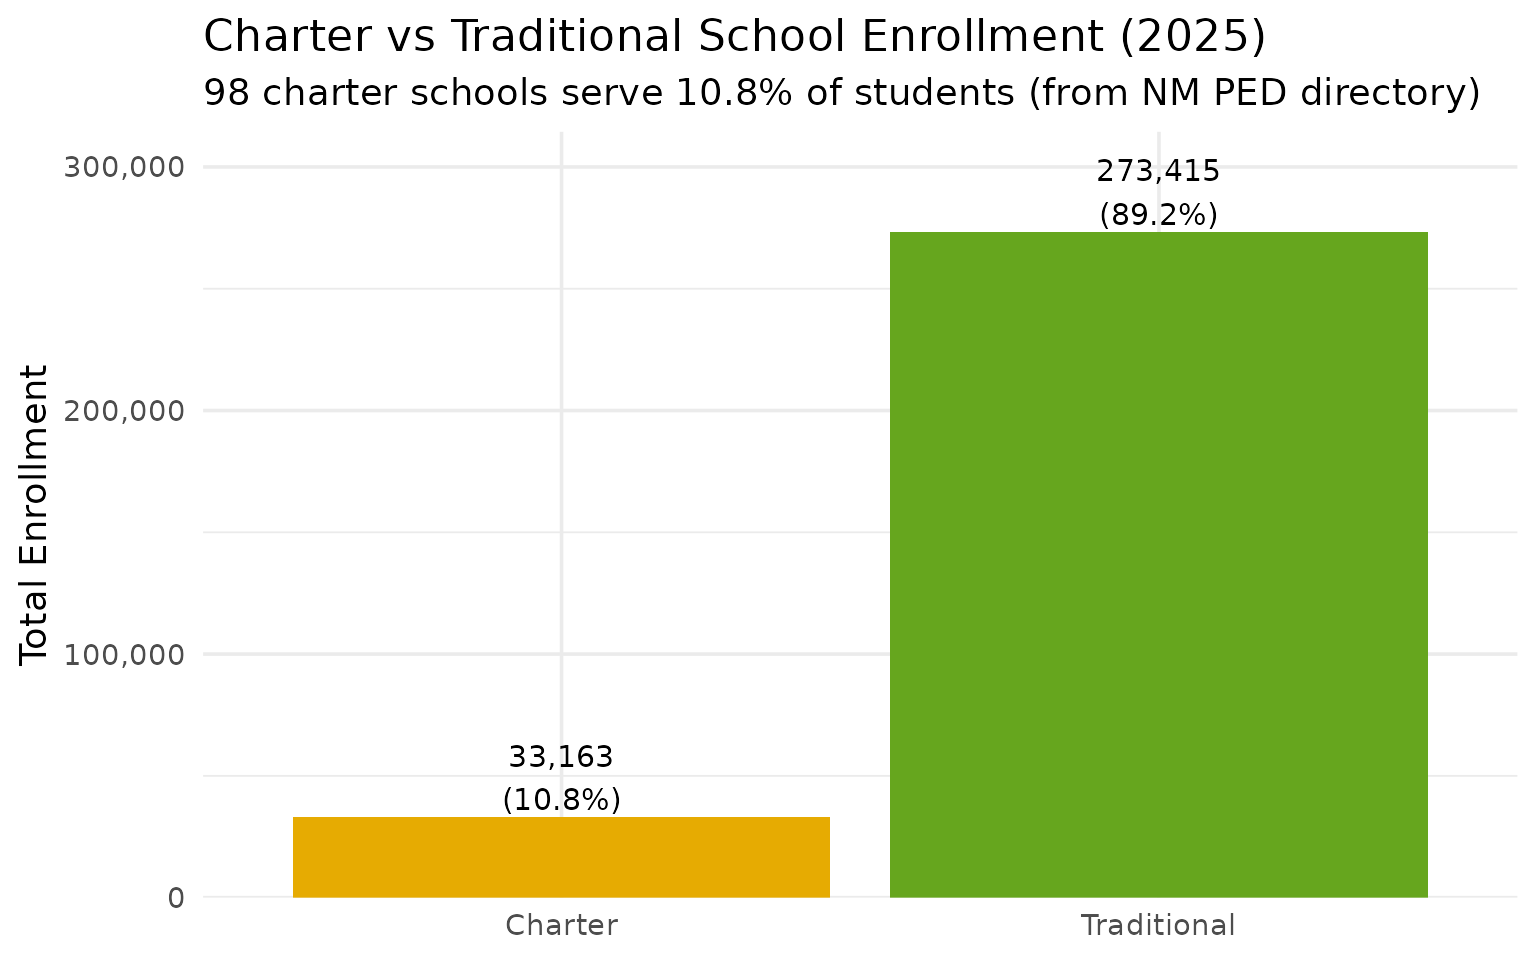
13. The smallest districts: 18 students in Dream Dine
New Mexico has 23 districts with fewer than 100 students. The smallest – Dream Dine – serves just 18 students. These tiny districts are disproportionately tribal and charter schools operating in remote communities.
smallest <- enr_2025 |>
  filter(is_district, subgroup == "total_enrollment", grade_level == "TOTAL") |>
  arrange(n_students) |>
  head(10) |>
  select(district_name, n_students)

stopifnot(nrow(smallest) > 0)
smallest
#> district_name n_students
#> 1 DREAM DINE 18
#> 2 SEQUOYAH 19
#> 3 NM CORRECTIONS 25
#> 4 UNM MIMBRES SCHOOL 25
#> 5 WALATOWA CHARTER HIGH 34
#> 6 NM SCHOOL FOR THE BLIND AND VISUALLY IMPAIRED 45
#> 7 SAN DIEGO RIVERSIDE 50
#> 8 ROOTS & WINGS COMMUNITY 53
#> 9 DZIT DIT LOOL SCHOOL OF EMPOWERMENT ACTION AND PERSEVERANCE 56
#> 10 SIX DIRECTIONS INDIGENOUS SCHOOL 58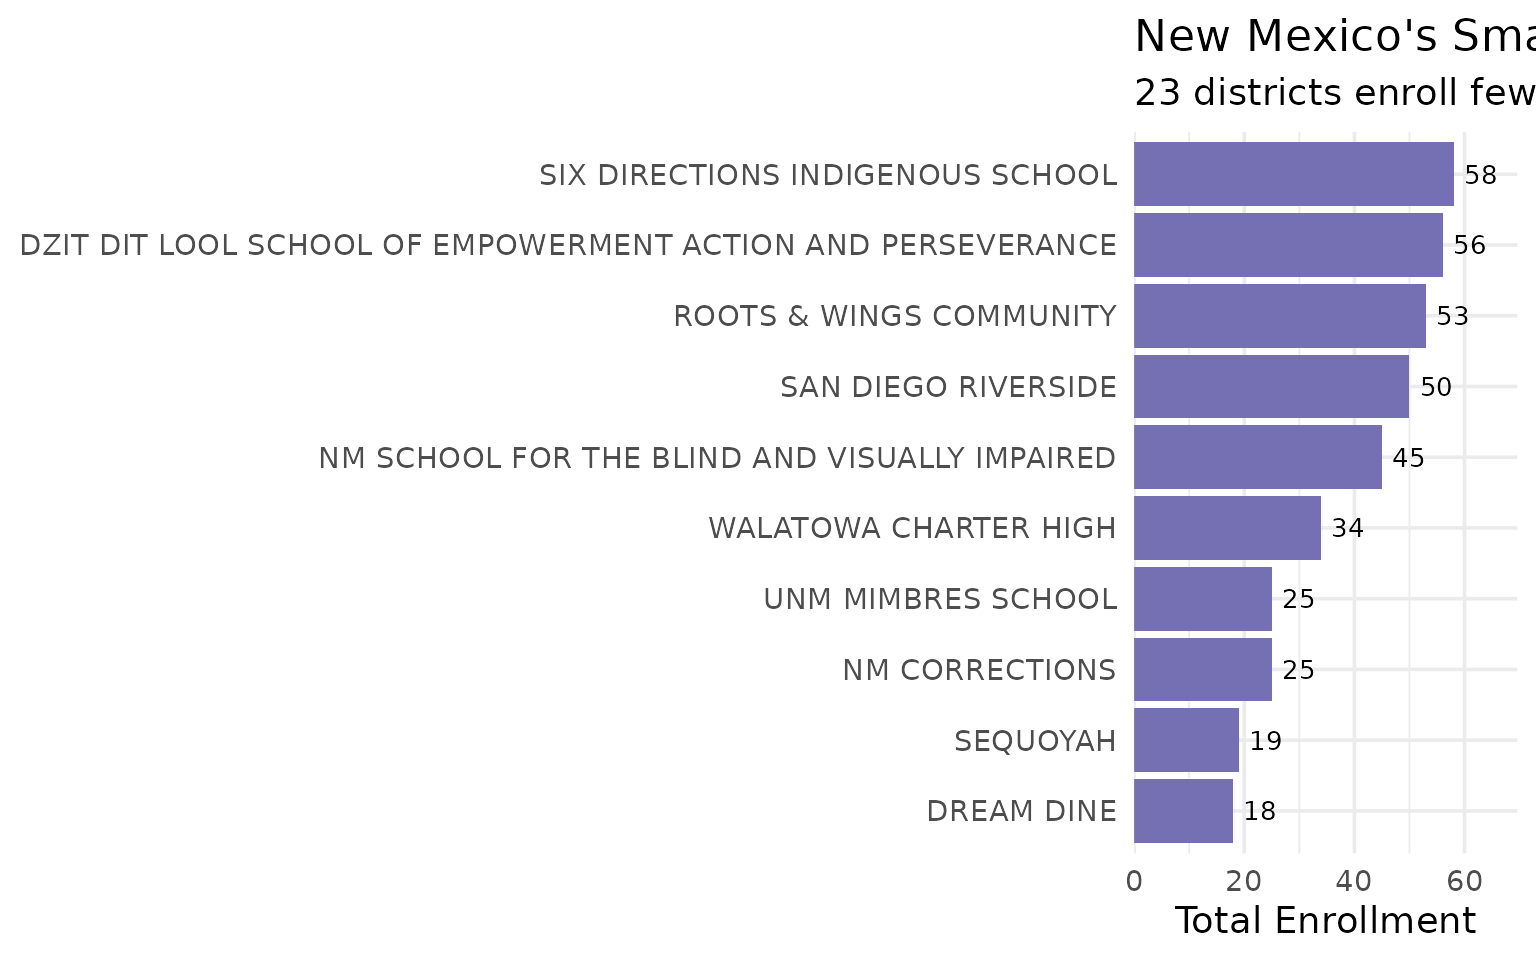
14. The rural-urban divide: 8 large districts hold 56% of students
Eight districts with 10,000+ students enroll 171,000 of the state’s 307,000 students. Meanwhile, 114 small and tiny districts share just 33,000 students between them.
size_dist <- enr_2025 |>
  filter(is_district, subgroup == "total_enrollment", grade_level == "TOTAL") |>
  mutate(size_category = case_when(
    n_students >= 10000 ~ "Large (10k+)",
    n_students >= 1000 ~ "Medium (1k-10k)",
    n_students >= 100 ~ "Small (100-1k)",
    TRUE ~ "Tiny (<100)"
  )) |>
  group_by(size_category) |>
  summarize(
    n_districts = n(),
    total_students = sum(n_students),
    .groups = "drop"
  ) |>
  mutate(size_category = factor(size_category,
    levels = c("Large (10k+)", "Medium (1k-10k)", "Small (100-1k)", "Tiny (<100)")))

stopifnot(nrow(size_dist) > 0)
size_dist
#> # A tibble: 4 x 3
#> size_category n_districts total_students
#> <fct> <int> <dbl>
#> 1 Large (10k+) 8 170801
#> 2 Medium (1k-10k) 33 102433
#> 3 Small (100-1k) 91 32080
#> 4 Tiny (<100) 23 1372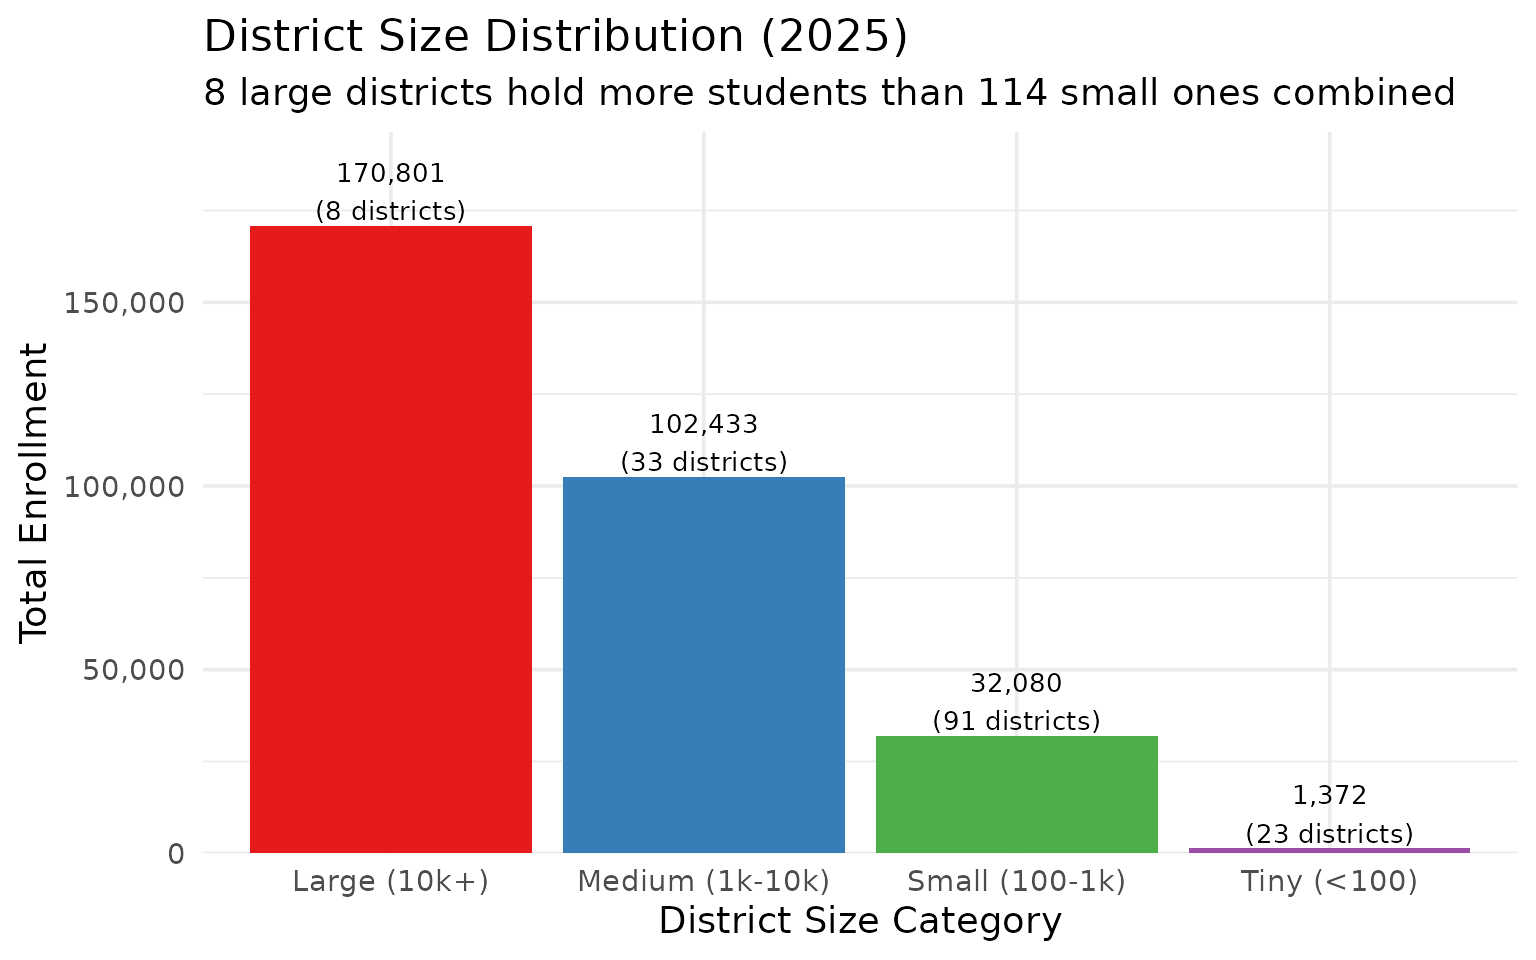
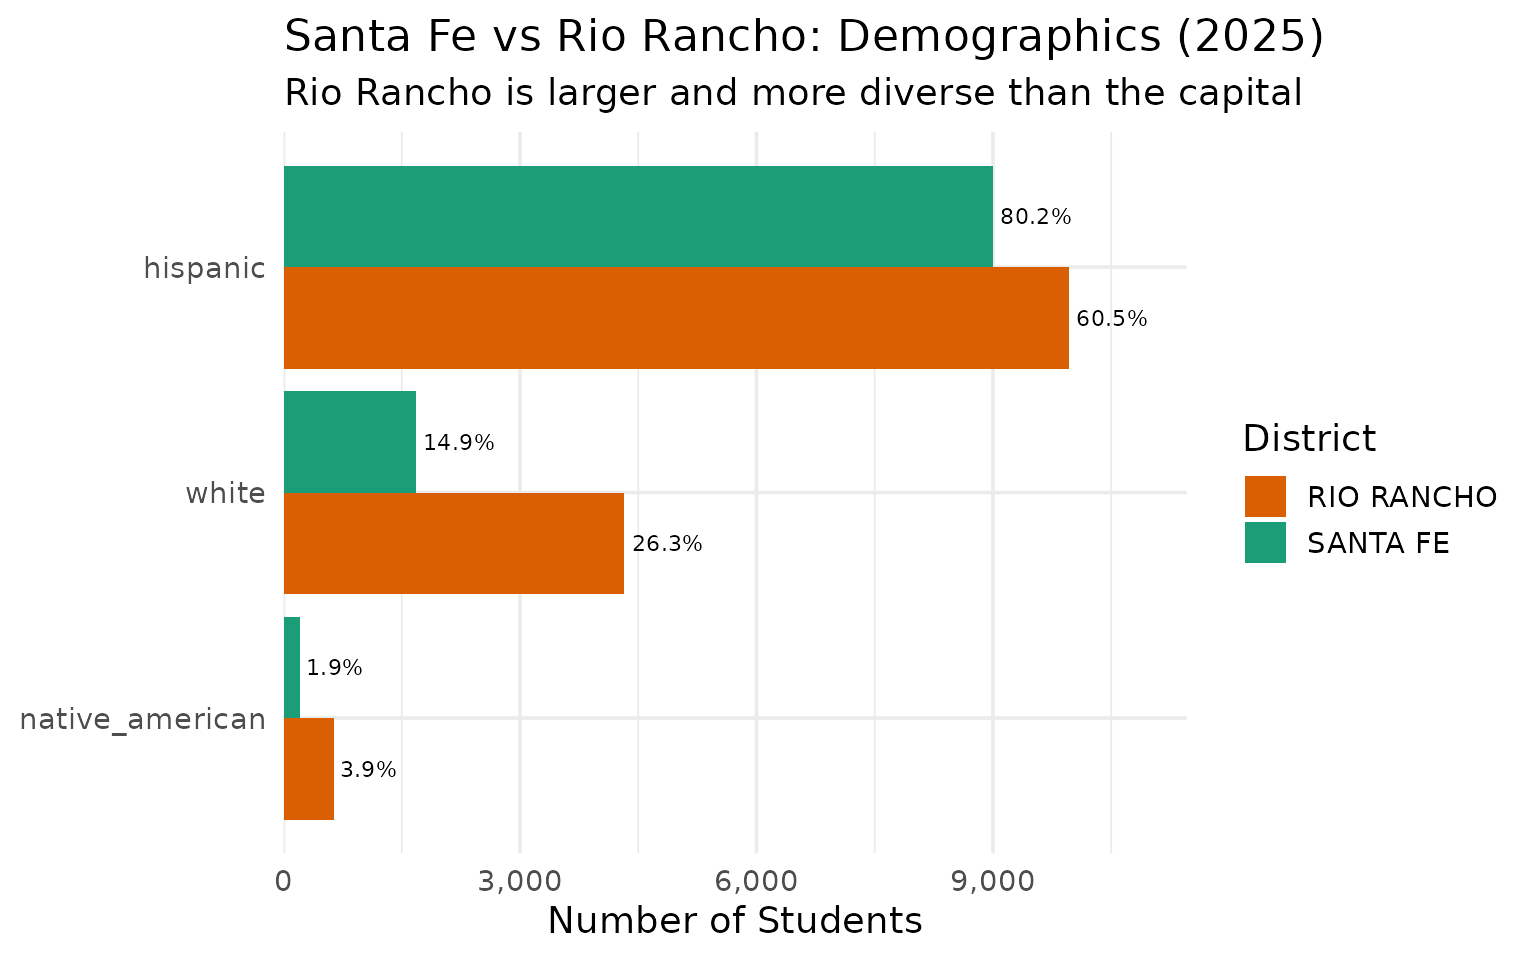
15. Santa Fe vs Rio Rancho: The capital falls behind the suburb
Rio Rancho – a fast-growing Albuquerque suburb – now enrolls 16,463 students, surpassing the state capital Santa Fe (11,226) by over 5,000 students. Rio Rancho has become NM’s third-largest district.
sf_rr <- enr_2025 |>
  filter(is_district, subgroup %in% c("total_enrollment", "hispanic", "white", "native_american"),
         grade_level == "TOTAL",
         district_name %in% c("SANTA FE", "RIO RANCHO")) |>
  select(district_name, subgroup, n_students, pct) |>
  mutate(pct = round(pct * 100, 1))

stopifnot(nrow(sf_rr) > 0)
sf_rr |> pivot_wider(names_from = subgroup, values_from = c(n_students, pct))
#> # A tibble: 2 x 9
#> district_name n_students_total_enrollment n_students_white n_students_hispanic
#> <chr> <dbl> <dbl> <dbl>
#> 1 RIO RANCHO 16463 4324 9963
#> 2 SANTA FE 11226 1676 8999
#> # ... 5 more variables: n_students_native_american <dbl>,
#> # pct_total_enrollment <dbl>, pct_white <dbl>, pct_hispanic <dbl>,
#> # pct_native_american <dbl>