Fetch and analyze Tennessee school enrollment and assessment data from the Tennessee Department of Education (TDOE) in R or Python.
Part of the njschooldata family.
Full documentation — all 15 stories with interactive charts, getting-started guide, and complete function reference.
Highlights
library(tnschooldata)
library(dplyr)
library(tidyr)
library(ggplot2)
theme_set(theme_minimal(base_size = 14))

enr_2024 <- fetch_enr(2024, use_cache = TRUE)

total_students <- enr_2024 %>%
  filter(is_state, grade_level == "TOTAL", subgroup == "total_enrollment") %>%
  pull(n_students)
1. Nashville is a majority-minority district – the state is not
Metro Nashville Public Schools is 38% Black, 34% Hispanic, and 24% White – a dramatic contrast with the 58% White statewide average.
nashville <- enr_2024 %>%
  filter(is_district, grade_level == "TOTAL",
         grepl("Metro Nashville", district_name),
         subgroup %in% c("white", "black", "hispanic", "asian")) %>%
  select(subgroup, n_students) %>%
  mutate(pct = n_students / sum(n_students) * 100,
         area = "Metro Nashville")

stopifnot(nrow(nashville) == 4)

state_demo <- enr_2024 %>%
  filter(is_state, grade_level == "TOTAL",
         subgroup %in% c("white", "black", "hispanic", "asian")) %>%
  select(subgroup, n_students) %>%
  mutate(pct = n_students / sum(n_students) * 100,
         area = "Tennessee State")

comparison <- bind_rows(nashville, state_demo)
comparison
#> # A tibble: 8 x 4
#> subgroup n_students pct area
#> <chr> <dbl> <dbl> <chr>
#> 1 white 18560 24.0 Metro Nashville
#> 2 black 29387 38.0 Metro Nashville
#> 3 hispanic 26294 34.0 Metro Nashville
#> 4 asian 3093 4.0 Metro Nashville
#> 5 white 563610 58.0 Tennessee State
#> 6 black 233218 24.0 Tennessee State
#> 7 hispanic 145761 15.0 Tennessee State
#> 8 asian 29152 3.0 Tennessee State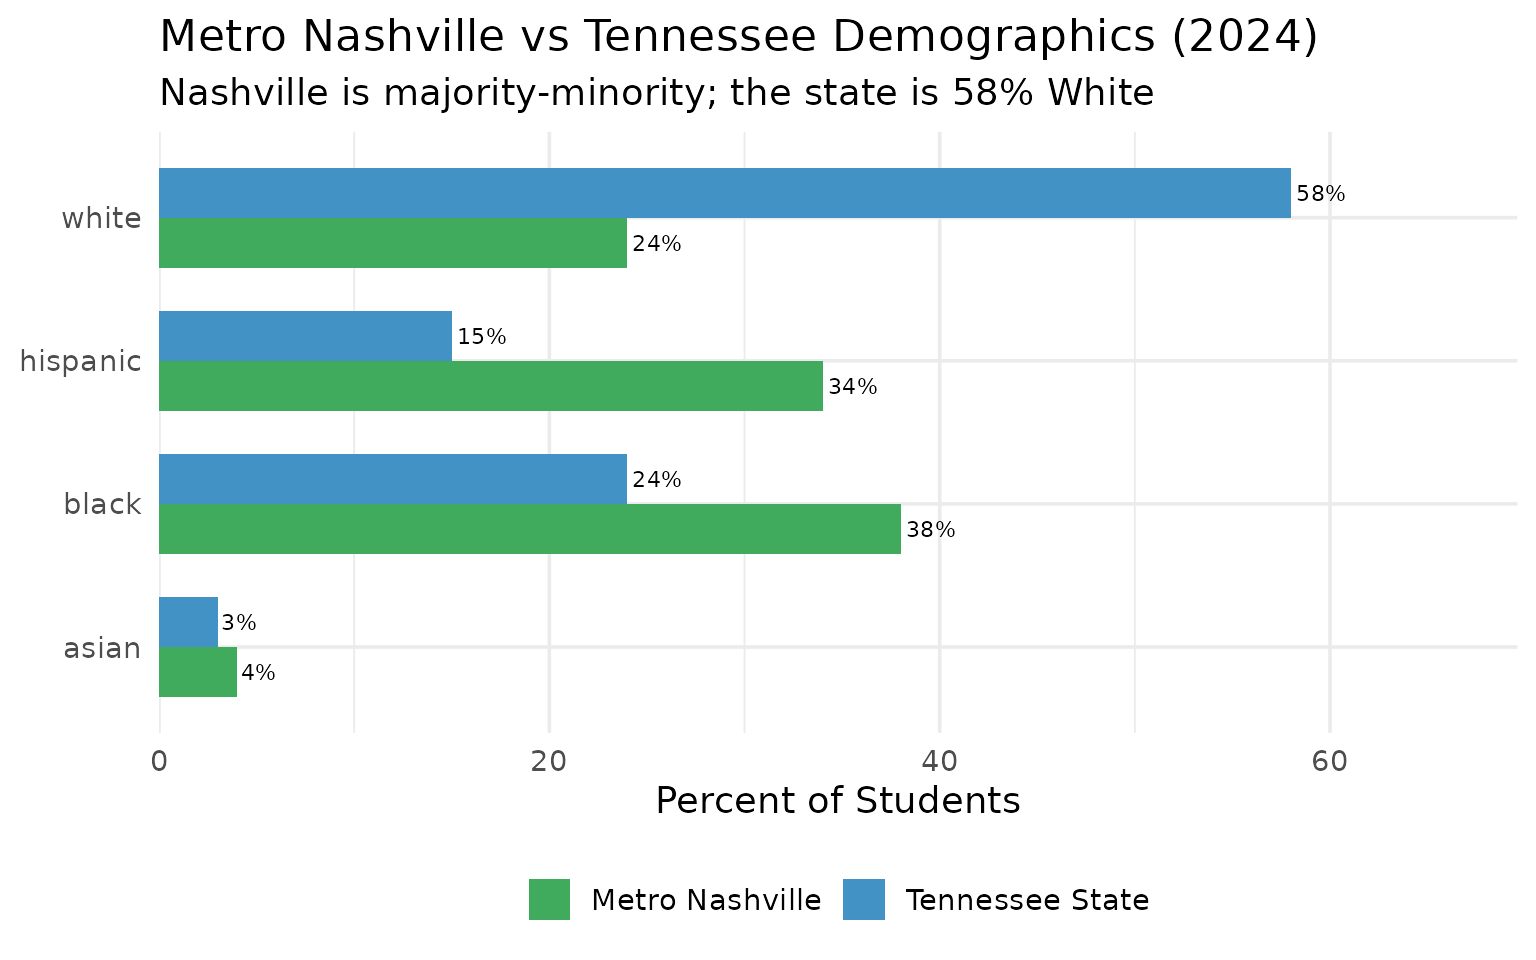
2. Memphis-Shelby has 53% economically disadvantaged students
The poverty gap between districts is stark – Memphis-Shelby’s rate is more than double Williamson County’s.
econ_by_district <- enr_2024 %>%
  filter(is_district, grade_level == "TOTAL", subgroup == "econ_disadv") %>%
  left_join(
    enr_2024 %>%
      filter(is_district, grade_level == "TOTAL", subgroup == "total_enrollment") %>%
      select(district_id, total = n_students),
    by = "district_id"
  ) %>%
  mutate(pct = n_students / total * 100) %>%
  filter(total > 10000) %>%
  arrange(desc(pct)) %>%
  head(10) %>%
  select(district_name, n_students, total, pct)

stopifnot(nrow(econ_by_district) > 0)
econ_by_district
#> # A tibble: 10 x 4
#> district_name n_students total pct
#> <chr> <dbl> <dbl> <dbl>
#> 1 Memphis-Shelby County Schools 55757 105202 53.0
#> 2 Putnam County 5524 11273 49.0
#> 3 Madison County 5246 11922 44.0
#> 4 Hamilton County 15220 44765 34.0
#> 5 Metro Nashville Public Schools 23974 77334 31.0
#> 6 Bradley County 2713 10049 27.0
#> 7 Maury County 3307 12719 26.0
#> 8 Robertson County 2437 11078 22.0
#> 9 Sevier County 2971 14146 21.0
#> 10 Montgomery County 8115 38641 21.0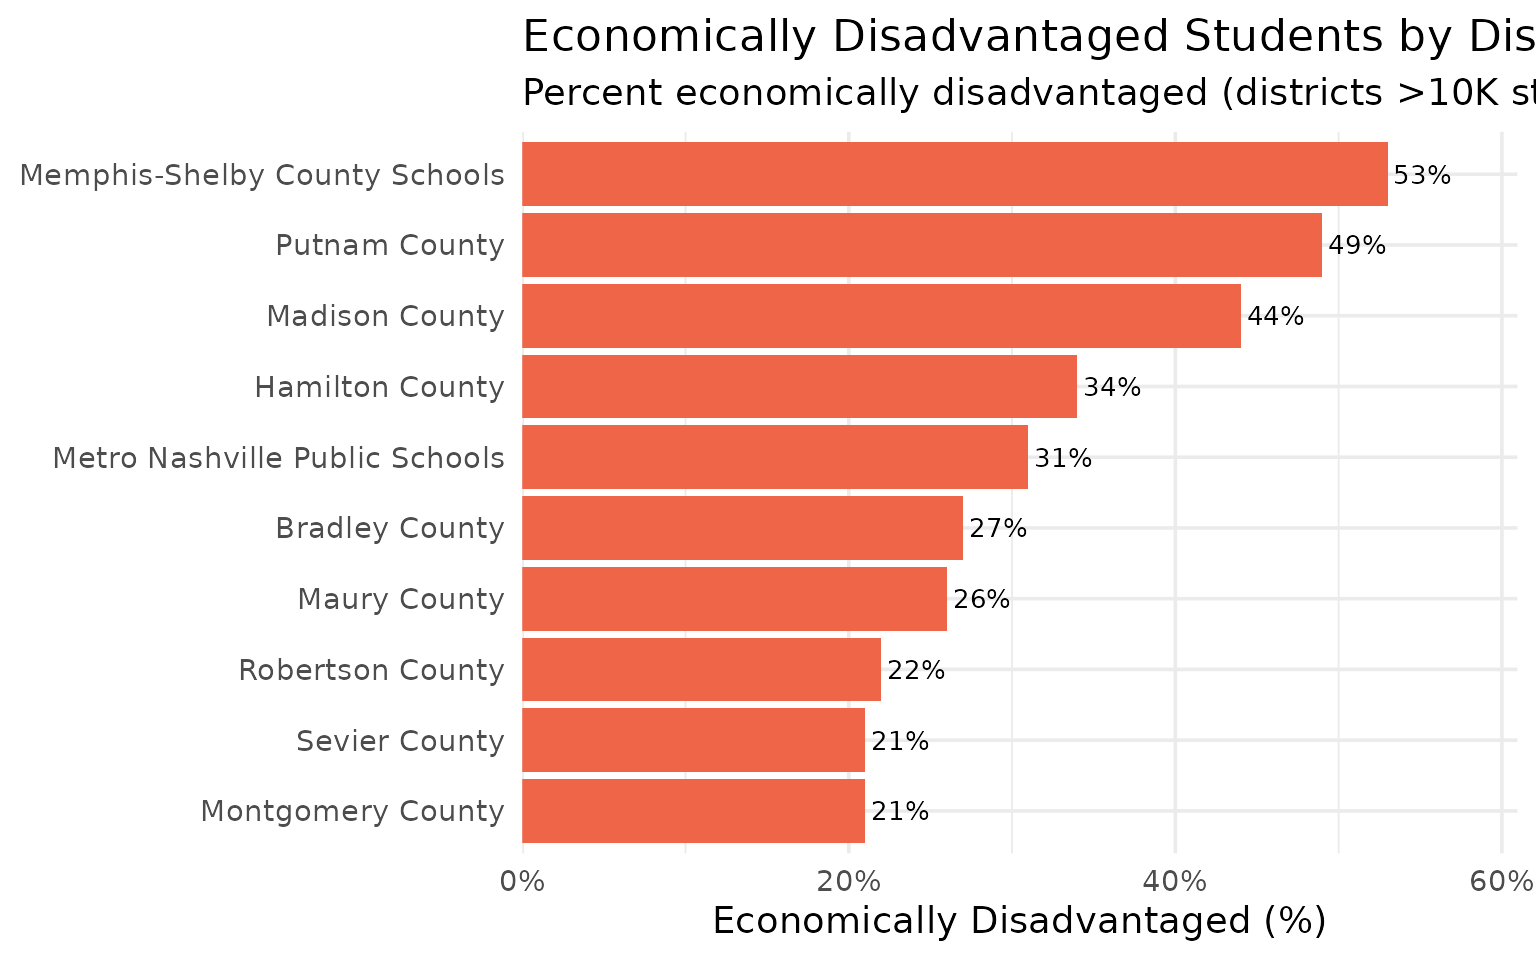
3. Tennessee runs an Achievement School District and a state charter commission
Tennessee’s ASD and Public Charter School Commission together serve over 9,000 students as state-run alternatives to traditional districts.
special_districts <- enr_2024 %>%
  filter(is_district, subgroup == "total_enrollment", grade_level == "TOTAL",
         grepl("Achievement School District|Charter School Commission", district_name)) %>%
  select(district_name, n_students)

stopifnot(nrow(special_districts) > 0)
special_districts

cat("Combined ASD + Charter Commission enrollment:",
    sum(special_districts$n_students), "students\n")
cat("Share of state total:",
    round(sum(special_districts$n_students) / total_students * 100, 2), "%\n")
#> # A tibble: 2 x 2
#> district_name n_students
#> <chr> <dbl>
#> 1 Achievement School District 4456
#> 2 Tennessee Public Charter School Commission 4796
#> Combined ASD + Charter Commission enrollment: 9252 students
#> Share of state total: 0.95 %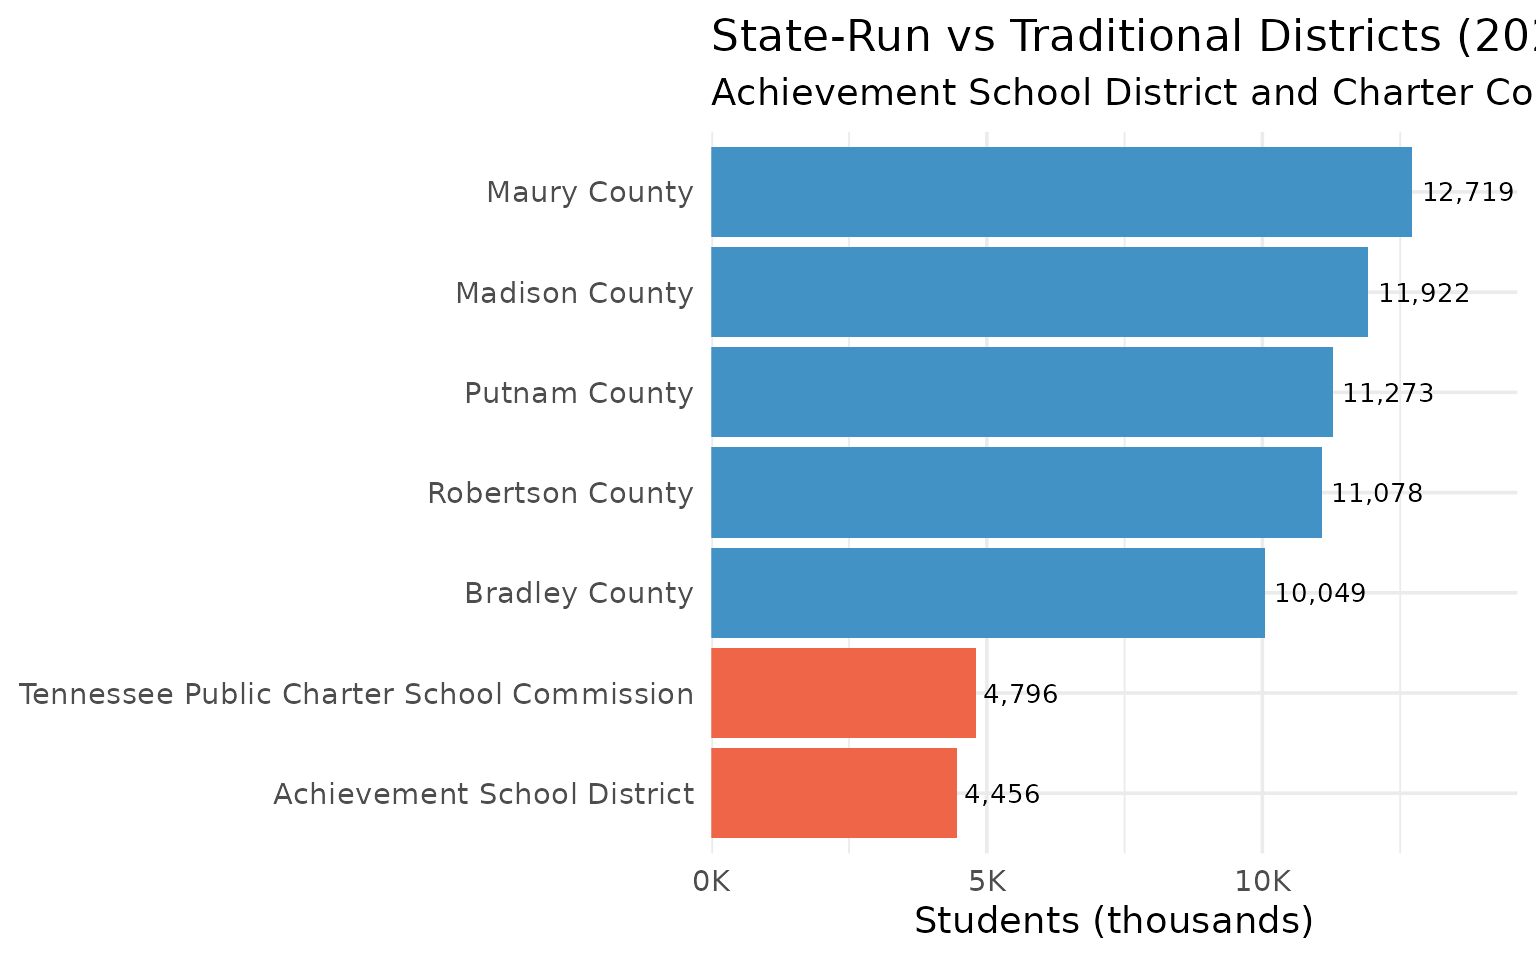
Data Taxonomy
| Category | Years | Function | Details |
|---|---|---|---|
| Enrollment | 1999-2024 |
fetch_enr() / fetch_enr_multi()
|
State, district, campus. Race, gender, FRPL, SpEd, LEP |
| Assessments | 2019-2025 |
fetch_assessment() / fetch_assessment_multi()
|
State, district, school. ELA, Math, Science, Social Studies, EOC |
| Graduation | — | — | Not yet available |
| Directory | Current | fetch_directory() |
District, school. Principal, superintendent, address, phone, grades |
| Per-Pupil Spending | — | — | Not yet available |
| Accountability | — | — | Not yet available |
| Chronic Absence | — | — | Not yet available |
| EL Progress | — | — | Not yet available |
| Special Ed | — | — | Not yet available |
See DATA-CATEGORY-TAXONOMY.md for what each category covers.
Quick Start
R
# install.packages("devtools")
devtools::install_github("almartin82/tnschooldata")
library(tnschooldata)

# Get 2024 enrollment data (2023-24 school year)
enr_2024 <- fetch_enr(2024)

# Get wide format (one row per school)
enr_wide <- fetch_enr(2024, tidy = FALSE)

# Filter to specific district (Knox County)
knox <- enr_2024 %>%
  dplyr::filter(district_id == "0470")

# Get state totals
state_totals <- enr_2024 %>%
  dplyr::filter(is_state, subgroup == "total_enrollment", grade_level == "TOTAL")
Python
import pytnschooldata as tn

# Fetch 2024 data (2023-24 school year)
enr = tn.fetch_enr(2024)

# Statewide total
total = enr[enr['is_state'] & (enr['grade_level'] == 'TOTAL')]['n_students'].sum()
print(f"{total:,} students")

# Check available years
years = tn.get_available_years()
print(f"Data available: {years['min_year']}-{years['max_year']}")
Explore More
- Full documentation
- Enrollment trends — 15 stories
- Assessment analysis — 15 stories
- Function reference
Data Notes
Data Source
Tennessee Department of Education (TDOE): https://www.tn.gov/education/data.html
Available Years
| Era | Years | Format | Notes |
|---|---|---|---|
| Modern | 2019-2024 | Excel/Report Card | Standardized format via State Report Card system |
| Legacy | 2012-2018 | Excel | Older file structures with varying column names |
| Historical | 1999-2011 | ASR ZIP/Excel | Annual Statistical Report archives (district-level only) |
Total: 26 years of data (1999-2024)
Suppression Rules
Small cell counts (fewer than 10 students) may be suppressed for privacy in some demographic breakdowns.
Known Caveats
- Pre-2011 Demographics: Asian and Pacific Islander were combined
- Pre-2011 Multiracial: Two or more races category not available
- Historical Era (1999-2011): Only district-level enrollment by grade is available (no school-level data, no demographics)
- Charter Schools: Reported as separate districts in some years
- Virtual Schools: Included in district totals
Deeper Dive
4. Tennessee has nearly 1 million public school students
The Volunteer State serves a massive public school population, just shy of the million mark.
statewide <- enr_2024 %>%
  filter(is_state, subgroup == "total_enrollment", grade_level == "TOTAL") %>%
  select(end_year, n_students)

stopifnot(nrow(statewide) > 0)
statewide
#> # A tibble: 1 x 2
#> end_year n_students
#> <int> <dbl>
#> 1 2024 971741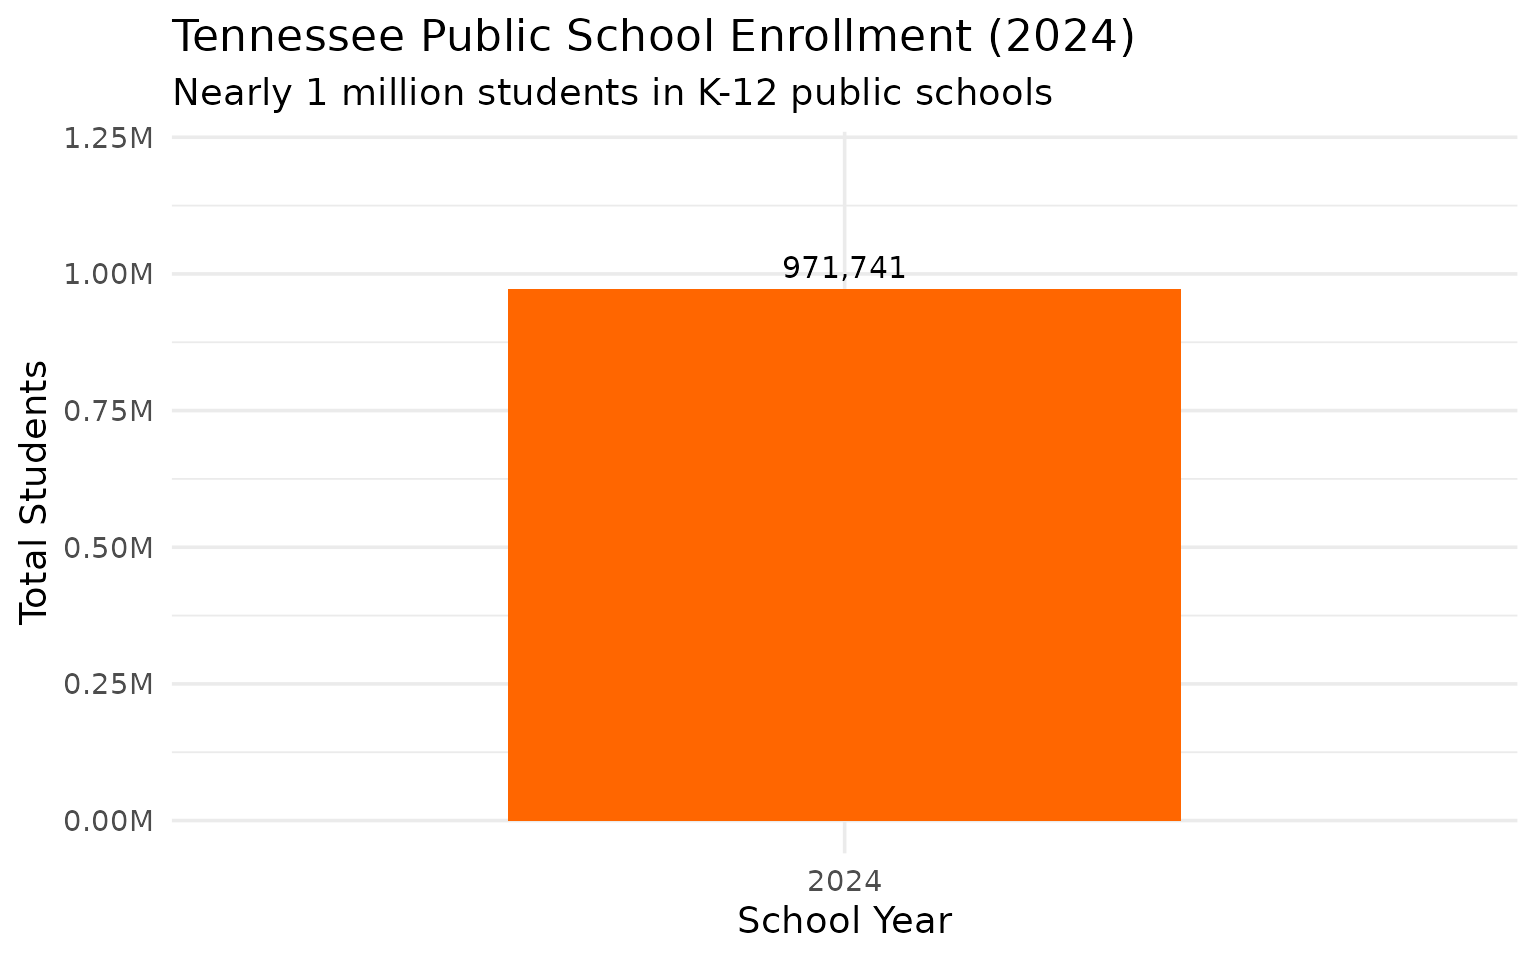
5. Memphis-Shelby County Schools dwarfs all other districts
Memphis’s merged district has more students than Nashville and Knoxville combined.
top_districts <- enr_2024 %>%
  filter(is_district, subgroup == "total_enrollment", grade_level == "TOTAL") %>%
  arrange(desc(n_students)) %>%
  head(10) %>%
  select(district_name, n_students)

stopifnot(nrow(top_districts) == 10)
top_districts
#> # A tibble: 10 x 2
#> district_name n_students
#> <chr> <dbl>
#> 1 Memphis-Shelby County Schools 105202
#> 2 Metro Nashville Public Schools 77334
#> 3 Knox County 58838
#> 4 Rutherford County 50737
#> 5 Hamilton County 44765
#> 6 Williamson County 41307
#> 7 Montgomery County 38641
#> 8 Sumner County 30185
#> 9 Wilson County 20238
#> 10 Sevier County 14146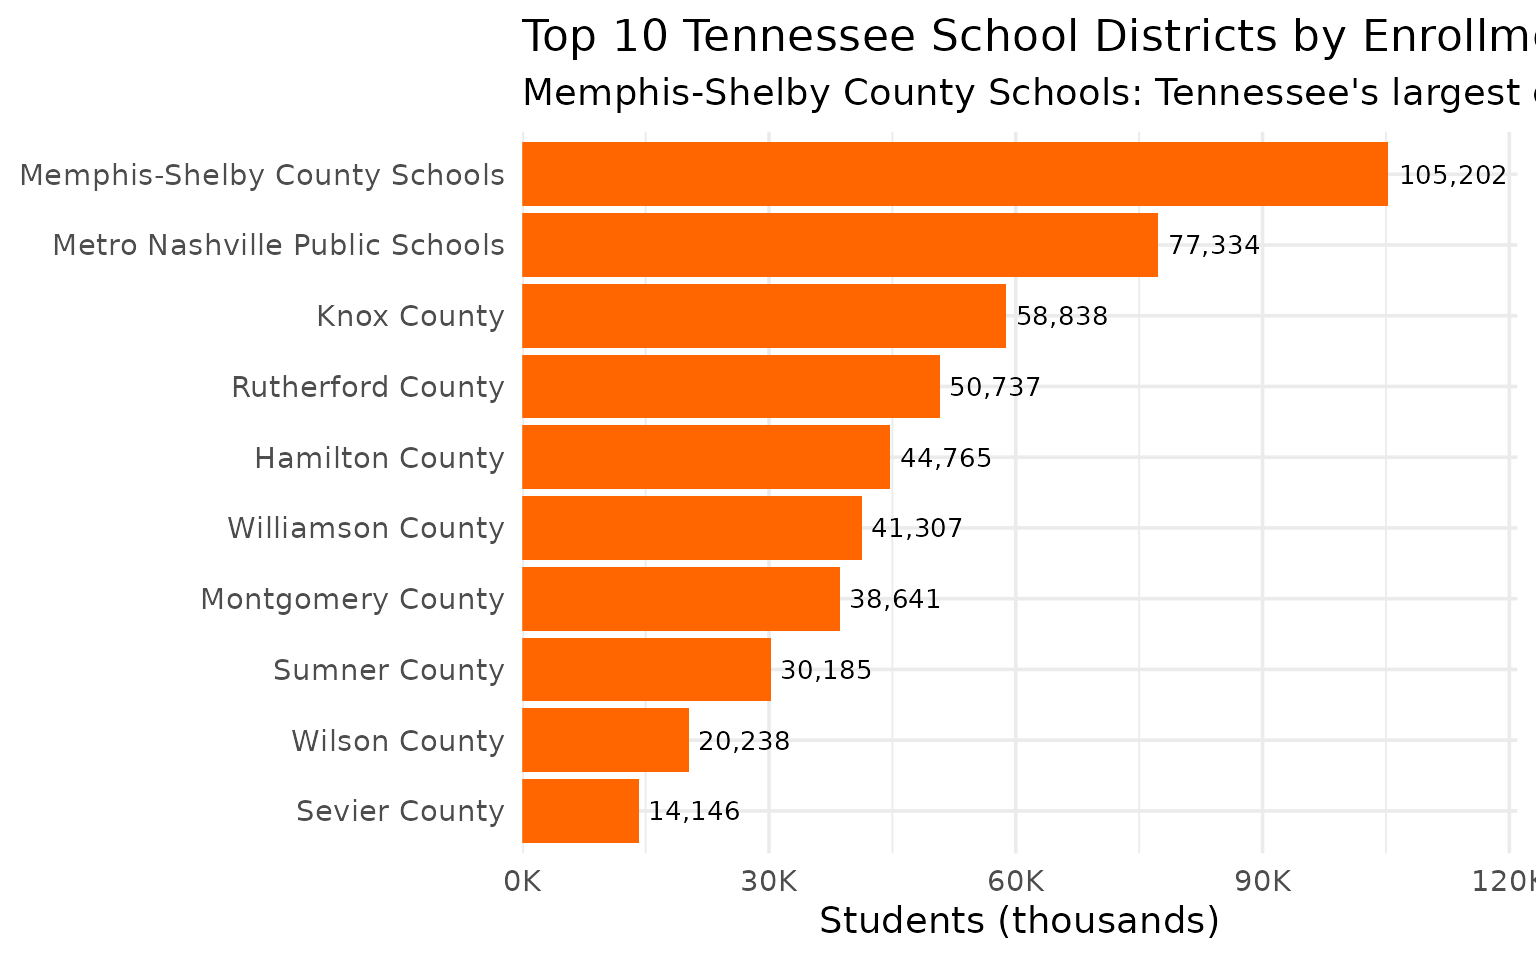
6. Tennessee is 58% White, 24% Black, 15% Hispanic
The state’s student demographics show a substantial minority population.
demographics <- enr_2024 %>%
  filter(is_state, grade_level == "TOTAL",
         subgroup %in% c("white", "black", "hispanic", "asian")) %>%
  select(subgroup, n_students) %>%
  mutate(
    subgroup = factor(subgroup,
      levels = c("white", "black", "hispanic", "asian"),
      labels = c("White", "Black", "Hispanic", "Asian")),
    pct = n_students / sum(n_students) * 100
  )

stopifnot(nrow(demographics) == 4)
demographics
#> # A tibble: 4 x 3
#> subgroup n_students pct
#> <fct> <dbl> <dbl>
#> 1 White 563610 58.0
#> 2 Black 233218 24.0
#> 3 Hispanic 145761 15.0
#> 4 Asian 29152 3.0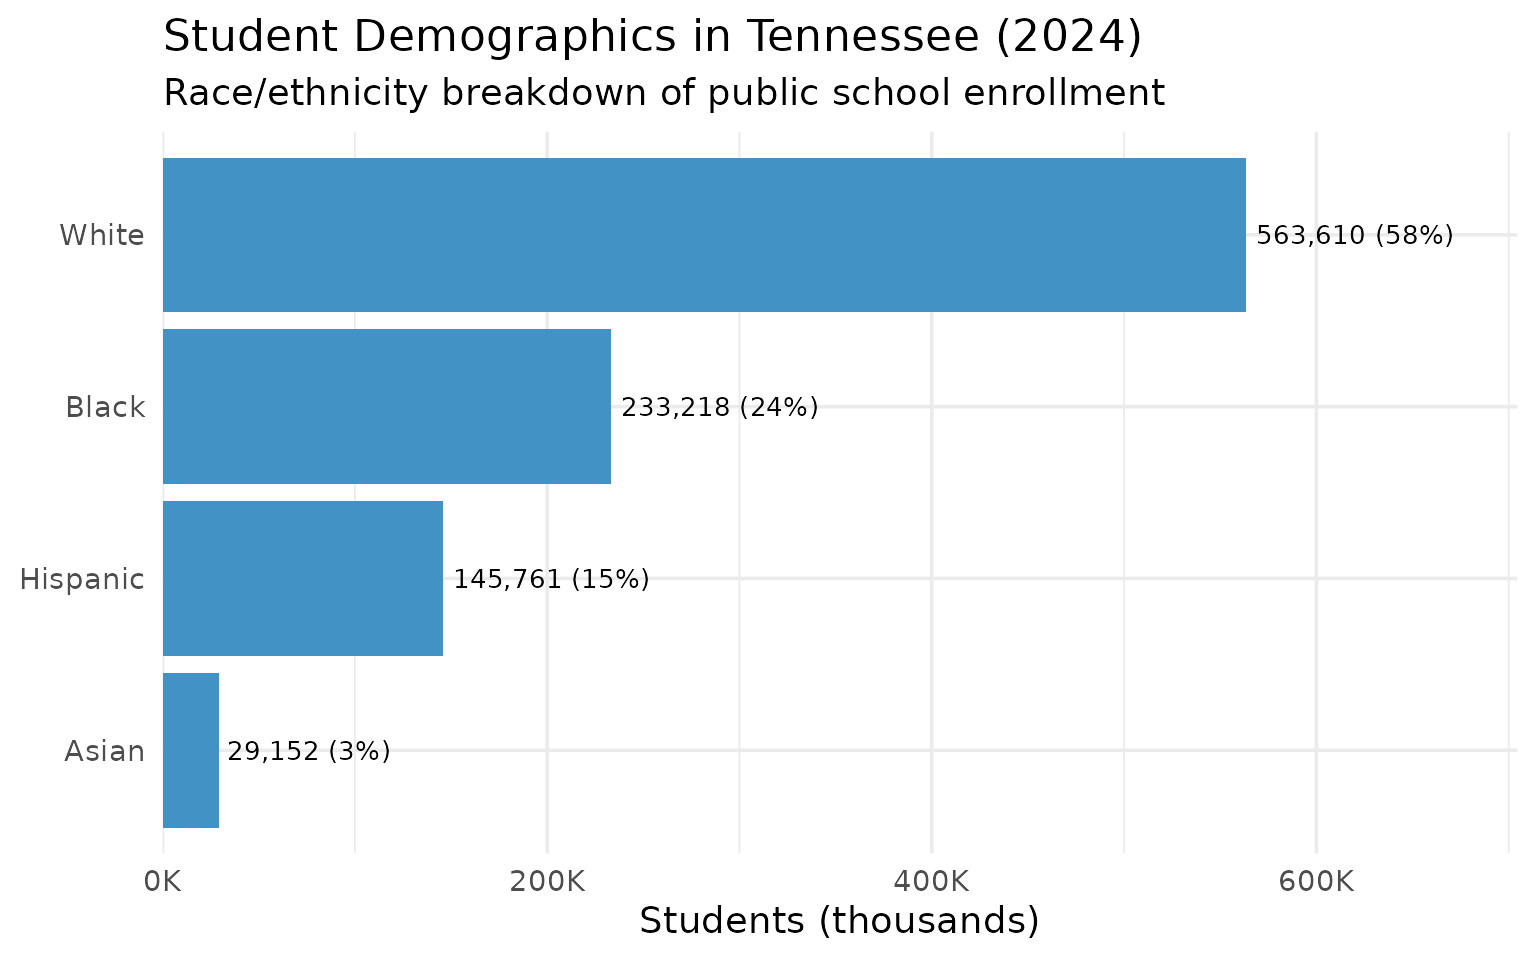
7. Nashville metro anchors Middle Tennessee education
Nashville and its suburban ring serve over 200,000 students.
middle_tn <- c("Metro Nashville", "Williamson", "Rutherford", "Wilson", "Sumner")
memphis_area <- c("Memphis-Shelby")
east_tn <- c("Knox", "Hamilton", "Blount")

regional <- enr_2024 %>%
  filter(is_district, subgroup == "total_enrollment", grade_level == "TOTAL") %>%
  mutate(region = case_when(
    grepl(paste(middle_tn, collapse = "|"), district_name) ~ "Middle TN (Nashville Metro)",
    grepl(paste(memphis_area, collapse = "|"), district_name) ~ "Memphis Area",
    grepl(paste(east_tn, collapse = "|"), district_name) ~ "East TN (Knoxville/Chattanooga)",
    TRUE ~ "Other Districts"
  )) %>%
  group_by(region) %>%
  summarize(total = sum(n_students, na.rm = TRUE), .groups = "drop") %>%
  mutate(pct = total / sum(total) * 100)

stopifnot(nrow(regional) > 0)
regional
#> # A tibble: 4 x 3
#> region total pct
#> <chr> <dbl> <dbl>
#> 1 East TN (Knoxville/Chattanooga) 113599 11.7
#> 2 Memphis Area 105202 10.8
#> 3 Middle TN (Nashville Metro) 219801 22.6
#> 4 Other Districts 533133 54.9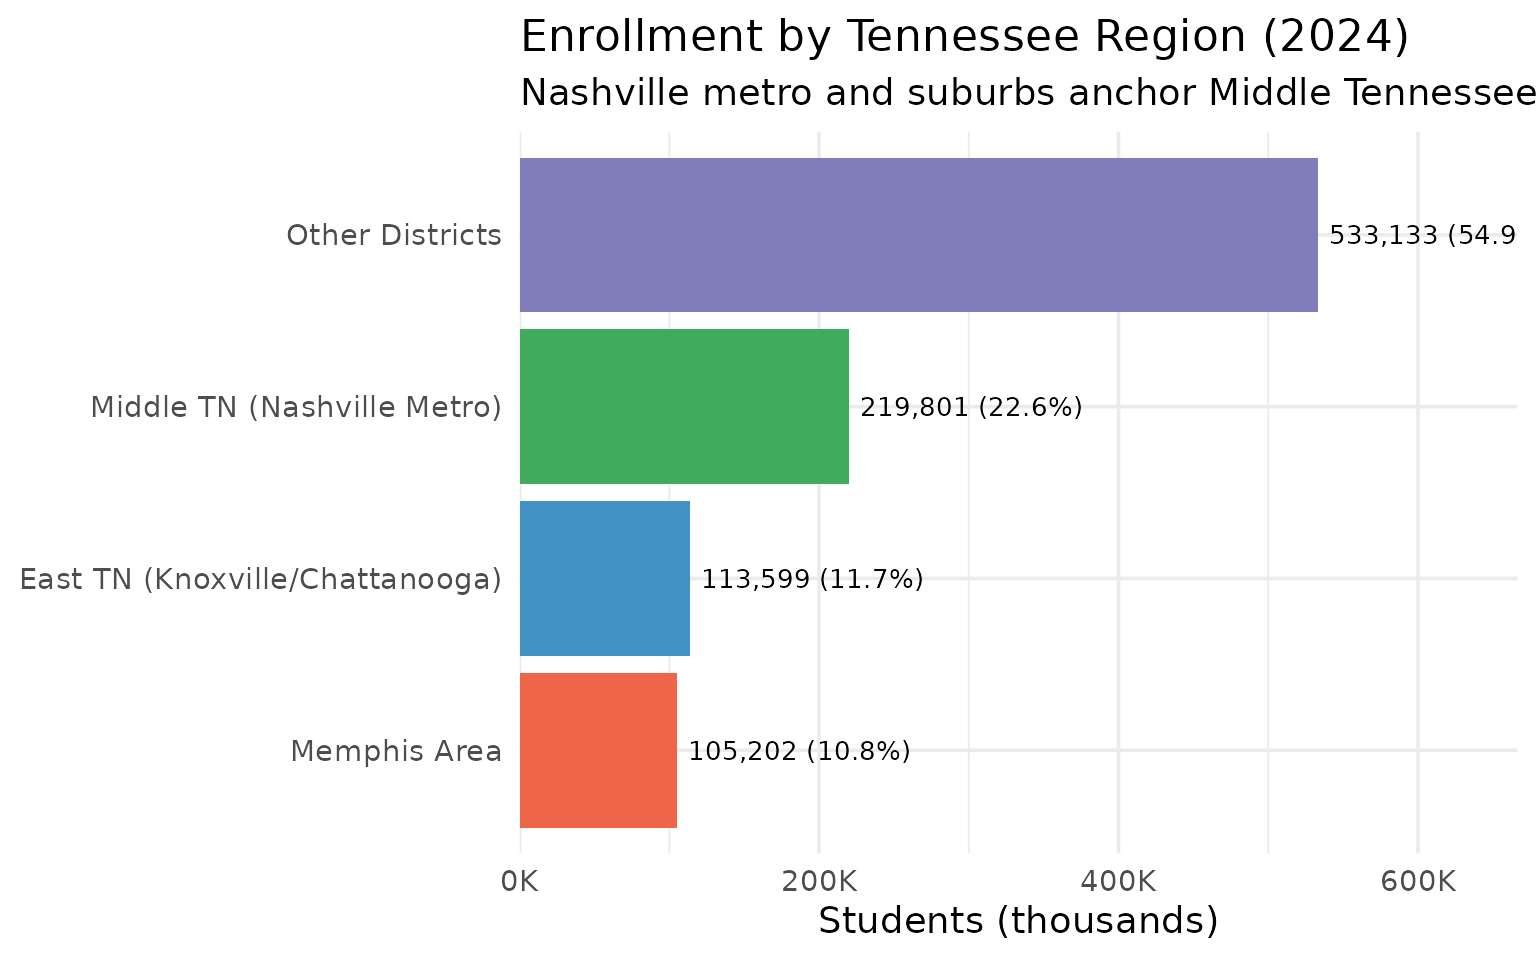
8. Rutherford County leads Tennessee’s suburban boom
Murfreesboro’s district has surpassed Hamilton County as the state’s third-largest.
suburban_districts <- enr_2024 %>%
  filter(is_district, subgroup == "total_enrollment", grade_level == "TOTAL") %>%
  filter(grepl("Williamson|Rutherford|Wilson|Sumner|Montgomery|Hamilton", district_name)) %>%
  select(district_name, n_students) %>%
  arrange(desc(n_students))

stopifnot(nrow(suburban_districts) > 0)
suburban_districts
#> # A tibble: 6 x 2
#> district_name n_students
#> <chr> <dbl>
#> 1 Rutherford County 50737
#> 2 Hamilton County 44765
#> 3 Williamson County 41307
#> 4 Montgomery County 38641
#> 5 Sumner County 30185
#> 6 Wilson County 20238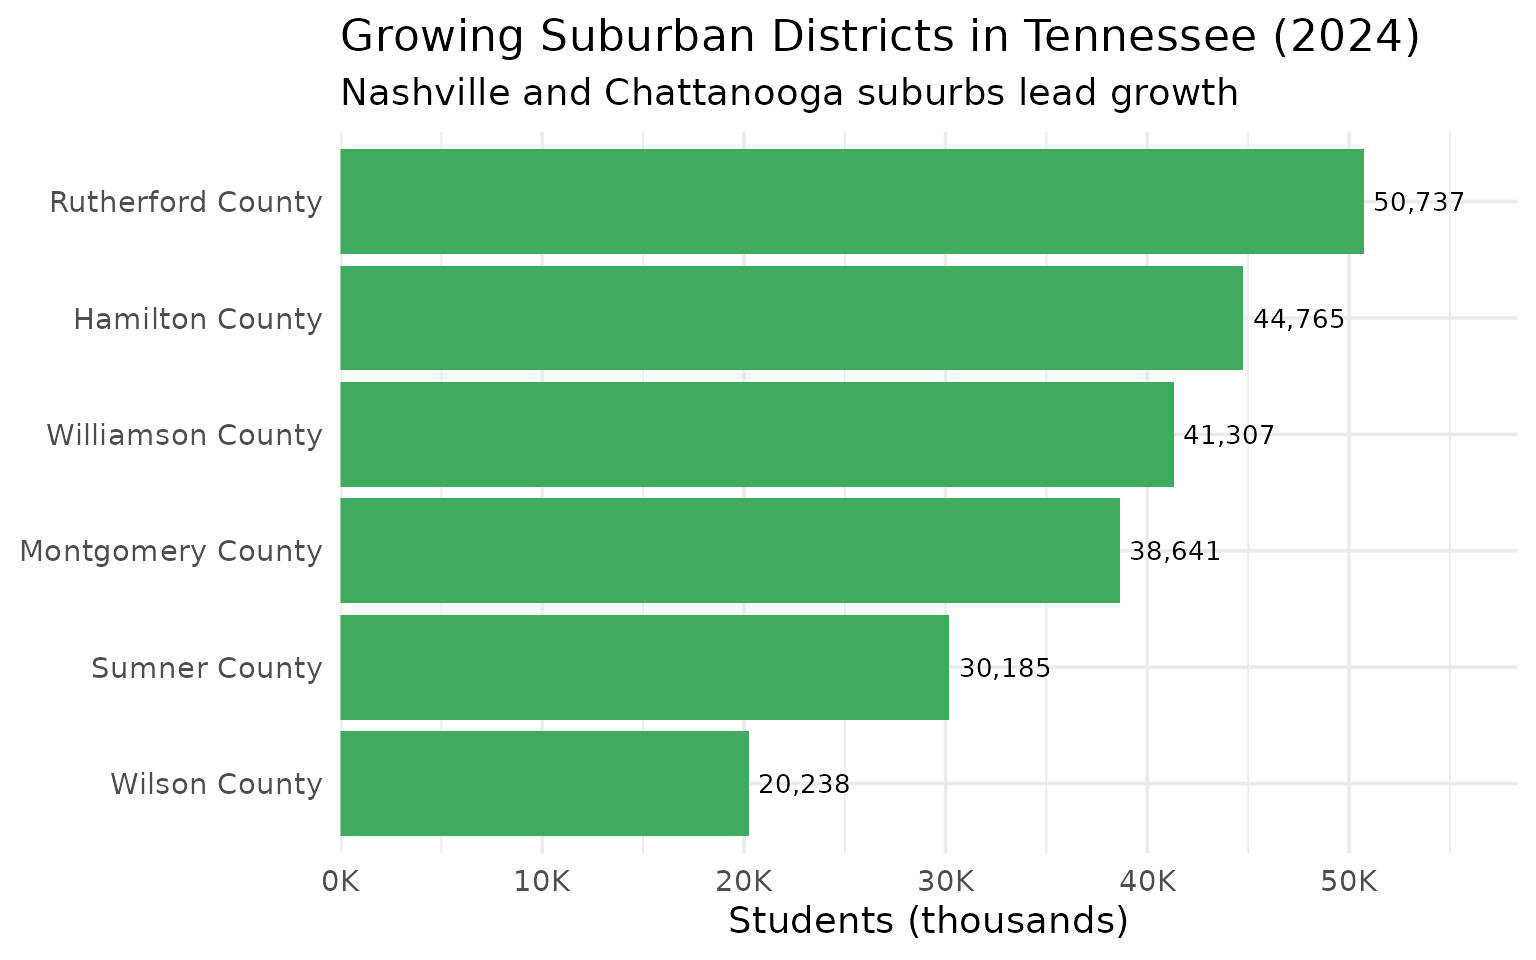
9. Nashville is 29% English Learners – highest in the state
Metro Nashville Public Schools has nearly 3x the state average English Learner rate.
el_data <- enr_2024 %>%
  filter(is_state, grade_level == "TOTAL", subgroup == "lep") %>%
  select(n_students)

stopifnot(nrow(el_data) > 0, total_students > 0)

el_pct <- el_data$n_students / total_students * 100

cat("English Learners:", scales::comma(el_data$n_students),
    "(", round(el_pct, 1), "% of total enrollment)\n")
#> English Learners: 87,457 ( 9 % of total enrollment)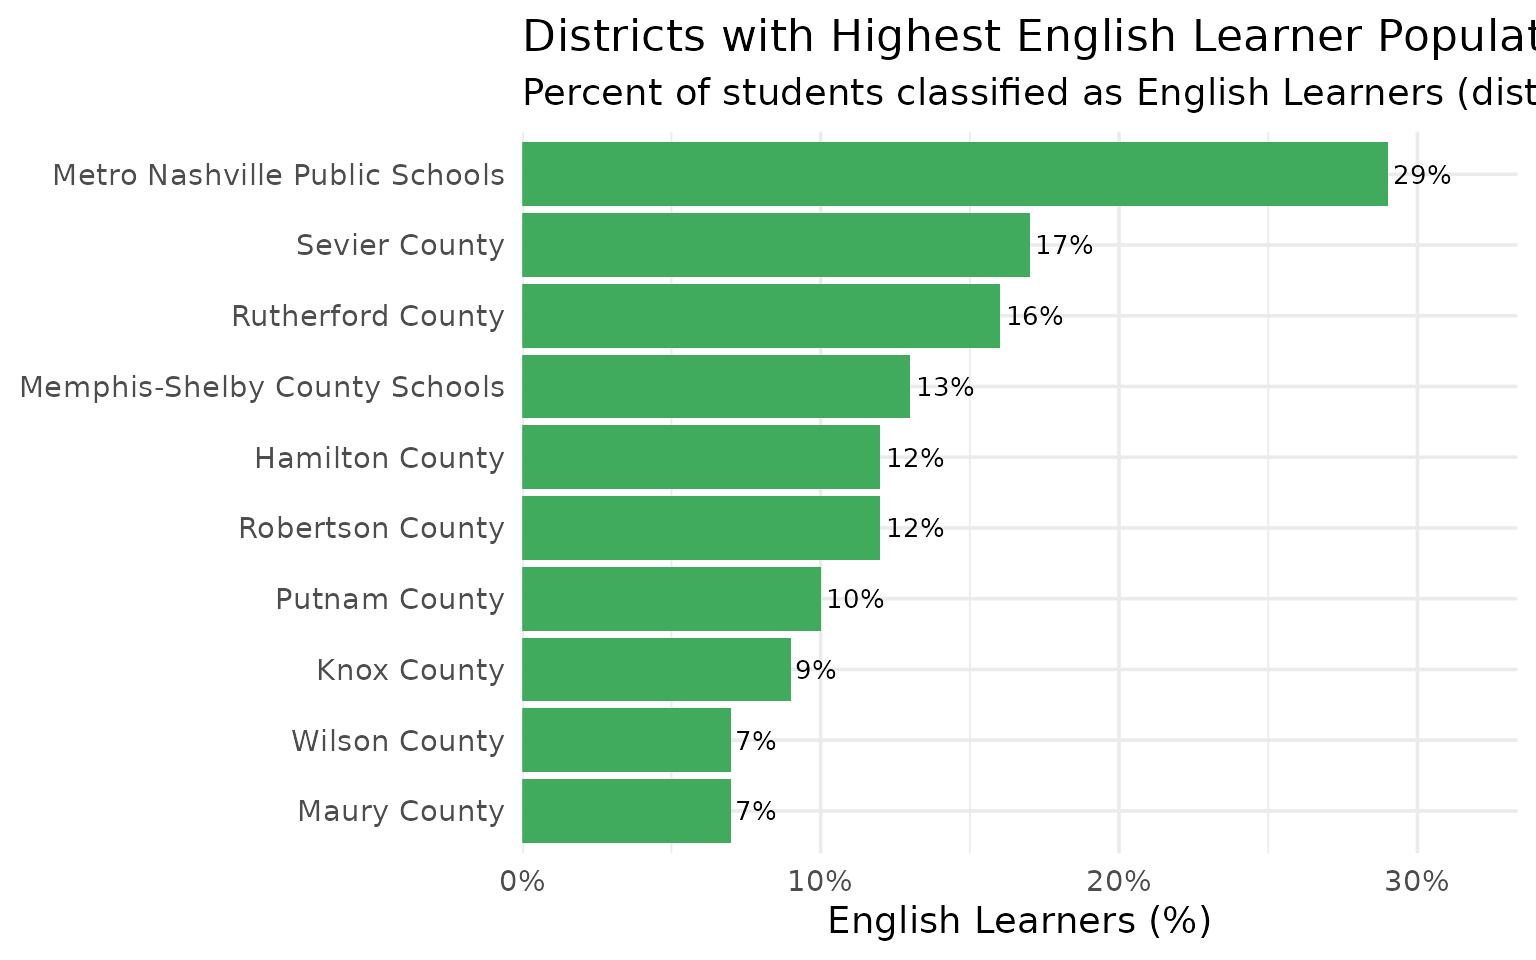
10. Tennessee has over 1,800 school campuses
The state operates a vast network of schools, from tiny rural campuses to suburban mega-schools.
campus_count <- enr_2024 %>%
  filter(is_campus, subgroup == "total_enrollment", grade_level == "TOTAL") %>%
  nrow()

top_campuses <- enr_2024 %>%
  filter(is_campus, subgroup == "total_enrollment", grade_level == "TOTAL") %>%
  arrange(desc(n_students)) %>%
  head(10) %>%
  select(campus_name, district_name, n_students)

stopifnot(campus_count > 0, nrow(top_campuses) == 10)

cat("Total school campuses:", campus_count, "\n")
top_campuses
#> Total school campuses: 1818
#> # A tibble: 10 x 3
#> campus_name district_name n_students
#> <chr> <chr> <dbl>
#> 1 Collierville High School Collierville 2998
#> 2 Bartlett High School Bartlett 2863
#> 3 Stewarts Creek High School Rutherford County 2446
#> 4 Science Hill High School Johnson City 2423
#> 5 Dobyns - Bennett High Sch Kingsport 2351
#> 6 Smyrna High School Rutherford County 2254
#> 7 Blackman High School Rutherford County 2233
#> 8 Cordova High School Memphis-Shelby County Schools 2194
#> 9 Rockvale High School Rutherford County 2178
#> 10 Cookeville High School Putnam County 2175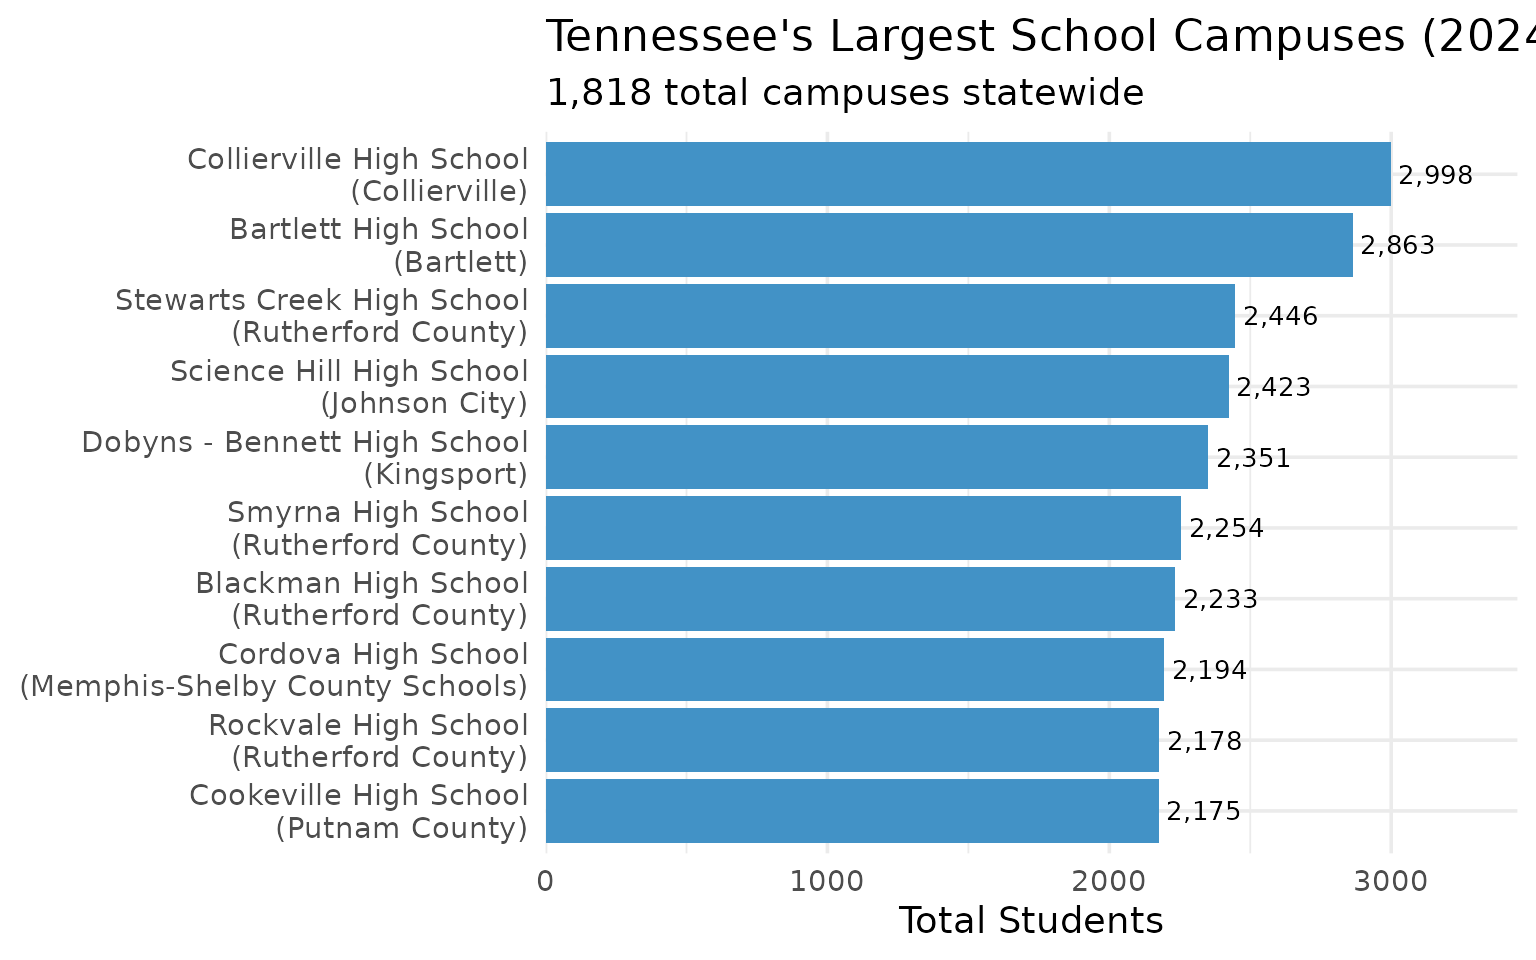
11. 15% of Tennessee students receive special education services
Over 145,000 students receive special education services statewide.
sped_data <- enr_2024 %>%
  filter(is_state, grade_level == "TOTAL", subgroup == "special_ed") %>%
  select(n_students)

stopifnot(nrow(sped_data) > 0)

sped_pct <- sped_data$n_students / total_students * 100

cat("Special Education:", scales::comma(sped_data$n_students),
    "(", round(sped_pct, 1), "% of total enrollment)\n")
#> Special Education: 145,761 ( 15 % of total enrollment)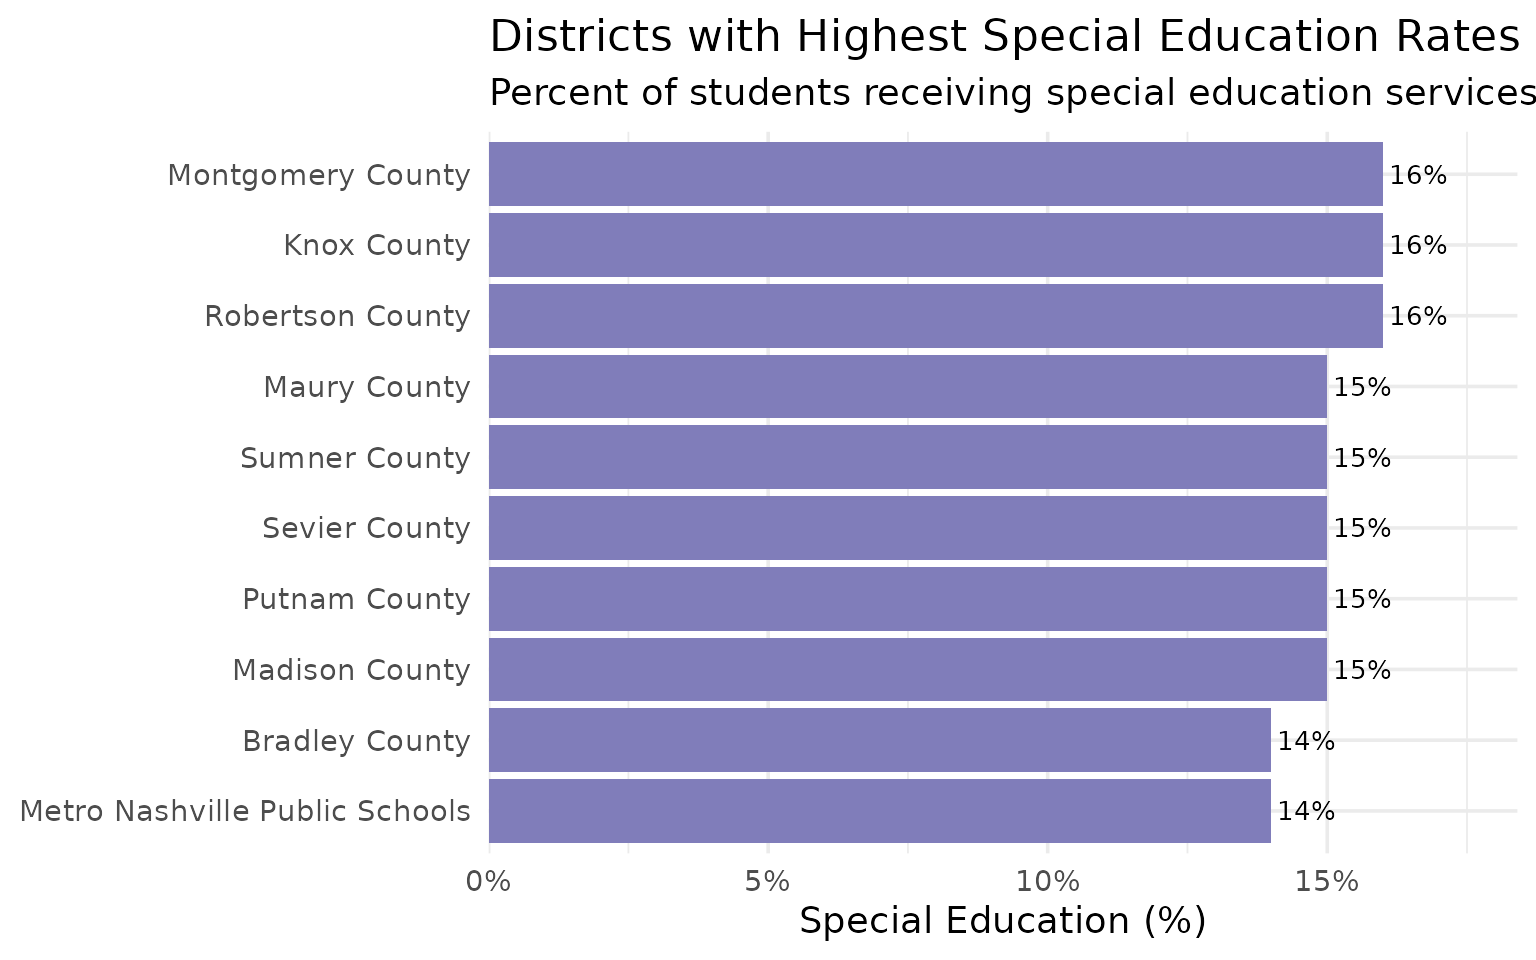
12. Nearly 1 in 3 Tennessee students is economically disadvantaged
About 29% of all students statewide qualify as economically disadvantaged.
econ_data <- enr_2024 %>%
  filter(is_state, grade_level == "TOTAL", subgroup == "econ_disadv") %>%
  select(n_students)

stopifnot(nrow(econ_data) > 0)

econ_pct <- econ_data$n_students / total_students * 100

cat("Economically Disadvantaged:", scales::comma(econ_data$n_students),
    "(", round(econ_pct, 1), "% of total enrollment)\n")
#> Economically Disadvantaged: 281,805 ( 29 % of total enrollment)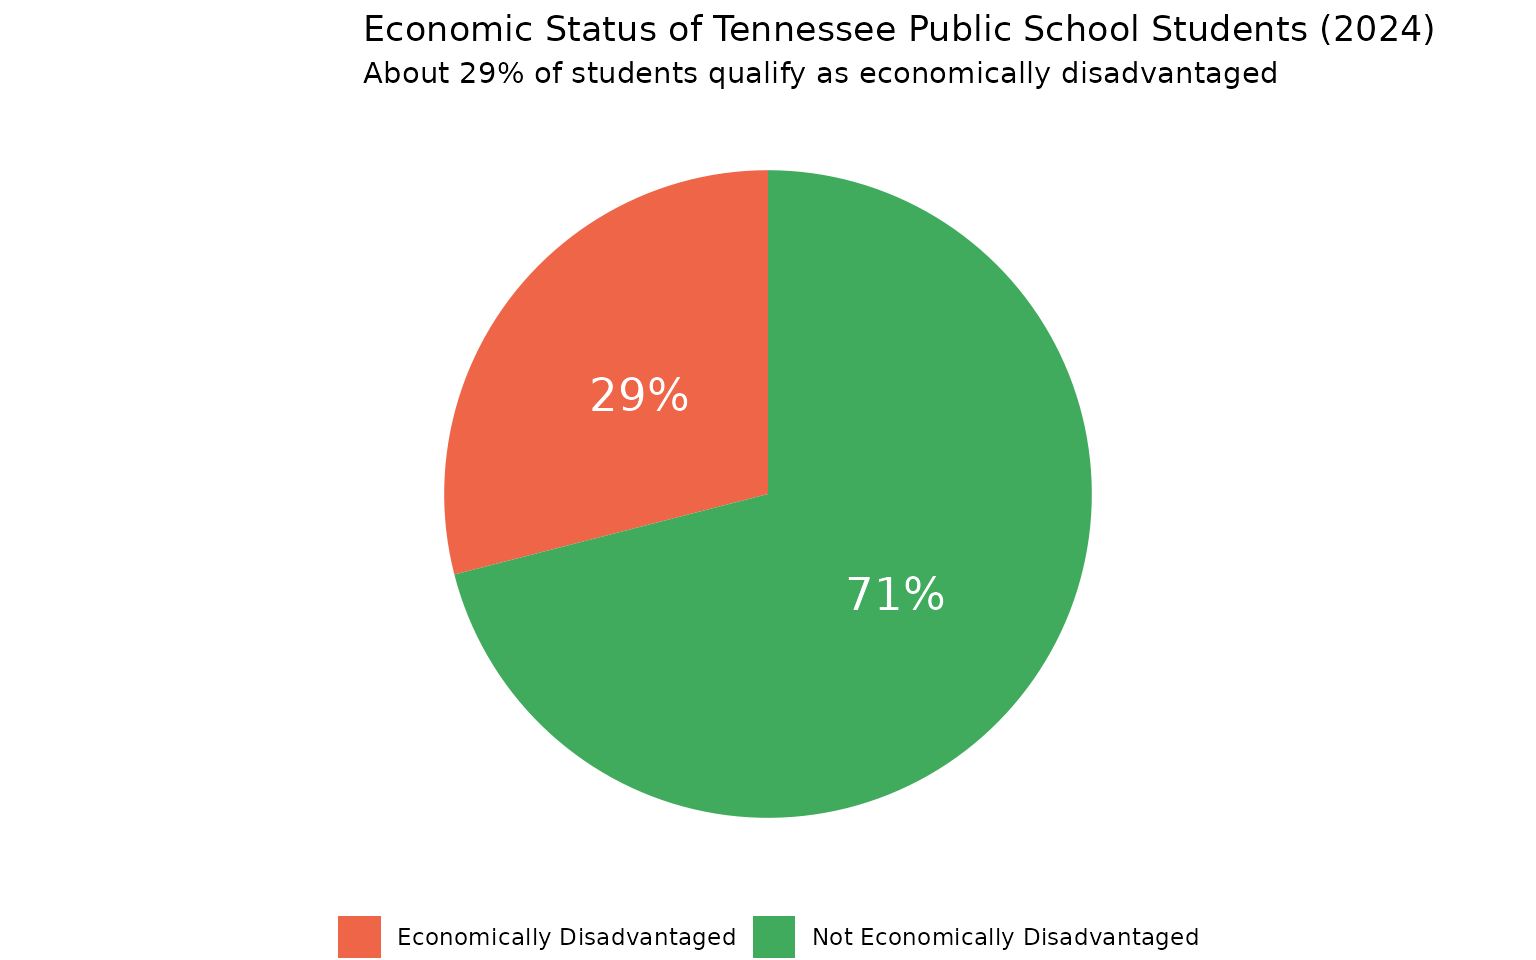
13. Knox County is East Tennessee’s education hub
Knoxville’s district accounts for 37% of all students in the region’s major districts.
knox <- enr_2024 %>%
  filter(is_district, subgroup == "total_enrollment", grade_level == "TOTAL",
         grepl("Knox", district_name)) %>%
  select(district_name, n_students)

stopifnot(nrow(knox) > 0)
knox

east_tn_total <- enr_2024 %>%
  filter(is_district, subgroup == "total_enrollment", grade_level == "TOTAL",
         grepl("Knox|Hamilton|Blount|Anderson|Sevier|Washington|Sullivan|Bradley", district_name)) %>%
  summarize(total = sum(n_students, na.rm = TRUE))

cat("Knox County share of major East TN districts:",
    round(knox$n_students / east_tn_total$total * 100, 1), "%\n")
#> # A tibble: 1 x 2
#> district_name n_students
#> <chr> <dbl>
#> 1 Knox County 58838
#> Knox County share of major East TN districts: 36.9 %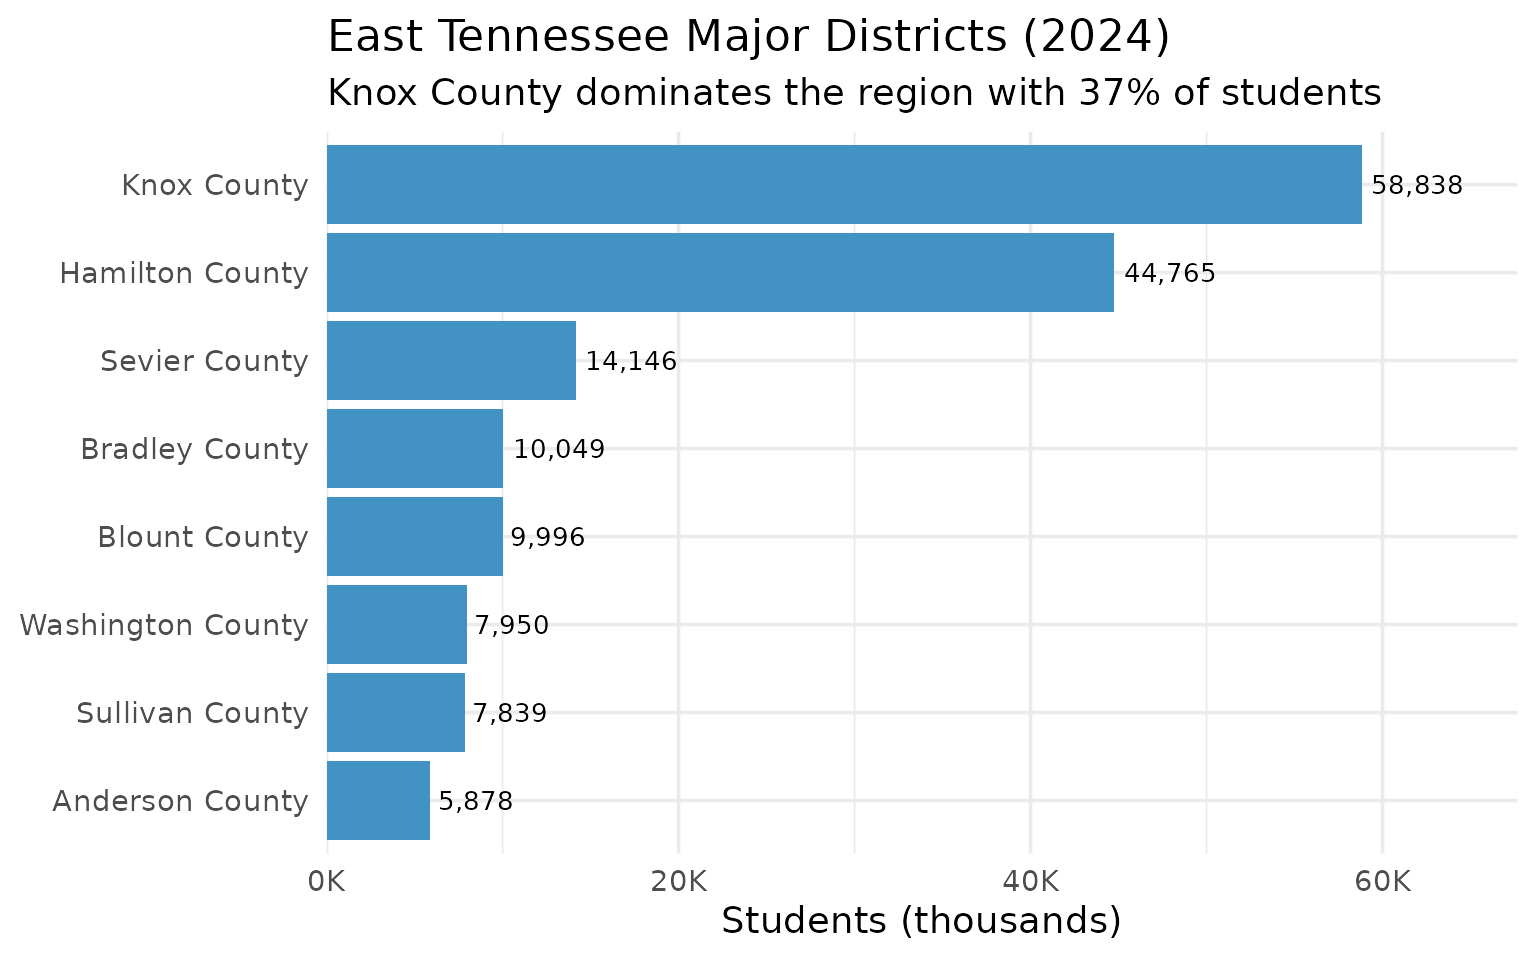
14. Tennessee has 147 school districts with a huge size gap
The median district has just 2,961 students – less than half the 6,610 average – showing extreme concentration.
district_count <- enr_2024 %>%
  filter(is_district, subgroup == "total_enrollment", grade_level == "TOTAL") %>%
  summarize(
    n_districts = n(),
    total_students = sum(n_students, na.rm = TRUE),
    avg_size = mean(n_students, na.rm = TRUE),
    median_size = median(n_students, na.rm = TRUE)
  )

stopifnot(district_count$n_districts > 0)
district_count

cat("Average district size:", scales::comma(round(district_count$avg_size)), "students\n")
cat("Median district size:", scales::comma(round(district_count$median_size)), "students\n")
#> # A tibble: 1 x 4
#> n_districts total_students avg_size median_size
#> <int> <dbl> <dbl> <dbl>
#> 1 147 971735 6610. 2961.
#> Average district size: 6,610 students
#> Median district size: 2,961 students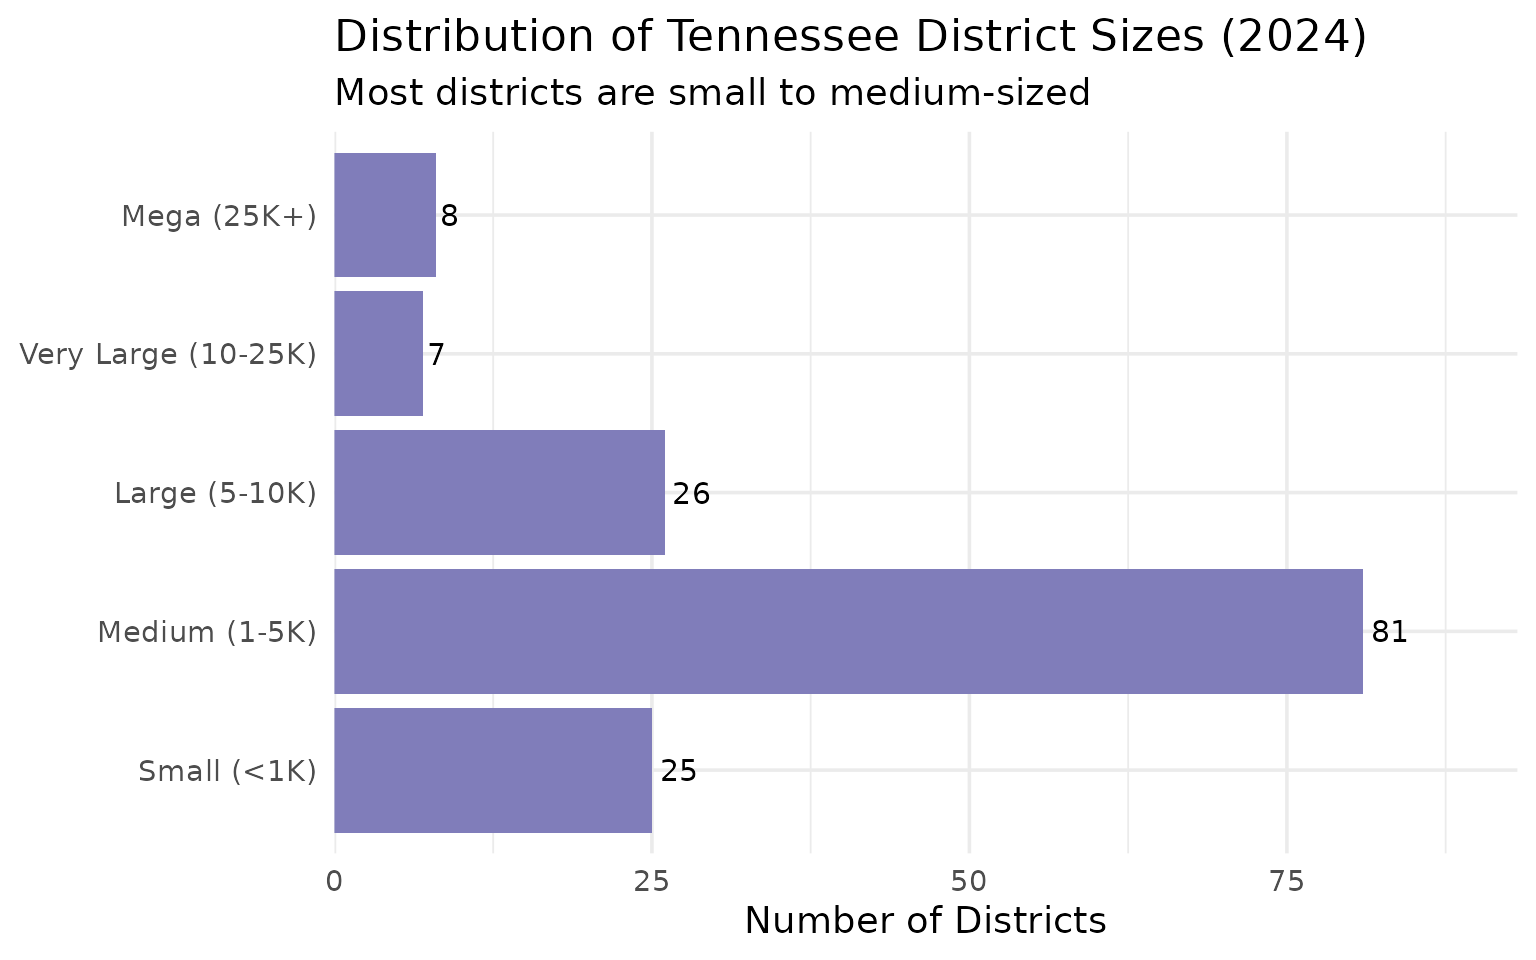
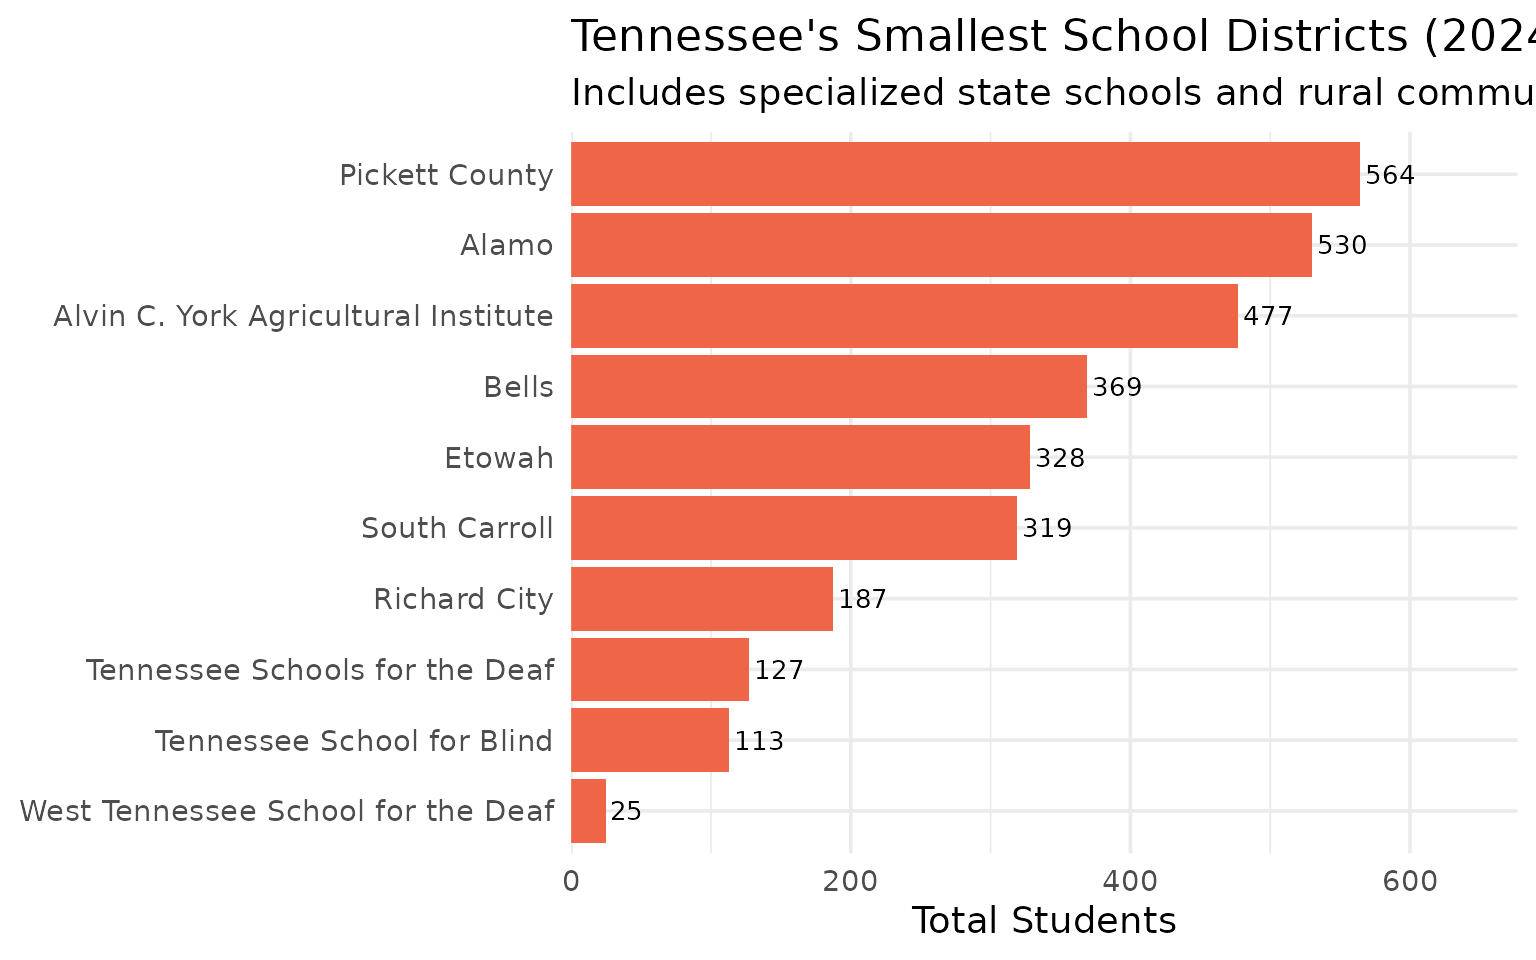
15. Tennessee’s smallest districts serve fewer than 200 students
The state’s tiniest districts include specialized schools and rural communities.
small_districts <- enr_2024 %>%
  filter(is_district, subgroup == "total_enrollment", grade_level == "TOTAL",
         n_students < 2000) %>%
  arrange(n_students) %>%
  head(10) %>%
  select(district_name, n_students)

stopifnot(nrow(small_districts) > 0)
small_districts

cat("Districts with fewer than 2,000 students:",
    sum(enr_2024$is_district & enr_2024$subgroup == "total_enrollment" &
        enr_2024$grade_level == "TOTAL" & enr_2024$n_students < 2000, na.rm = TRUE), "\n")
#> # A tibble: 10 x 2
#> district_name n_students
#> <chr> <dbl>
#> 1 West Tennessee School for the Deaf 25
#> 2 Tennessee School for Blind 113
#> 3 Tennessee Schools for the Deaf 127
#> 4 Richard City 187
#> 5 South Carroll 319
#> 6 Etowah 328
#> 7 Bells 369
#> 8 Alvin C. York Agricultural Institute 477
#> 9 Alamo 530
#> 10 Pickett County 564
#> Districts with fewer than 2,000 students: 50