Georgia’s 1.7 million public school students, 180+ districts, and 14 years of enrollment data – plus Georgia Milestones assessment results – in one package.
Part of the njschooldata family of state education data packages.
Full documentation – all 28 stories with interactive charts, getting-started guide, and complete function reference.
Highlights
1. Asian students lead at 72% ELA proficiency
Racial achievement gaps remain substantial in Georgia, with Asian students at 72% proficiency and Black students at 29%.
# Wide format for some analyses
assess_wide <- fetch_assessment(2024, tidy = FALSE, use_cache = TRUE)
race_gaps <- assess_wide %>%
filter(district_id == "ALL", school_id == "ALL",
subgroup %in% c("All Students", "White", "Black", "Hispanic", "Asian"),
subject == "ELA",
grade == "All") %>%
filter(!is.na(n_tested)) %>%
mutate(pct_proficient = (n_proficient + n_distinguished) / n_tested * 100)
stopifnot(nrow(race_gaps) > 0)
cat("ELA Proficiency by Race/Ethnicity:\n")
print(race_gaps %>% arrange(desc(pct_proficient)) %>% select(subgroup, n_tested, pct_proficient))
#> ELA Proficiency by Race/Ethnicity:
#> # A tibble: 5 x 3
#> subgroup n_tested pct_proficient
#> <chr> <dbl> <dbl>
#> 1 Asian 40321 72.2
#> 2 White 261411 55.0
#> 3 All Students 759126 41.8
#> 4 Hispanic 147351 31.2
#> 5 Black 270916 29.3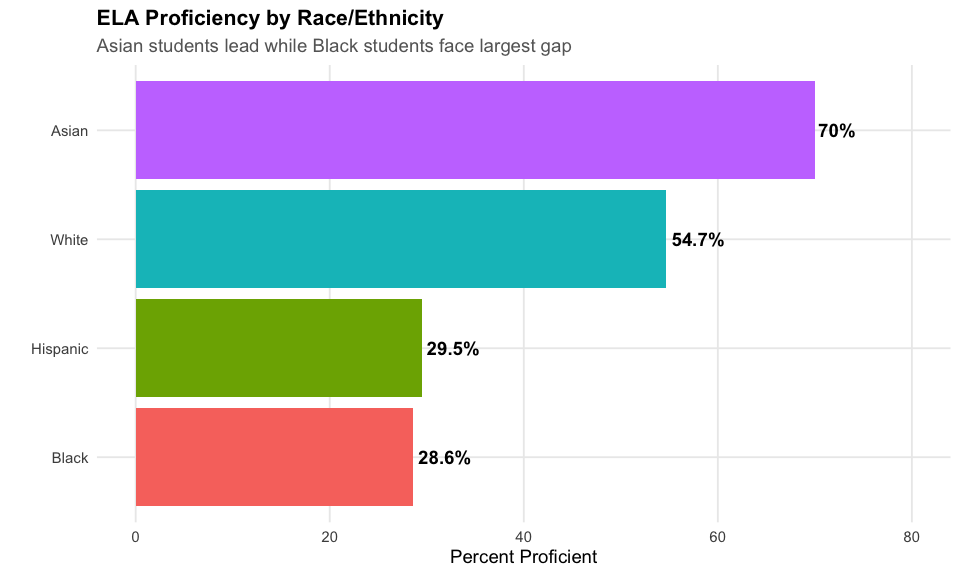
2. Hispanic population surge
Hispanic students have grown from 14% to 19% of Georgia’s student population in just 10 years.
enr_multi <- fetch_enr_multi(c(2015, 2024), use_cache = TRUE)
# Helper for column name changes between years
get_pct_col <- function(df, demo) {
new_col <- paste0("ENROLL_PCT_", toupper(demo))
old_col <- paste0("ENROLL_PERCENT_", toupper(demo))
new_val <- if (new_col %in% names(df)) df[[new_col]] else NA_character_
old_val <- if (old_col %in% names(df)) df[[old_col]] else NA_character_
dplyr::coalesce(new_val, old_val)
}
demo_trends <- lapply(c(2015, 2024), function(yr) {
d <- enr_multi[enr_multi$end_year == yr & enr_multi$DETAIL_LVL_DESC == "State", ]
data.frame(
end_year = yr,
hispanic = as.numeric(get_pct_col(d, "hispanic")),
white = as.numeric(get_pct_col(d, "white")),
black = as.numeric(get_pct_col(d, "black")),
asian = as.numeric(get_pct_col(d, "asian"))
)
})
demo_df <- do.call(rbind, demo_trends)
stopifnot(nrow(demo_df) > 0)
cat("Hispanic enrollment share:\n")
cat(" 2015:", demo_df$hispanic[1], "%\n")
cat(" 2024:", demo_df$hispanic[2], "%\n")
#> Hispanic enrollment share:
#> 2015: 14 %
#> 2024: 19 %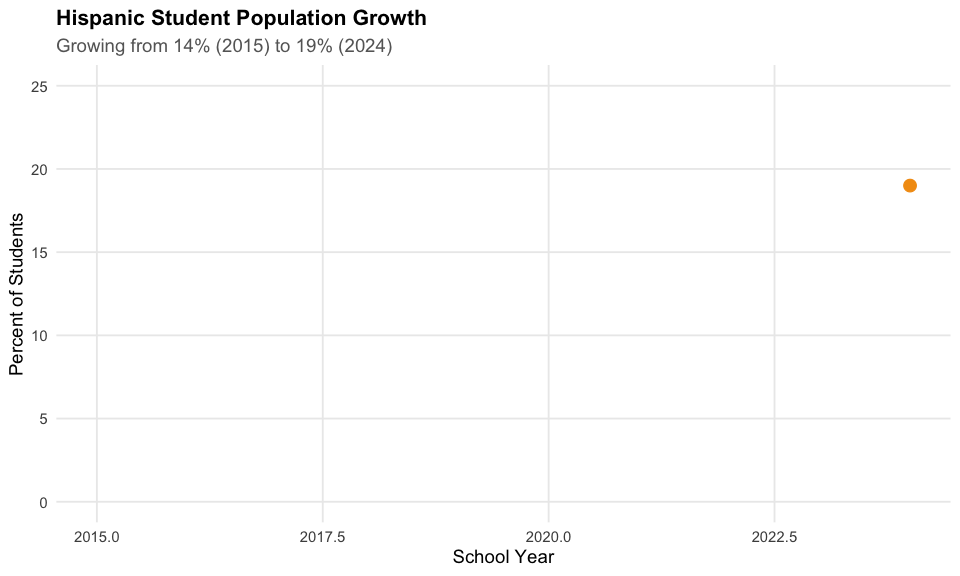
3. Fewer than half of Georgia students are proficient in ELA
Statewide proficiency remains a challenge, with fewer than half of students meeting grade-level standards in English Language Arts.
# Wide format for some analyses
assess_wide <- fetch_assessment(2024, tidy = FALSE, use_cache = TRUE)
# State-level proficiency for All Students, ELA, All Grades
# Filter to state aggregate row (district_id == "ALL", school_id == "ALL")
ela_state <- assess_wide %>%
filter(district_id == "ALL", school_id == "ALL",
subgroup == "All Students",
subject == "ELA",
grade == "All") %>%
filter(!is.na(n_tested))
stopifnot(nrow(ela_state) > 0)
ela_state <- ela_state %>%
mutate(
n_prof_dist = n_proficient + n_distinguished,
pct_proficient = n_prof_dist / n_tested * 100
)
cat("State ELA Proficiency (All Students):\n")
cat(" Students tested:", format(ela_state$n_tested, big.mark = ","), "\n")
cat(" Percent proficient or distinguished:", round(ela_state$pct_proficient, 1), "%\n")
#> State ELA Proficiency (All Students):
#> Students tested: 759,126
#> Percent proficient or distinguished: 41.8 %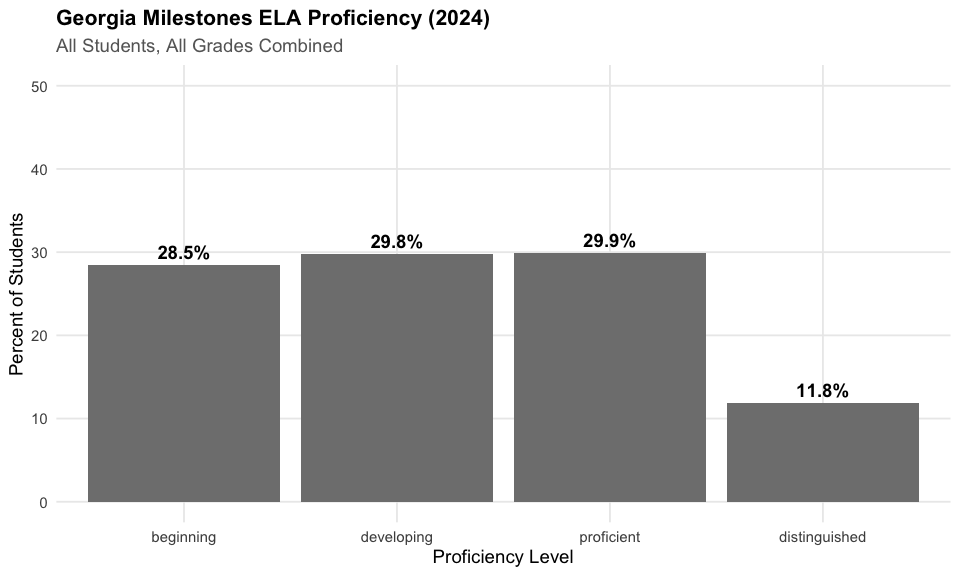
Data Taxonomy
| Category | Years | Function | Details |
|---|---|---|---|
| Enrollment | 2011-2024 |
fetch_enr() / fetch_enr_multi()
|
State, district, school. Race, gender, EL, SpEd, econ disadv |
| Assessments | 2015-2024 |
fetch_assessment() / fetch_eog() / fetch_eoc()
|
State, district, school. EOG grades 3-8, EOC high school. Race, gender, econ disadv, SWD, EL |
| Graduation | – | – | Not yet available |
| Directory | Current | fetch_directory() |
School-level. Principal name, address, phone, grades served, facility type |
| Per-Pupil Spending | – | – | Not yet available |
| Accountability | – | – | Not yet available |
| Chronic Absence | – | – | Not yet available |
| EL Progress | – | – | Not yet available |
| Special Ed | – | – | Not yet available |
See the full data category taxonomy
Quick Start
R
# install.packages("remotes")
remotes::install_github("almartin82/gaschooldata")
library(gaschooldata)
library(dplyr)
# Fetch enrollment data
enr_2024 <- fetch_enr(2024, use_cache = TRUE)
# Fetch multiple years
enr_recent <- fetch_enr_multi(2020:2024, use_cache = TRUE)
# State totals
enr_2024 %>%
filter(DETAIL_LVL_DESC == "State")
# District breakdown
enr_2024 %>%
filter(DETAIL_LVL_DESC == "District") %>%
select(SCHOOL_DSTRCT_NM, ENROLL_PCT_WHITE, ENROLL_PCT_BLACK, ENROLL_PCT_HISPANIC)
# Fetch assessment data (Georgia Milestones)
assess_2024 <- fetch_assessment(2024, use_cache = TRUE)
# EOG (End of Grade) tests - grades 3-8
eog_2024 <- fetch_eog(2024, use_cache = TRUE)
# EOC (End of Course) exams - high school
eoc_2024 <- fetch_eoc(2024, use_cache = TRUE)
# State proficiency (filter to state-level aggregate)
assess_wide <- fetch_assessment(2024, tidy = FALSE, use_cache = TRUE)
assess_wide %>%
filter(district_id == "ALL", school_id == "ALL",
subgroup == "All Students", subject == "ELA", grade == "All")Python
import pygaschooldata as ga

# See available years
years = ga.get_available_years()
print(f"Data available from {years['min_year']} to {years['max_year']}")

# Fetch enrollment data
enr_2024 = ga.fetch_enr(2024)

# Fetch multiple years
enr_multi = ga.fetch_enr_multi([2020, 2021, 2022, 2023, 2024])

# State totals
state_total = enr_2024[enr_2024['DETAIL_LVL_DESC'] == 'State']

# District breakdown
districts = enr_2024[enr_2024['DETAIL_LVL_DESC'] == 'District']

# Fetch assessment data
assess_2024 = ga.fetch_assessment(2024)

# EOG and EOC separately
eog_2024 = ga.fetch_eog(2024)
eoc_2024 = ga.fetch_eoc(2024)
Explore More
Full analysis with 28 stories:
- Enrollment trends – 15 stories
- Assessment trends – 13 stories
- Function reference
Data Notes
Data Source
All data is sourced directly from the Georgia Governor’s Office of Student Achievement (GOSA) downloadable data repository at download.gosa.ga.gov. This package does NOT use federal data sources like NCES CCD or Urban Institute APIs.
Available Years
Enrollment: 2011-2024 (school years 2010-11 through 2023-24). Grade-level enrollment data is only available for 2023 and later; earlier years include only demographic subgroup data.
Assessment: 2015-2024 (Georgia Milestones began spring 2015, replacing CRCT). No assessment data for 2020 due to COVID-19 pandemic testing waiver.
Reporting Period
Georgia reports enrollment based on FTE (Full-Time Equivalent) counts: - Fall enrollment: October FTE count - Spring enrollment: March FTE count (within the same fiscal year)
This package primarily uses fall enrollment data.
Georgia Milestones assessments are administered in spring.
Suppression Rules
GOSA uses “TFS” (Too Few Students) to indicate suppressed values when student counts are too small to report for privacy reasons. The package converts TFS values to NA when parsing numeric columns.
Assessment Proficiency Levels
Georgia Milestones uses four proficiency levels: 1. Beginning Learner: Does not yet demonstrate proficiency 2. Developing Learner: Demonstrates partial proficiency 3. Proficient Learner: Demonstrates proficiency in grade-level content 4. Distinguished Learner: Demonstrates advanced proficiency
Known Data Quality Issues
-
File naming timestamps: GOSA appends timestamps to file names (e.g.,
Enrollment_by_Subgroup_Metrics_2023-24_2025-06-17_15_15_26.csv). The package scrapes directory listings to find the most recent file. - Column name changes: Older files (2015-2022) use different column naming conventions than newer files (2023+). The package handles both formats.
- Grade data availability: Grade-level enrollment counts (Pre-K through 12th grade) are only available for 2023 and later years.
- Assessment year gap: 2020 assessment data is unavailable due to COVID-19 pandemic testing cancellations.
- Assessment entity levels: The wide assessment data includes state (district_id=“ALL”, school_id=“ALL”), district (school_id=“ALL”), and school-level rows. Always filter to the appropriate level to avoid double-counting.
Deeper Dive
4. COVID hit kindergarten hardest
Kindergarten enrollment dropped sharply during the pandemic and hasn’t fully recovered – 6,000 fewer kindergartners than 1st graders.
enr_2024 <- fetch_enr(2024, use_cache = TRUE)

state <- enr_2024 %>% filter(DETAIL_LVL_DESC == "State")

k_count <- as.numeric(state$GRADE_K)
first_count <- as.numeric(state$GRADE_1st)

stopifnot(!is.na(k_count), k_count > 0)

cat("Kindergarten:", format(k_count, big.mark = ","), "\n")
cat("vs 1st grade:", format(first_count, big.mark = ","), "\n")
cat("Difference:", format(first_count - k_count, big.mark = ","), "fewer K students\n")
#> Kindergarten: 118,820
#> vs 1st grade: 124,922
#> Difference: 6,102 fewer K students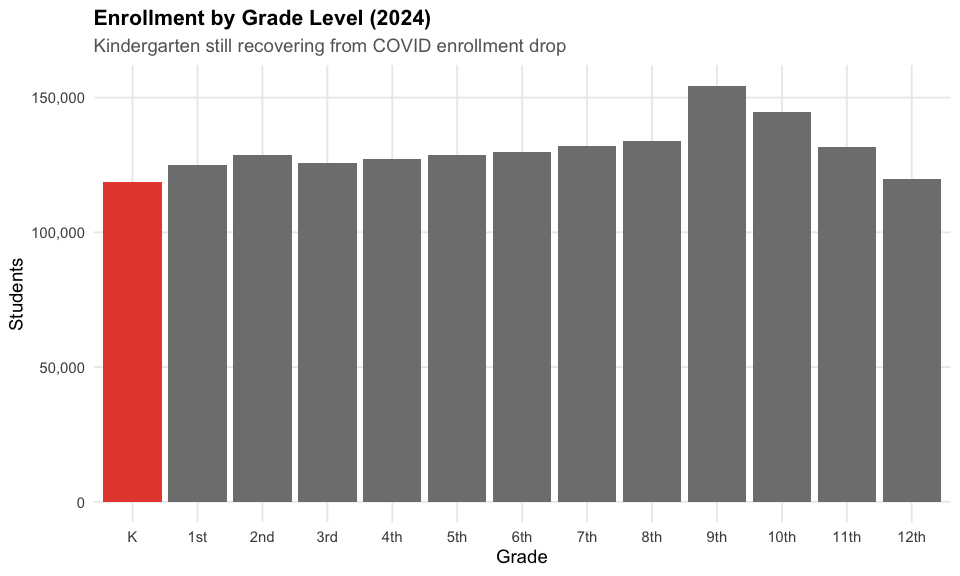
5. Georgia demographics transformation
White students have declined from 42% to 35% while Hispanic and multiracial students have increased.
cat("Demographics 2015 vs 2024:\n")
cat("  White:", demo_df$white[1], "% ->", demo_df$white[2], "%\n")
cat("  Black:", demo_df$black[1], "% ->", demo_df$black[2], "%\n")
cat("  Hispanic:", demo_df$hispanic[1], "% ->", demo_df$hispanic[2], "%\n")
#> Demographics 2015 vs 2024:
#>   White: 42 % -> 35 %
#>   Black: 37 % -> 36 %
#>   Hispanic: 14 % -> 19 %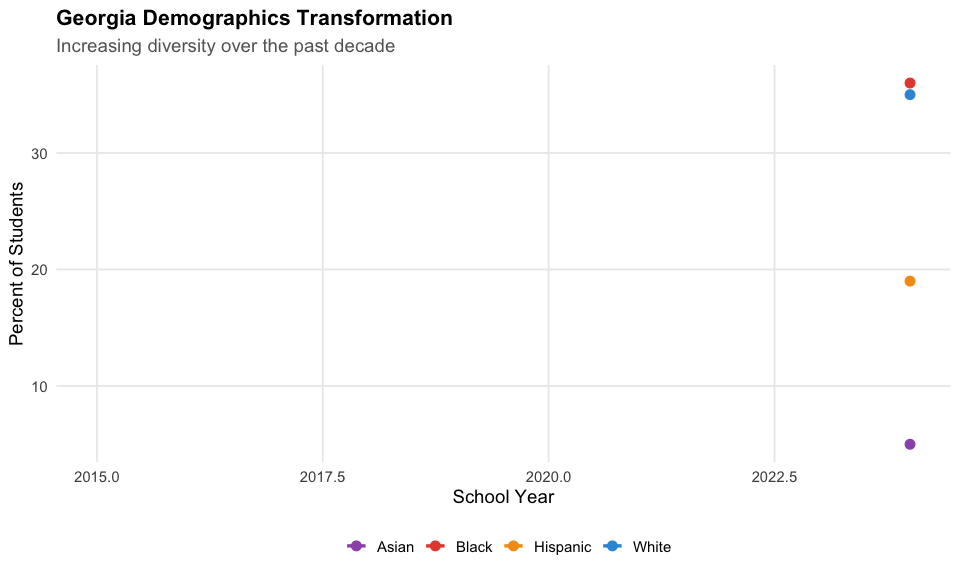
6. Gwinnett County is Georgia’s school system giant
Gwinnett County serves over 180,000 students, making it the largest district in Georgia and one of the largest in the nation.
# Helper to calculate total enrollment from grade columns
calc_total <- function(df) {
  grade_cols <- grep("^GRADE_", names(df), value = TRUE)
  if (length(grade_cols) == 0) return(rep(NA_real_, nrow(df)))
  mat <- sapply(grade_cols, function(col) suppressWarnings(as.numeric(df[[col]])))
  if (is.null(dim(mat))) {
    # Single row: mat is a named vector
    return(sum(mat, na.rm = TRUE))
  }
  rowSums(mat, na.rm = TRUE)
}

# Top 10 districts by enrollment
top_districts <- enr_2024 %>%
  filter(DETAIL_LVL_DESC == "District") %>%
  mutate(total = calc_total(.)) %>%
  filter(total > 0) %>%
  arrange(desc(total)) %>%
  head(10) %>%
  mutate(district_label = reorder(SCHOOL_DSTRCT_NM, total))

stopifnot(nrow(top_districts) > 0)

cat("Top 5 districts by enrollment:\n")
print(top_districts %>% select(SCHOOL_DSTRCT_NM, total) %>% head(5))
#> Top 5 districts by enrollment:
#> # A tibble: 5 x 2
#>   SCHOOL_DSTRCT_NM  total
#>   <chr>             <dbl>
#> 1 Gwinnett County  180556
#> 2 Cobb County      105510
#> 3 DeKalb County     88326
#> 4 Fulton County     85970
#> 5 Forsyth County    54565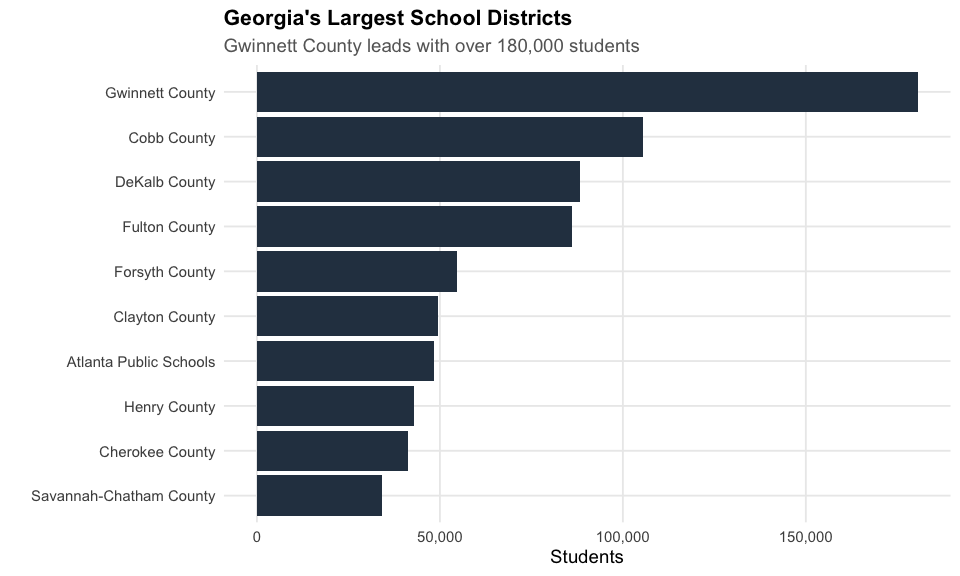
7. Economically disadvantaged majority at 64%
64% of Georgia students are classified as economically disadvantaged.
state_ed <- enr_2024 %>% filter(DETAIL_LVL_DESC == "State")
ed_pct <- as.numeric(get_pct_col(state_ed, "ed"))

stopifnot(!is.na(ed_pct))

cat("Economically disadvantaged:", ed_pct, "%\n")
#> Economically disadvantaged: 64 %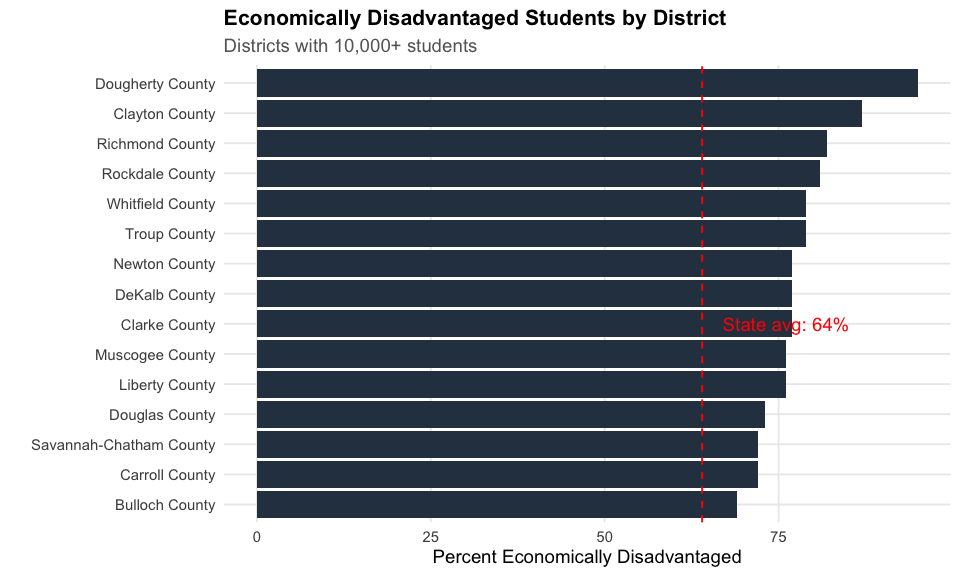
8. English Learners exceed 12% of enrollment
Over 12% of Georgia students are English Learners, with concentrations in metro Atlanta.
state_row_el <- enr_2024 %>% filter(DETAIL_LVL_DESC == "State")
lep_pct <- as.numeric(get_pct_col(state_row_el, "lep"))

stopifnot(!is.na(lep_pct))

cat("English Learner percentage:", lep_pct, "%\n")
#> English Learner percentage: 12 %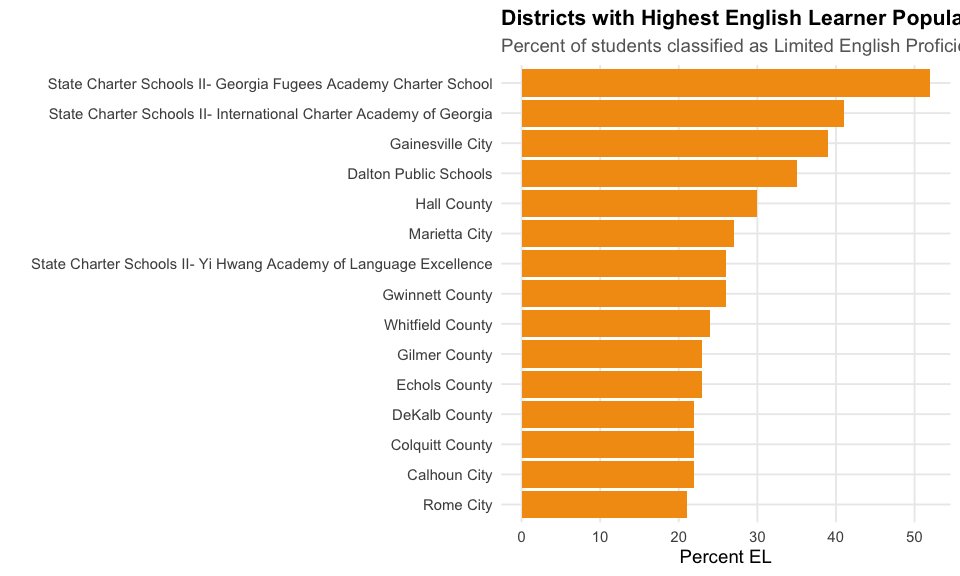
9. Over 155 districts serve fewer than 5,000 students
Small rural districts dominate Georgia’s landscape – more than 155 of the state’s roughly 200 districts serve under 5,000 students each.
# Find small districts (under 5000 students)
small_districts <- enr_2024 %>%
  filter(DETAIL_LVL_DESC == "District") %>%
  mutate(total = calc_total(.)) %>%
  filter(total > 0, total < 5000)

stopifnot(nrow(small_districts) > 0)

cat("Districts with fewer than 5,000 students:", nrow(small_districts), "\n")
#> Districts with fewer than 5,000 students: 155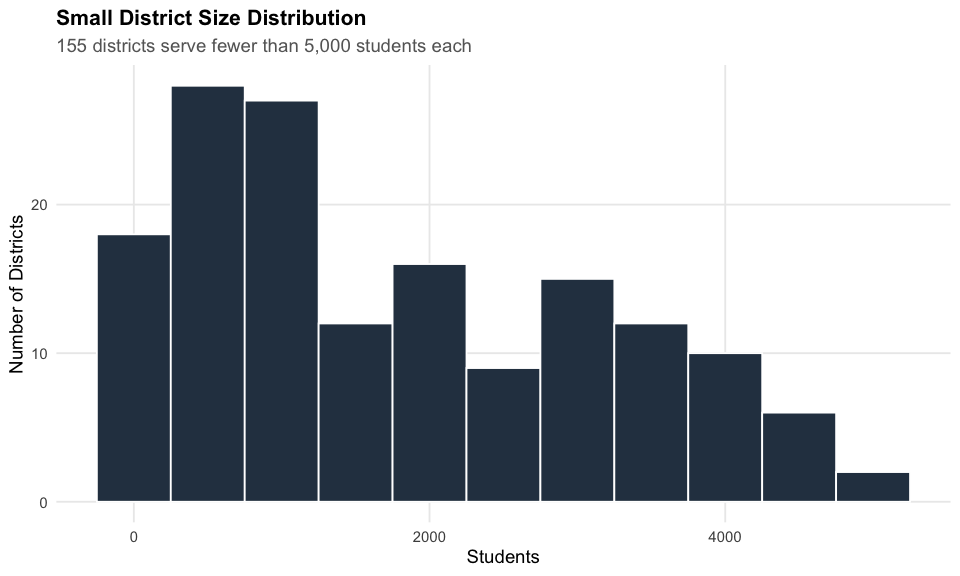
10. Girls outperform boys in ELA by 9 points
Gender gaps persist in literacy, with girls at 46% proficient vs boys at 38%.
gender_ela <- assess_wide %>%
  filter(district_id == "ALL", school_id == "ALL",
         subgroup %in% c("Male", "Female"),
         subject == "ELA",
         grade == "All") %>%
  filter(!is.na(n_tested)) %>%
  mutate(pct_proficient = (n_proficient + n_distinguished) / n_tested * 100)

stopifnot(nrow(gender_ela) == 2)

cat("Gender Gaps in ELA:\n")
print(gender_ela %>% select(subgroup, n_tested, pct_proficient))
#> Gender Gaps in ELA:
#> # A tibble: 2 x 3
#>   subgroup n_tested pct_proficient
#>   <chr>       <dbl>          <dbl>
#> 1 Male       385928           37.5
#> 2 Female     373198           46.3
11. US History has the lowest EOC proficiency at 39%
End-of-Course exams show US History as the most challenging high school subject, while Biology leads at 45%.
eoc_wide <- fetch_eoc(2024, tidy = FALSE, use_cache = TRUE)

eoc_prof_wide <- eoc_wide %>%
  filter(district_id == "ALL", school_id == "ALL",
         subgroup == "All Students", grade == "All") %>%
  filter(!is.na(n_tested)) %>%
  mutate(pct_proficient = (n_proficient + n_distinguished) / n_tested * 100) %>%
  filter(!is.na(pct_proficient), n_tested > 10000) %>%
  arrange(pct_proficient) %>%
  mutate(subject = reorder(subject, pct_proficient))

stopifnot(nrow(eoc_prof_wide) > 0)

cat("EOC Subject Proficiency:\n")
print(eoc_prof_wide %>% select(subject, n_tested, pct_proficient))
#> EOC Subject Proficiency:
#> # A tibble: 4 x 3
#>   subject           n_tested pct_proficient
#>   <chr>                <dbl>          <dbl>
#> 1 US History          100363           38.8
#> 2 American Lit & Comp 132797           42.0
#> 3 Algebra: Concepts   145998           44.1
#> 4 Biology             139223           44.8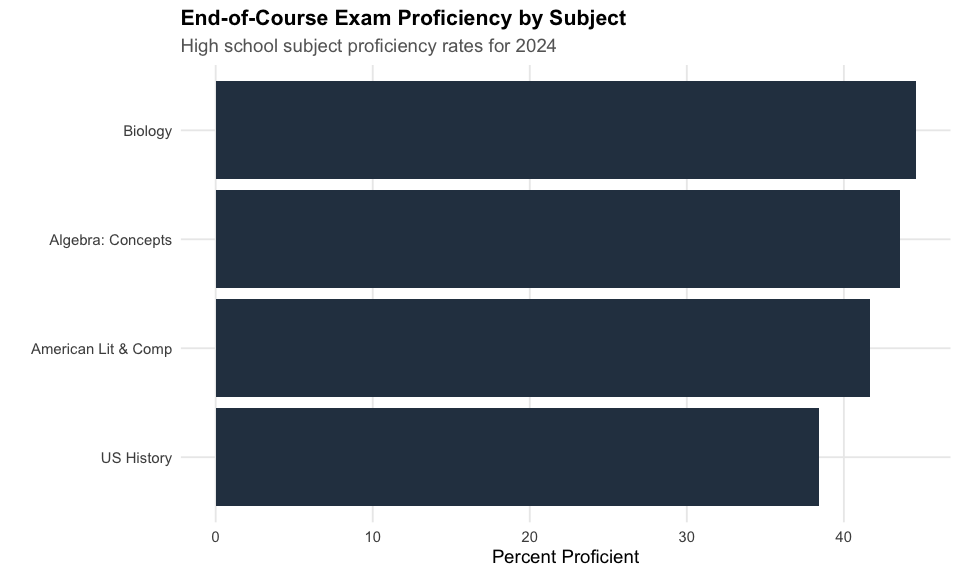
12. Students with Disabilities at 13% ELA proficiency
Students with Disabilities have the lowest proficiency rates across all subgroups, at 13% in ELA and 16% in Math.
swd_all <- assess_wide %>%
  filter(district_id == "ALL", school_id == "ALL",
         subgroup == "Students with Disabilities",
         subject %in% c("ELA", "Math"),
         grade == "All") %>%
  filter(!is.na(n_tested)) %>%
  mutate(pct_proficient = (n_proficient + n_distinguished) / n_tested * 100)

stopifnot(nrow(swd_all) > 0)

cat("Students with Disabilities Proficiency:\n")
print(swd_all %>% select(subject, n_tested, pct_proficient))
#> Students with Disabilities Proficiency:
#> # A tibble: 2 x 3
#>   subject n_tested pct_proficient
#>   <chr>      <dbl>          <dbl>
#> 1 ELA       103604           13.2
#> 2 Math      103447           16.5
13. English Learners face a 32-point ELA gap
English Learners achieve just 10% proficiency in ELA, compared to 42% statewide – a 32-point gap.
el_compare <- assess_wide %>%
  filter(district_id == "ALL", school_id == "ALL",
         subgroup %in% c("All Students", "English Learners"),
         subject %in% c("ELA", "Math"),
         grade == "All") %>%
  filter(!is.na(n_tested)) %>%
  mutate(pct_proficient = (n_proficient + n_distinguished) / n_tested * 100)

stopifnot(nrow(el_compare) > 0)

cat("English Learners vs All Students:\n")
print(el_compare %>% select(subgroup, subject, n_tested, pct_proficient))
#> English Learners vs All Students:
#> # A tibble: 4 x 4
#>   subgroup         subject n_tested pct_proficient
#>   <chr>            <chr>      <dbl>          <dbl>
#> 1 All Students     ELA       759126           41.8
#> 2 All Students     Math      758385           41.8
#> 3 English Learners ELA        75974            9.6
#> 4 English Learners Math       75906           17.5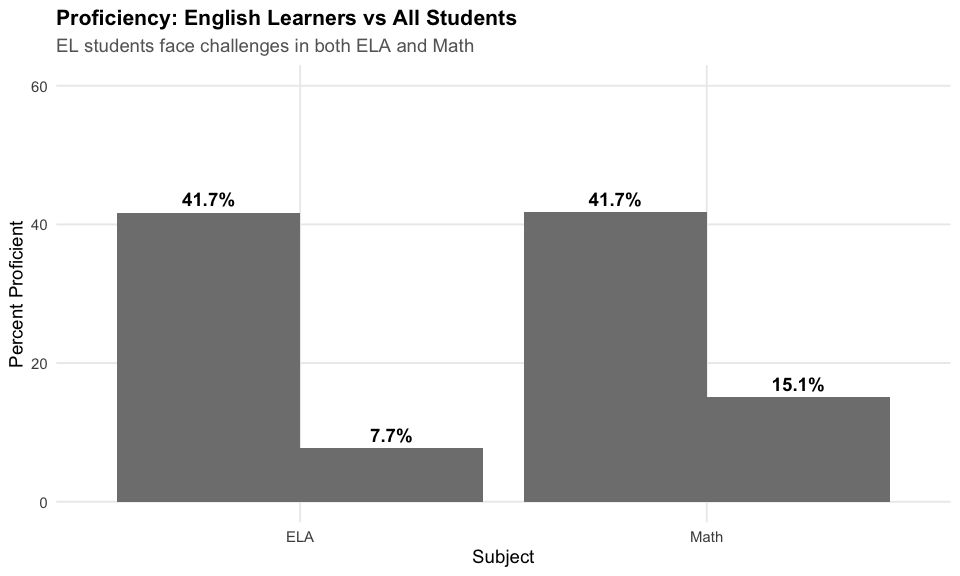
14. Decatur City leads with 74% ELA proficiency
The highest-performing districts in Georgia reach 60-74% proficiency, far above the 42% state average.
district_proficiency <- assess_wide %>%
  filter(school_id == "ALL", district_id != "ALL",
         subgroup == "All Students",
         subject == "ELA",
         grade == "All") %>%
  filter(!is.na(n_tested)) %>%
  mutate(pct_proficient = (n_proficient + n_distinguished) / n_tested * 100) %>%
  filter(n_tested >= 1000) %>%
  arrange(desc(pct_proficient)) %>%
  head(15) %>%
  mutate(district_label = reorder(district_name, pct_proficient))

stopifnot(nrow(district_proficiency) > 0)

cat("Highest-Performing Districts (ELA, 1000+ students):\n")
print(district_proficiency %>% select(district_name, pct_proficient, n_tested) %>% head(10))
#> Highest-Performing Districts (ELA, 1000+ students):
#> # A tibble: 10 x 3
#>    district_name        pct_proficient n_tested
#>    <chr>                         <dbl>    <dbl>
#>  1 City Schools of Decatur        74.4     2513
#>  2 Oconee County                  72.1     3798
#>  3 Bremen City                    67.5     1000
#>  4 Fayette County                 65.8     8693
#>  5 Buford City                    65.6     2695
#>  6 Jefferson City                 64.8     1918
#>  7 Forsyth County                 62.1    25229
#>  8 Columbia County                58.8    13033
#>  9 Bryan County                   57.4     4650
#> 10 Pierce County                  55.3     1561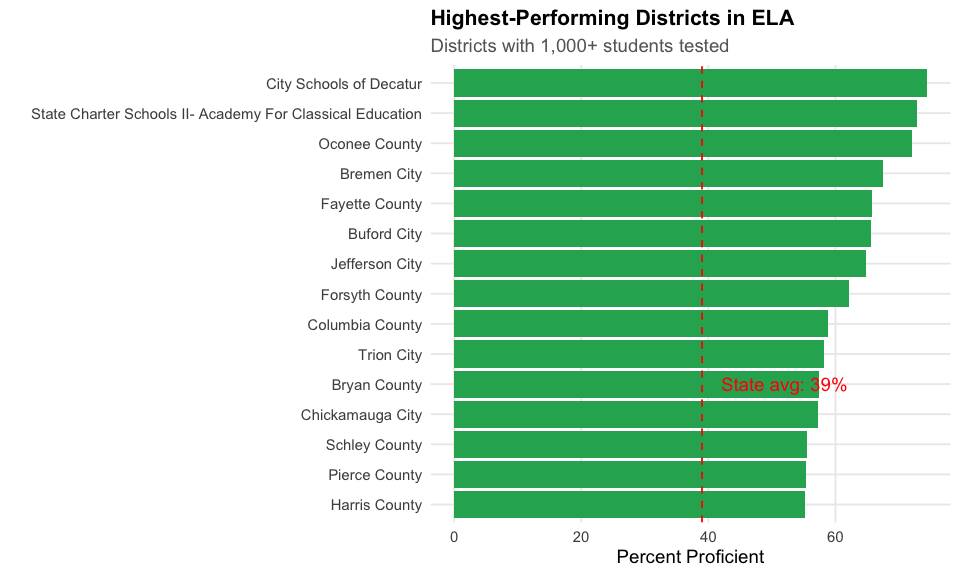
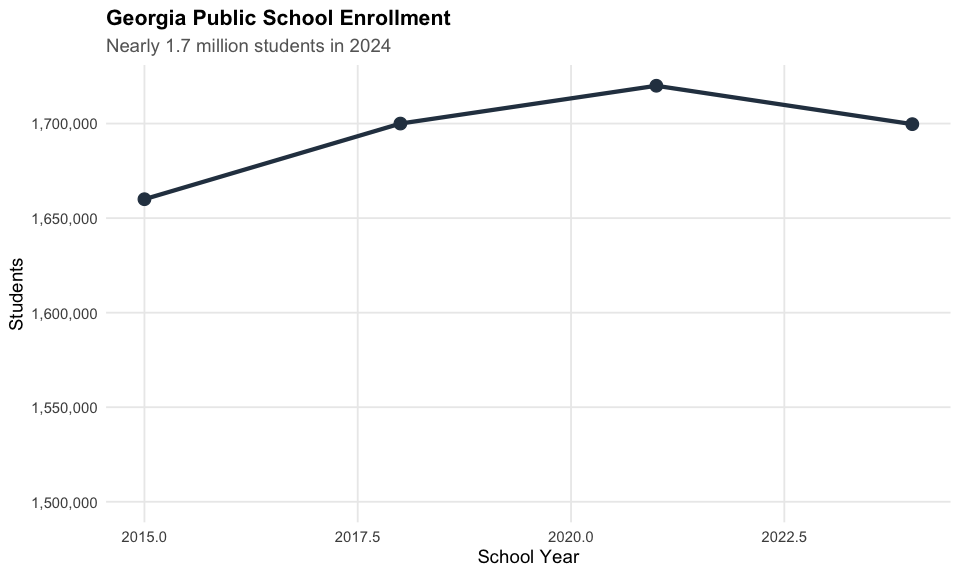
15. Georgia keeps growing
Georgia’s public schools serve nearly 1.7 million students, making it the 8th largest school system in the nation.
enr_2024 <- fetch_enr(2024, use_cache = TRUE)

# Get state total for 2024
state_row <- enr_2024 %>% filter(DETAIL_LVL_DESC == "State")
grade_cols <- grep("^GRADE_", names(enr_2024), value = TRUE)
total <- sum(sapply(grade_cols, function(col) {
  val <- state_row[[col]][1]
  if (is.na(val) || val == "TFS") return(0)
  as.numeric(val)
}), na.rm = TRUE)

stopifnot(total > 0)

cat("Total enrollment:", format(total, big.mark = ","), "\n")
#> Total enrollment: 1,699,690