library(njschooldata)
library(ggplot2)
library(dplyr)
library(tidyr)
library(scales)

options(timeout = max(600, getOption("timeout")))
theme_nj <- function() {
  theme_minimal(base_size = 14) +
    theme(
      plot.title = element_text(face = "bold", size = 16),
      plot.subtitle = element_text(color = "gray40"),
      plot.caption = element_text(color = "gray55", size = 9),
      panel.grid.minor = element_blank(),
      legend.position = "bottom"
    )
}

nj_navy <- "#16356B"
nj_gold <- "#C8A14B"
nj_red  <- "#B83227"
fetch_finance() is the uniform, cross-state finance
front door for New Jersey. It consolidates the two NJ DOE finance
sources this package already pulls — the Taxpayers’ Guide to
Educational Spending (per-pupil spending) and the Governor’s Budget
Message district details (K-12 state aid) — onto one tidy schema with a
standard metric vocabulary, so the same analysis code runs
unchanged across states.
end_year is the fiscal/school year END:
end_year = 2024 is FY2024, school year 2023-24. Every value
traces to a downloaded NJ DOE file; the federal NCES identifier
(nces_dist) is attached as a join key only.
# the spending side is published a year in arrears, so even years 2016-2024
# give a clean statewide actuals series; 2024 is the latest full cross-section.
fin_multi <- fetch_finance_multi(
  c(2016, 2018, 2020, 2022, 2024),
  allow_partial = TRUE
)
fin_2024  <- fetch_finance(2024)

# Spending is complete for every requested year. The source ledger also makes
# the unavailable 2020 and 2022 state-aid components explicit.
get_source_results(fin_multi) %>%
  select(end_year, component, source_status)
#>    end_year component source_status
#> 1      2016  spending        actual
#> 2      2016 state_aid not_published
#> 3      2018  spending        actual
#> 4      2018 state_aid not_published
#> 5      2020  spending        actual
#> 6      2020 state_aid        actual
#> 7      2022  spending        actual
#> 8      2022 state_aid        actual
#> 9      2024  spending        actual
#> 10     2024 state_aid        actual
Story 1: New Jersey per-pupil spending climbed 47% in eight years
Statewide total per-pupil expenditures rose from $20,385 in FY2016 to $29,950 in FY2024 — an eight-year jump of nearly half, well ahead of general inflation over the same window.
state_trend <- fin_multi %>%
  filter(is_state, metric == "per_pupil_total") %>%
  arrange(end_year) %>%
  select(end_year, value)

state_trend %>%
  mutate(pct_change_since_2016 = round((value / value[1] - 1) * 100, 1))
#> # A tibble: 5 × 3
#>   end_year value pct_change_since_2016
#>      <int> <dbl>                 <dbl>
#> 1     2016 20385                   0
#> 2     2018 21866                   7.3
#> 3     2020 22926                  12.5
#> 4     2022 27486                  34.8
#> 5     2024 29950                  46.9
stopifnot(nrow(state_trend) > 0)

ggplot(state_trend, aes(end_year, value)) +
  geom_line(color = nj_navy, linewidth = 1.2) +
  geom_point(color = nj_navy, size = 3) +
  geom_text(aes(label = dollar(value)), vjust = -1, size = 4, color = nj_navy) +
  scale_y_continuous(labels = dollar, limits = c(20000, 32000)) +
  scale_x_continuous(breaks = state_trend$end_year) +
  labs(
    title = "NJ total per-pupil spending rose 47% from FY2016 to FY2024",
    subtitle = "Statewide average, total per-pupil expenditures (actuals)",
    x = "Fiscal year (end)", y = "Per-pupil total",
    caption = "Source: NJ DOE Taxpayers' Guide to Educational Spending via fetch_finance()"
  ) +
  theme_nj()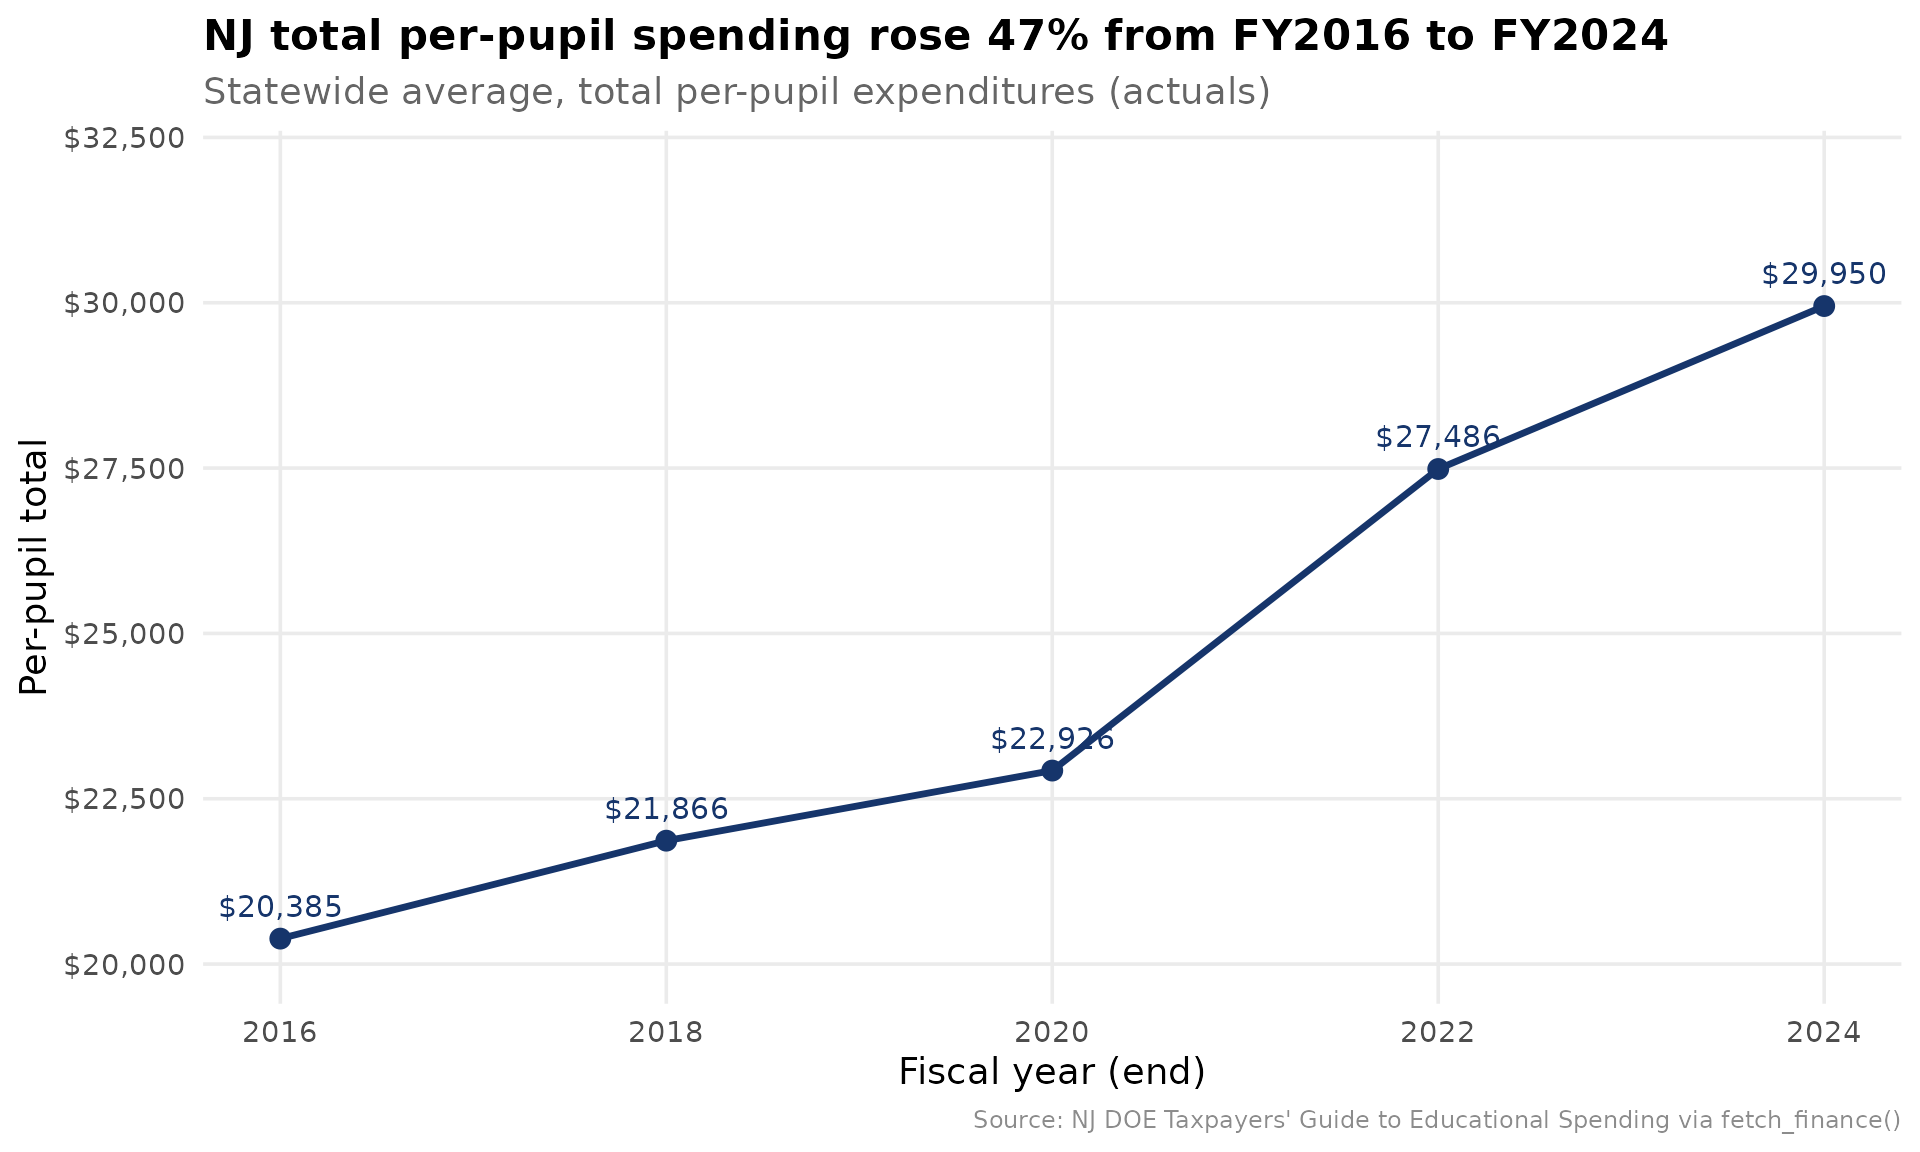
Story 2: Per-pupil spending varies enormously — Lakewood is the extreme
Within a single year, district per-pupil spending spans a huge range. Lakewood Township reports $86,480 per pupil in FY2024 — nearly three times the statewide average — a figure driven by the district’s large nonpublic-school transportation and special-education obligations, which run through the public district budget.
top_spenders <- fin_2024 %>%
  filter(is_district, metric == "per_pupil_total",
         enrollment_denominator > 1000) %>%
  arrange(desc(value)) %>%
  select(entity_name, county, value, enrollment_denominator) %>%
  head(10)

top_spenders
#> # A tibble: 10 × 4
#>    entity_name              county   value enrollment_denominator
#>    <chr>                    <chr>    <dbl>                  <dbl>
#>  1 Lakewood Twp             Ocean    86480                   4720
#>  2 Asbury Park City         Monmouth 65256                   1504
#>  3 Camden City              Camden   49091                   7116
#>  4 Pascack Valley Regional  Bergen   47383                   1736
#>  5 Hanover Park Regional    Morris   44313                   1299
#>  6 Ramapo-Indian Hill Reg   Bergen   44094                   1919
#>  7 Warren Twp               Somerset 41615                   1666
#>  8 Keansburg Boro           Monmouth 41342                   1551
#>  9 Northern Valley Regional Bergen   41226                   2156
#> 10 Essex Co Voc-Tech        Essex    40987                   2061
stopifnot(nrow(top_spenders) > 0)

state_pp <- fin_2024 %>%
  filter(is_state, metric == "per_pupil_total") %>%
  pull(value)

ggplot(top_spenders, aes(reorder(entity_name, value), value)) +
  geom_col(fill = nj_gold) +
  geom_hline(yintercept = state_pp, linetype = "dashed", color = nj_navy) +
  annotate("text", x = 1.5, y = state_pp,
           label = paste0("State avg ", dollar(state_pp)),
           hjust = 0, vjust = -0.5, color = nj_navy, size = 3.5) +
  coord_flip() +
  scale_y_continuous(labels = dollar) +
  labs(
    title = "Highest per-pupil spenders, FY2024 (enrollment > 1,000)",
    subtitle = "Dashed line = statewide average",
    x = NULL, y = "Per-pupil total",
    caption = "Source: NJ DOE TGES via fetch_finance()"
  ) +
  theme_nj()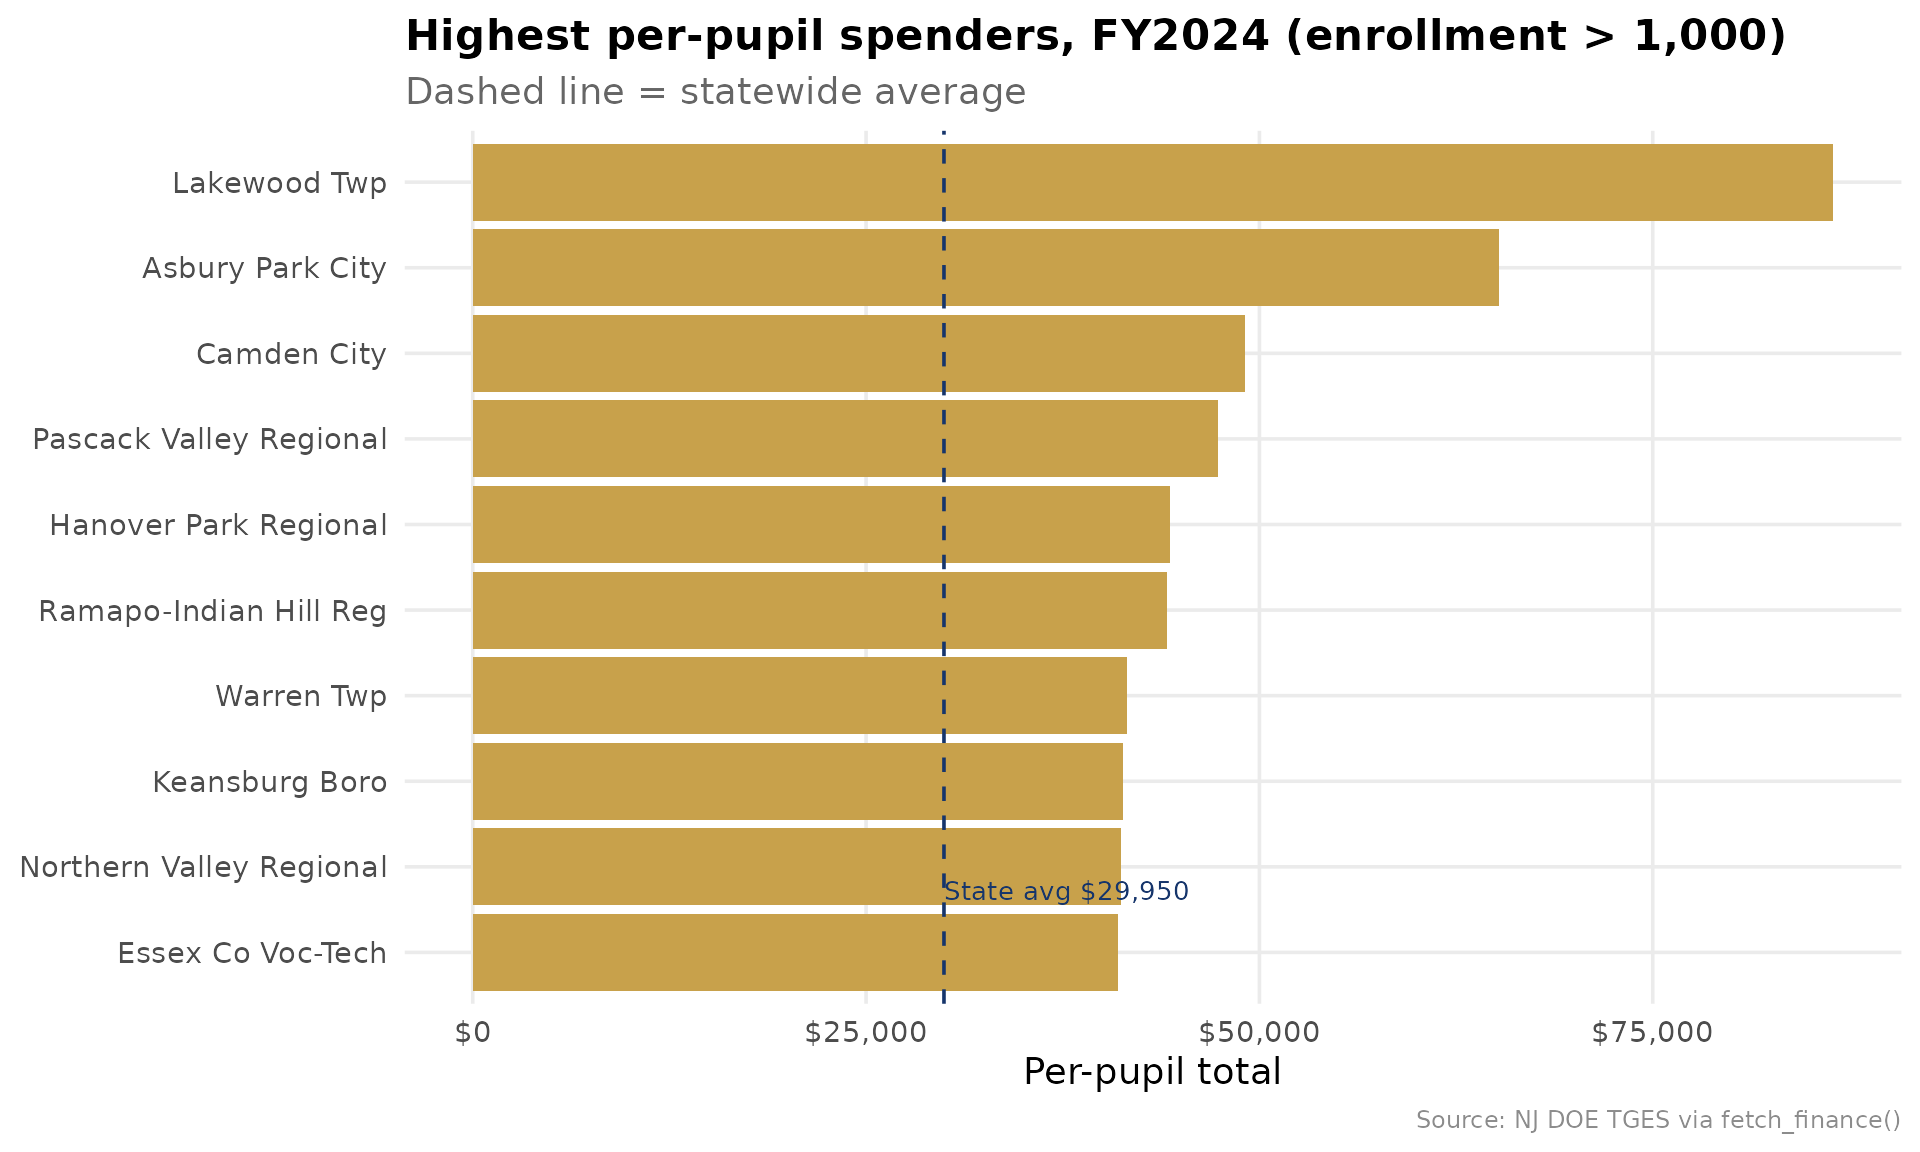
Story 3: State aid is concentrated in the former Abbott cities
Of $10.75 billion in total K-12 state aid in FY2024, the four largest recipients — Newark, Elizabeth, Paterson, and Trenton, all former Abbott districts — absorb a strikingly large share. Newark alone receives nearly $1.15 billion, about 10.7% of all state aid in New Jersey.
state_total_aid <- fin_2024 %>%
  filter(is_state, metric == "revenue_state") %>%
  pull(value)

top_aid <- fin_2024 %>%
  filter(is_district, metric == "revenue_state") %>%
  arrange(desc(value)) %>%
  mutate(share_of_state = round(value / state_total_aid * 100, 1)) %>%
  select(entity_name, value, share_of_state) %>%
  head(10)

top_aid
#> # A tibble: 10 × 3
#>    entity_name             value share_of_state
#>    <chr>                   <dbl>          <dbl>
#>  1 Newark City        1149975941           10.7
#>  2 Elizabeth City      532961132            5
#>  3 Paterson City       529272462            4.9
#>  4 Trenton City        336330541            3.1
#>  5 Camden City         333950970            3.1
#>  6 Passaic City        272108020            2.5
#>  7 Plainfield City     246081549            2.3
#>  8 Union City          226682966            2.1
#>  9 Perth Amboy City    204876489            1.9
#> 10 New Brunswick City  185885120            1.7
stopifnot(nrow(top_aid) > 0)

ggplot(top_aid, aes(reorder(entity_name, value), value)) +
  geom_col(fill = nj_red) +
  geom_text(aes(label = paste0(share_of_state, "%")),
            hjust = -0.1, size = 3.5, color = nj_red) +
  coord_flip() +
  scale_y_continuous(labels = label_dollar(scale = 1e-6, suffix = "M"),
                     expand = expansion(mult = c(0, 0.15))) +
  labs(
    title = "Largest K-12 state-aid recipients, FY2024",
    subtitle = "Bar label = share of the $10.75B statewide total",
    x = NULL, y = "Total state aid",
    caption = "Source: NJ DOE Governor's Budget Message district details via fetch_finance()"
  ) +
  theme_nj()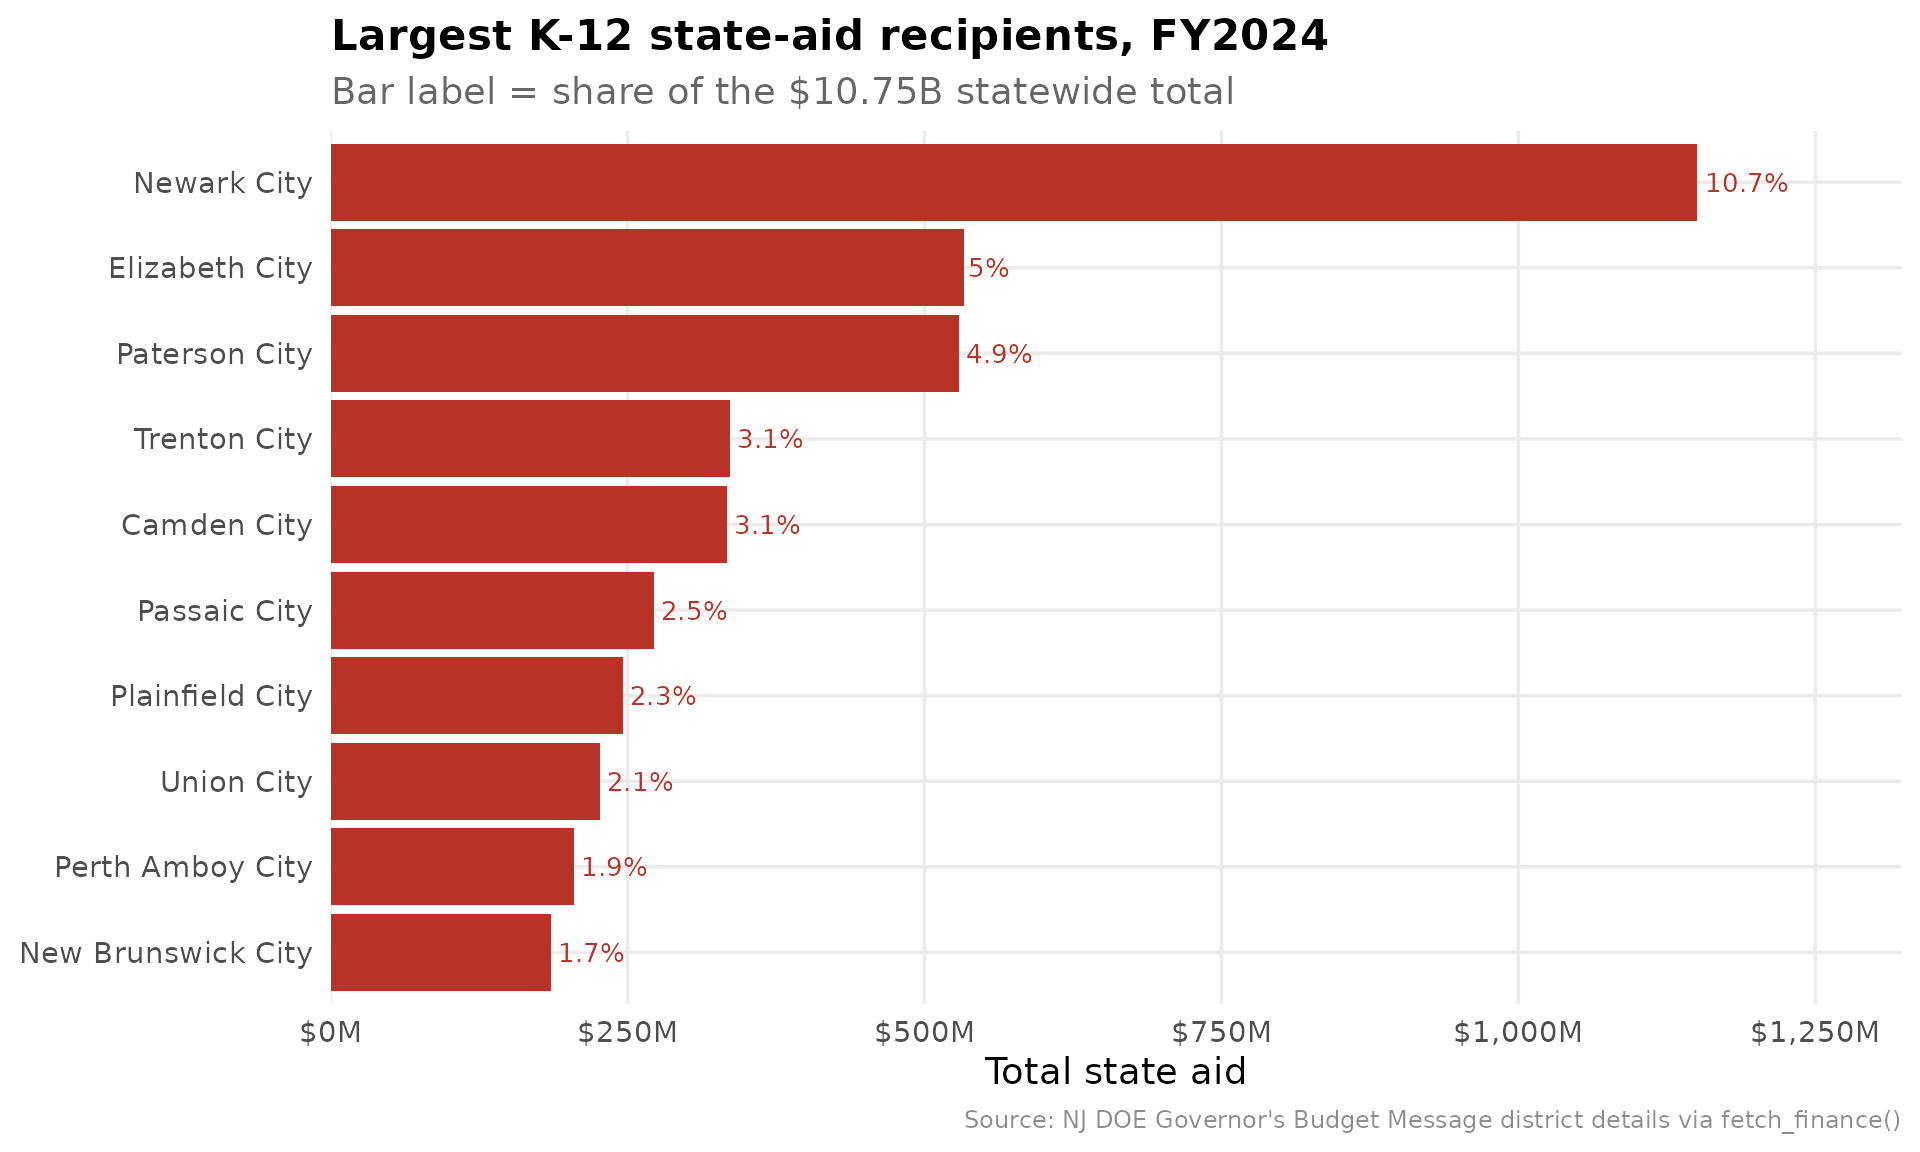
The canonical schema
Every row is one end_year × entity ×
metric. The standard cross-state metrics
(per_pupil_total, per_pupil_instruction,
revenue_state) sit alongside NJ-specific per-pupil category
metrics, and each row carries the federal nces_dist join
key.
fin_2024 %>%
  filter(state_id == "3570") %>%
  select(end_year, entity_name, metric, value, is_per_pupil,
         enrollment_denominator, nces_dist)
#> # A tibble: 7 × 7
#>   end_year entity_name metric          value is_per_pupil enrollment_denominator
#>      <int> <chr>       <chr>           <dbl> <lgl>                         <dbl>
#> 1     2024 Newark City per_pupil_to…  3.44e4 TRUE                          43251
#> 2     2024 Newark City per_pupil_in…  1.06e4 TRUE                             NA
#> 3     2024 Newark City per_pupil_su…  4.24e3 TRUE                             NA
#> 4     2024 Newark City per_pupil_ad…  1.92e3 TRUE                             NA
#> 5     2024 Newark City per_pupil_op…  3.90e3 TRUE                             NA
#> 6     2024 Newark City per_pupil_fo… NA      TRUE                             NA
#> 7     2024 Newark City revenue_state  1.15e9 FALSE                            NA
#> # ℹ 1 more variable: nces_dist <chr>
sessionInfo()
#> R version 4.6.2 (2026-10-29)
#> Platform: x86_64-pc-linux-gnu
#> Running under: Ubuntu 26.04.1 LTS
#>
#> Matrix products: default
#> BLAS:   /usr/lib/x86_64-linux-gnu/openblas-pthread/libblas.so.3
#> LAPACK: /usr/lib/x86_64-linux-gnu/openblas-pthread/libopenblasp-r0.3.32.so;  LAPACK version 3.12.0
#>
#> locale:
#>  [1] LC_CTYPE=C.UTF-8       LC_NUMERIC=C           LC_TIME=C.UTF-8
#>  [4] LC_COLLATE=C.UTF-8     LC_MONETARY=C.UTF-8    LC_MESSAGES=C.UTF-8
#>  [7] LC_PAPER=C.UTF-8       LC_NAME=C              LC_ADDRESS=C
#> [10] LC_TELEPHONE=C         LC_MEASUREMENT=C.UTF-8 LC_IDENTIFICATION=C
#>
#> time zone: UTC
#> tzcode source: system (glibc)
#>
#> attached base packages:
#> [1] stats     graphics  grDevices utils     datasets  methods   base
#>
#> other attached packages:
#> [1] scales_1.4.0        tidyr_1.3.2         dplyr_1.2.1
#> [4] ggplot2_4.0.4       njschooldata_0.11.0
#>
#> loaded via a namespace (and not attached):
#>  [1] utf8_1.2.6         rappdirs_0.3.4     sass_0.5.0         generics_0.1.4
#>  [5] stringi_1.8.9      hms_1.1.4          digest_0.6.39      magrittr_2.0.5
#>  [9] evaluate_1.0.5     grid_4.6.2         timechange_0.4.0   RColorBrewer_1.1-3
#> [13] fastmap_1.2.0      cellranger_1.1.0   jsonlite_2.0.0     purrr_1.2.2
#> [17] codetools_0.2-20   textshaping_1.1.0  jquerylib_0.1.4    cli_3.6.6
#> [21] crayon_1.5.3       rlang_1.3.0        bit64_4.8.6        withr_3.0.3
#> [25] cachem_1.1.0       yaml_2.3.12        otel_0.3.0         parallel_4.6.2
#> [29] tools_4.6.2        tzdb_0.5.0         curl_8.1.0         vctrs_0.7.3
#> [33] R6_2.6.1           lifecycle_1.0.5    lubridate_1.9.5    snakecase_0.11.1
#> [37] stringr_1.6.0      bit_4.6.0          fs_2.1.0           vroom_1.7.1
#> [41] ragg_1.5.2         janitor_2.2.1      pkgconfig_2.0.3    desc_1.4.3
#> [45] pkgdown_2.2.1      pillar_1.11.1      bslib_0.12.0       gtable_0.3.6
#> [49] glue_1.8.1         systemfonts_1.3.3  xfun_0.62          tibble_3.3.1
#> [53] tidyselect_1.2.1   knitr_1.52         farver_2.1.2       htmltools_0.5.9
#> [57] labeling_0.4.3     rmarkdown_2.32     readr_2.2.0        compiler_4.6.2
#> [61] S7_1.0.0           readxl_1.6.0