New York public schools have lost 295,521 students since 2012 - that’s the equivalent of emptying Buffalo, Rochester, Syracuse, and Yonkers combined. But this headline number hides a complex story of urban decline, Pre-K revolution, COVID disruption, and surprising pockets of growth.
Part of the njschooldata family.
Full documentation — all 15 stories with interactive charts, getting-started guide, and complete function reference.
Highlights
# Fetch district-level data for all available years
enr <- fetch_enr_years(2012:2024, level = "district", tidy = TRUE, use_cache = TRUE)
1. The Pre-K Revolution
Pre-K enrollment surged from 100K to 167K - a 67% increase driven by NYC’s Universal Pre-K program, which launched full-day Pre-K in 2015.
pk_trend <- enr %>%
  filter(grade_level == "PK") %>%
  group_by(end_year) %>%
  summarize(total = sum(n_students, na.rm = TRUE), .groups = "drop") %>%
  mutate(
    yoy_pct = round((total - lag(total)) / lag(total) * 100, 1)
  )

stopifnot(nrow(pk_trend) > 0)
#> Pre-K grew 67% from 2012 to 2024
#> NYC Universal Pre-K drove the largest single-year surge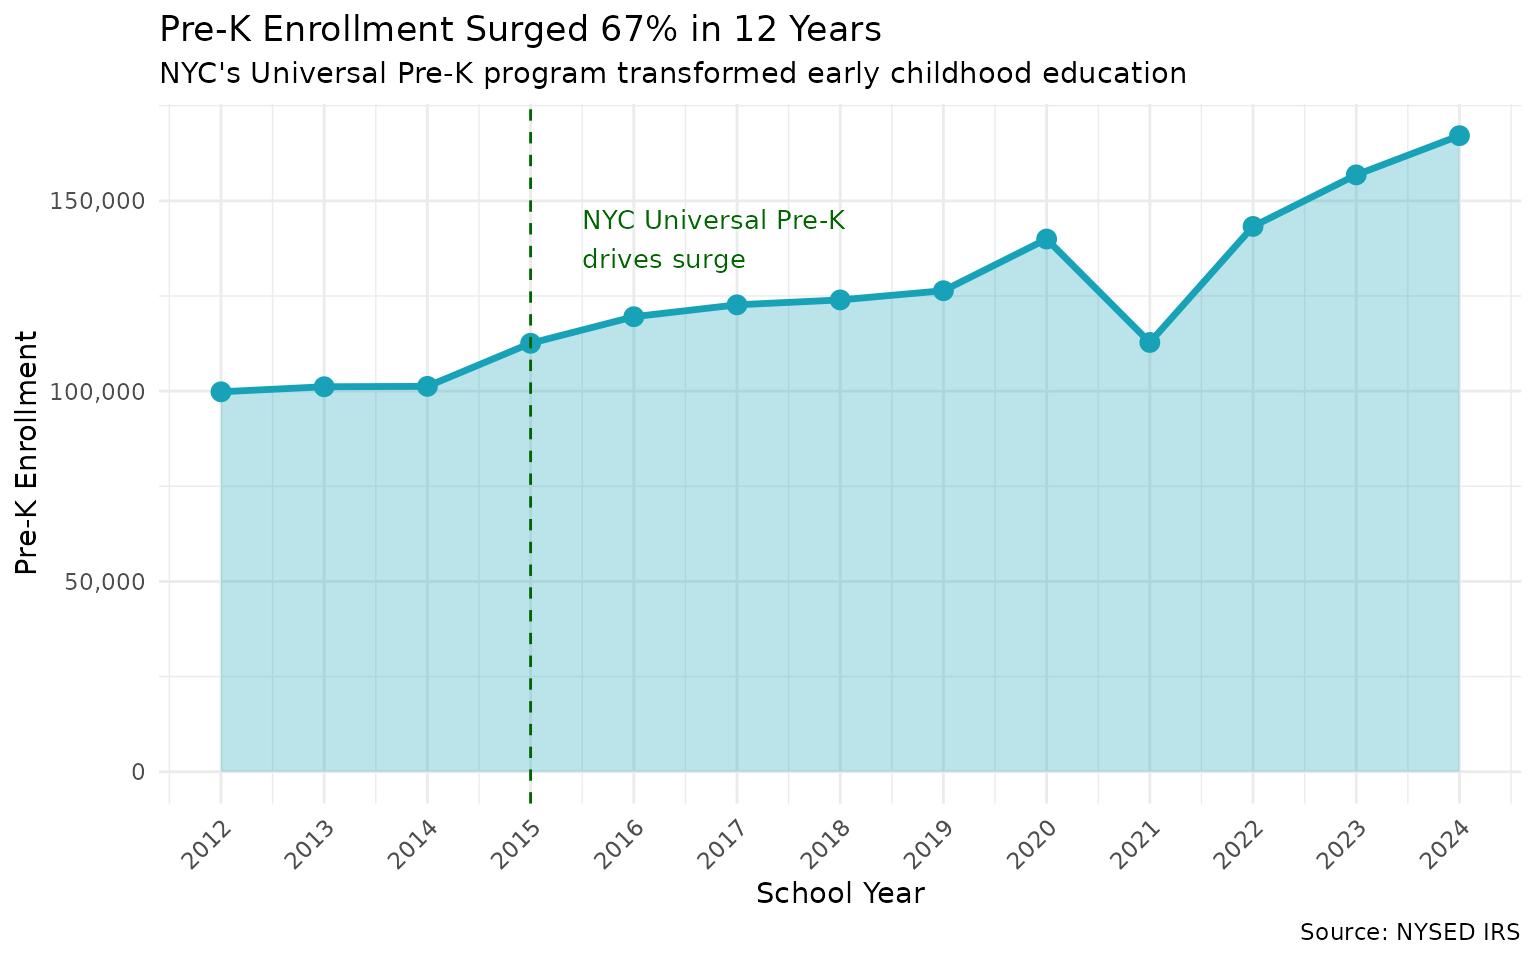
2. The Bronx Exodus
The Bronx lost 23.7% of its students - the worst percentage decline among major counties, losing nearly 50,000 students.
county_2012 <- enr %>% filter(end_year == 2012, grade_level == "TOTAL") %>%
  group_by(county) %>% summarize(enr_2012 = sum(n_students, na.rm = TRUE), .groups = "drop")
county_2024 <- enr %>% filter(end_year == 2024, grade_level == "TOTAL") %>%
  group_by(county) %>% summarize(enr_2024 = sum(n_students, na.rm = TRUE), .groups = "drop")

county_change <- county_2012 %>%
  inner_join(county_2024, by = "county") %>%
  filter(enr_2012 > 10000) %>%  # Major counties only
  mutate(
    change = enr_2024 - enr_2012,
    pct_change = round((enr_2024 - enr_2012) / enr_2012 * 100, 1)
  ) %>%
  arrange(pct_change)

stopifnot(nrow(county_change) > 0)
#> BRONX:       -23.7%
#> SCHENECTADY: -18.7%
#> CHEMUNG:     -17.5%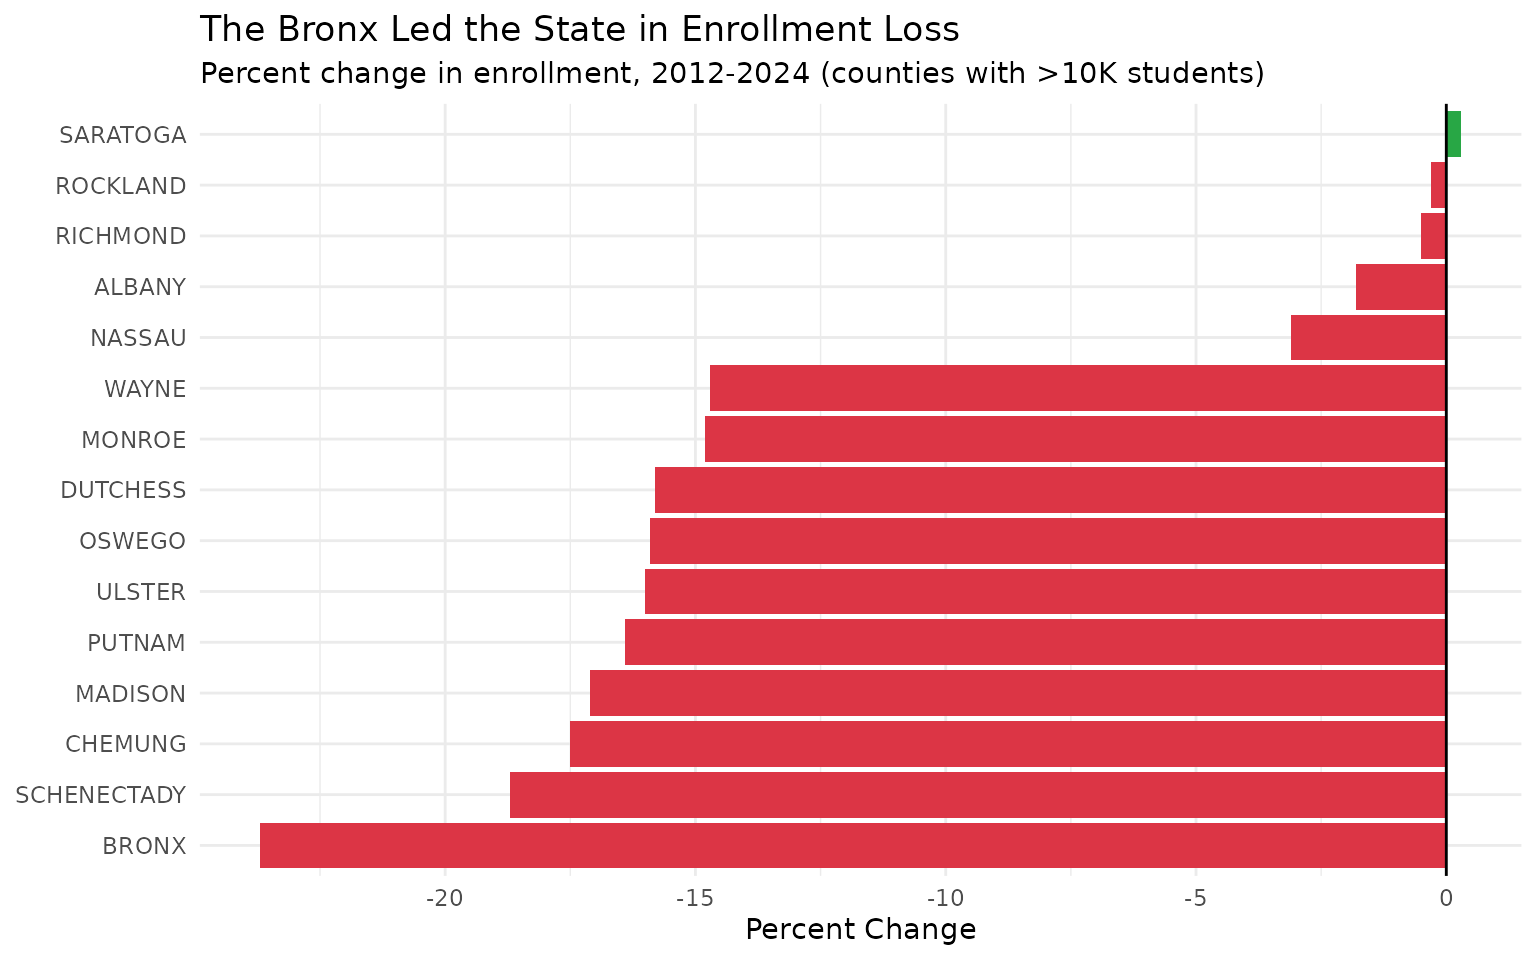
3. NYC Enrolls 37% of the State - But Is Shrinking Faster
NYC accounts for 898K of 2.4 million students (37%), and lost 12.1% since 2012 compared to 10.2% for the rest of the state. The city’s outsized share means its decline drives statewide numbers.
# Note: is_nyc flag relies on district_code, which is missing for 2012-2022.
# Use grepl on district_name instead. Also exclude 2022 where district_name is NA.
nyc_vs_rest <- enr %>%
  filter(grade_level == "TOTAL", !is.na(district_name)) %>%
  mutate(nyc_flag = grepl("^NYC", district_name)) %>%
  group_by(end_year, nyc_flag) %>%
  summarize(total = sum(n_students, na.rm = TRUE), .groups = "drop") %>%
  mutate(region = ifelse(nyc_flag, "NYC", "Rest of State"))

stopifnot(nrow(nyc_vs_rest) > 0)

# Calculate shares
nyc_share <- nyc_vs_rest %>%
  group_by(end_year) %>%
  mutate(pct_share = round(total / sum(total) * 100, 1))
#> 2024 NYC share: 37.4% (898,410 of 2,404,319)
#> NYC change: -12.1%, Rest of State: -10.2%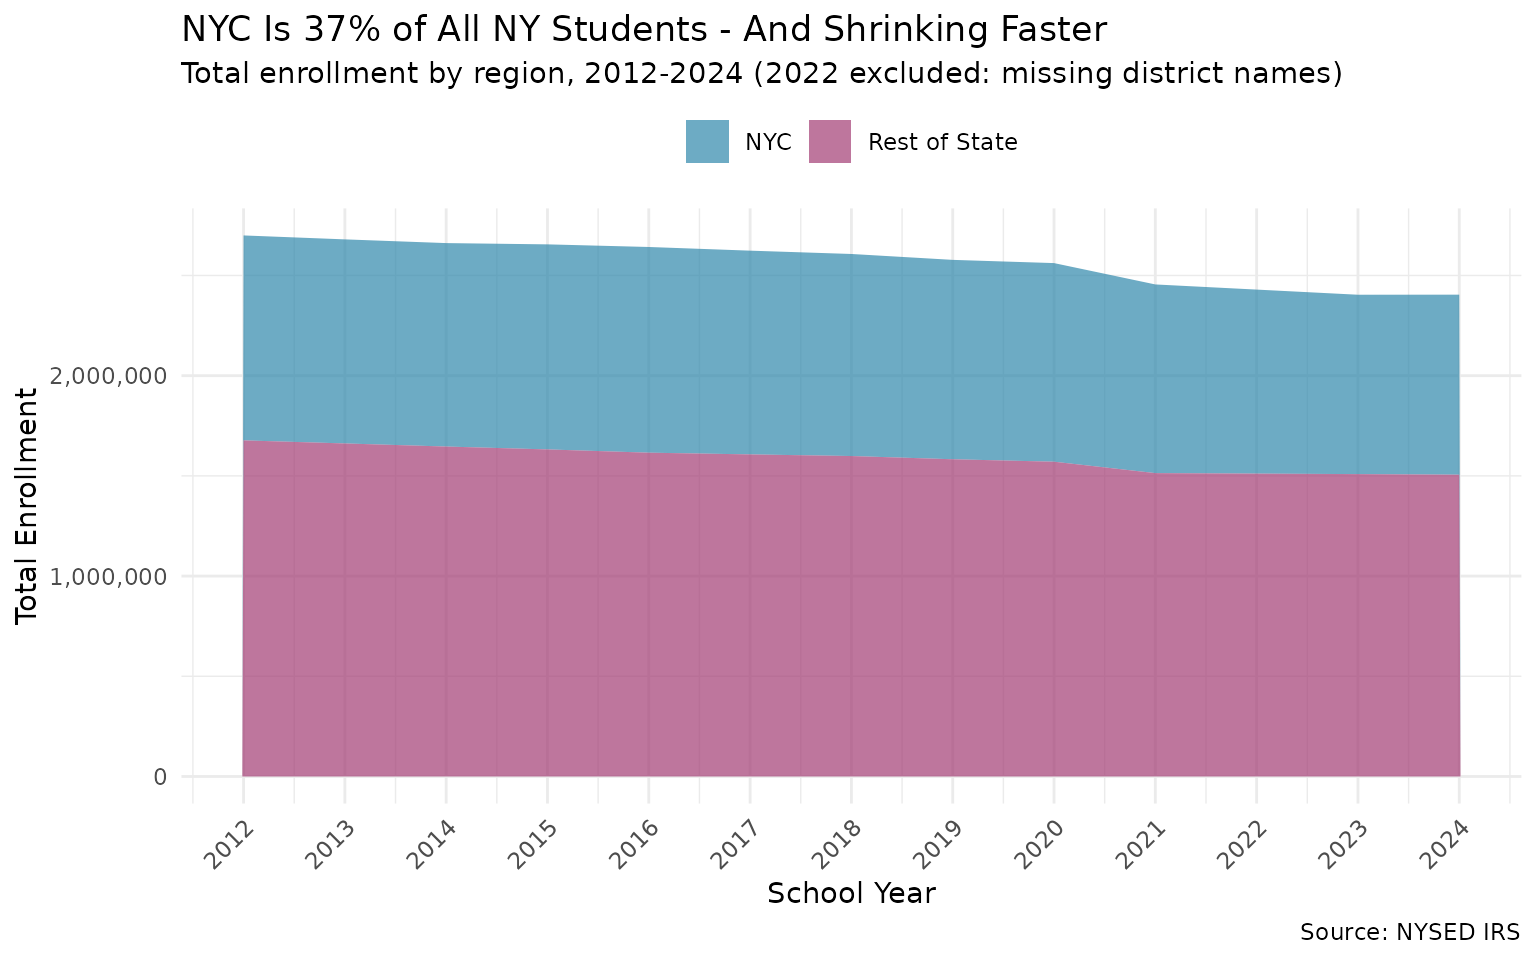
Data Taxonomy
| Category | Years | Function | Details |
|---|---|---|---|
| Enrollment | 1977-2024 |
fetch_enr() / fetch_enr_years()
|
State, district, school. EconDisadv, ELL, SWD |
| Assessments | 2014-2025 |
fetch_assessment() / fetch_assessment_multi()
|
ELA, Math, Science grades 3-8. Race, gender, economic status, EL, SWD |
| Graduation | 2014-2024 |
fetch_graduation() / fetch_graduation_multi()
|
State, district, school. 4-yr, 5-yr, 6-yr cohort rates |
| Directory | Current | fetch_directory() |
School name, address, phone, principal, grades served |
| Per-Pupil Spending | — | — | — |
| Accountability | — | — | — |
| Chronic Absence | — | — | — |
| EL Progress | — | — | — |
| Special Ed | — | — | — |
See DATA-CATEGORY-TAXONOMY.md for what each category covers.
Quick Start
R
# install.packages("remotes")
remotes::install_github("almartin82/nyschooldata")Python
import pynyschooldata as ny

# Fetch 2024 data (2023-24 school year)
enr = ny.fetch_enr(2024)

# Statewide total
total = enr[enr['is_district'] & (enr['grade_level'] == 'TOTAL')]['n_students'].sum()
print(f"{total:,} students")
#> 2,404,319 students

# Get multiple years
enr_multi = ny.fetch_enr_multi([2020, 2021, 2022, 2023, 2024])

# Check available years
years = ny.get_available_years()
print(f"Data available: {years['min_year']}-{years['max_year']}")
#> Data available: 1977-2024
Explore More
- Full documentation
- 15 Surprising Findings in NY School Enrollment — 15 stories
- NY Assessment Data — 15 stories
- Function reference
Data Notes
Data Source
All data comes directly from NYSED Information Reporting Services. Files are downloaded, cached locally, and standardized into a consistent schema.
Census Date
Enrollment counts are collected on BEDS Day (Basic Educational Data System Day), which falls in early October each year. This is the official enrollment census date for New York State public schools.
Coverage by Era
| Era | Years | What’s Available |
|---|---|---|
| Archive I | 1977-1993 | K-12 enrollment by grade, district & school level |
| Archive II | 1994-2011 | + Pre-K, + Gender breakdowns |
| Modern | 2012-2021 | + Econ Disadvantaged, ELL, Students w/ Disabilities |
| Current | 2022-2024 | Same as Modern, updated file format |
Deeper Dive
4. The Vanishing 300,000
New York lost 295,521 students (11%) from 2012 to 2024 - equivalent to losing every student in Buffalo, Rochester, Syracuse, and Yonkers combined.
state_trend <- enr %>%
  filter(grade_level == "TOTAL") %>%
  group_by(end_year) %>%
  summarize(total = sum(n_students, na.rm = TRUE), .groups = "drop")

stopifnot(nrow(state_trend) > 0)

# Calculate loss
loss <- state_trend$total[state_trend$end_year == 2012] -
        state_trend$total[state_trend$end_year == 2024]
#> 295521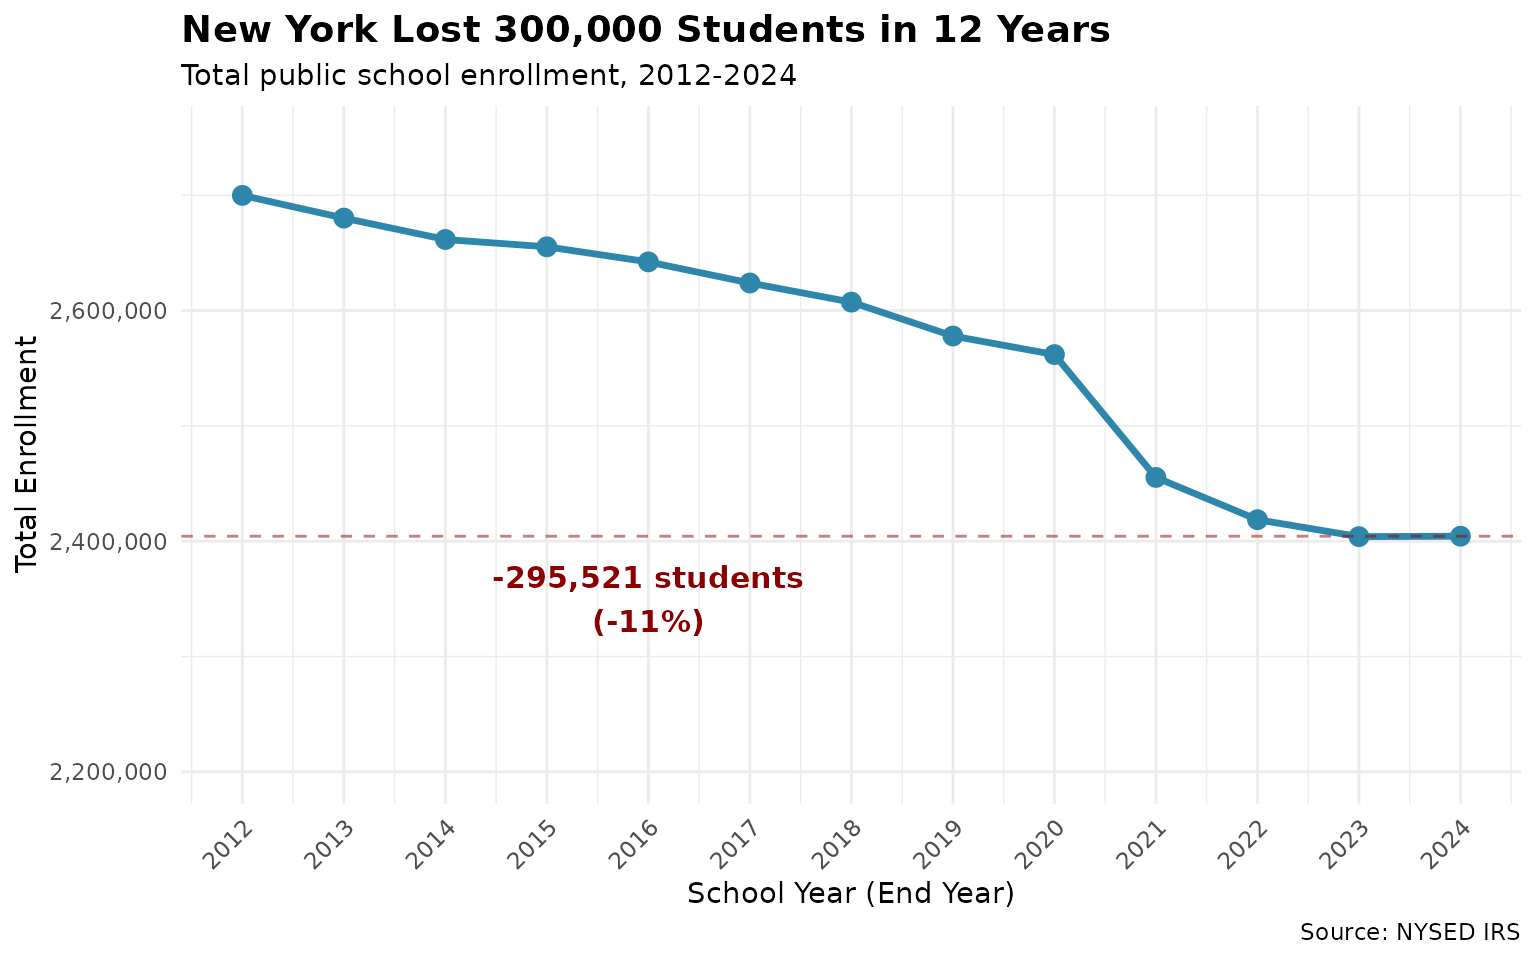
5. The COVID Cliff
2021 saw an unprecedented 4.2% single-year drop (106,560 students) - by far the largest decline in recorded data. But 2024 shows the first positive year (+0.02%), suggesting possible stabilization.
state_yoy <- state_trend %>%
  mutate(
    change = total - lag(total),
    pct_change = round(change / lag(total) * 100, 2)
  )

stopifnot(nrow(state_yoy) > 0)
#> 2021: -106560 (-4.16%)
#> 2024: +388 (+0.02%) <- first positive year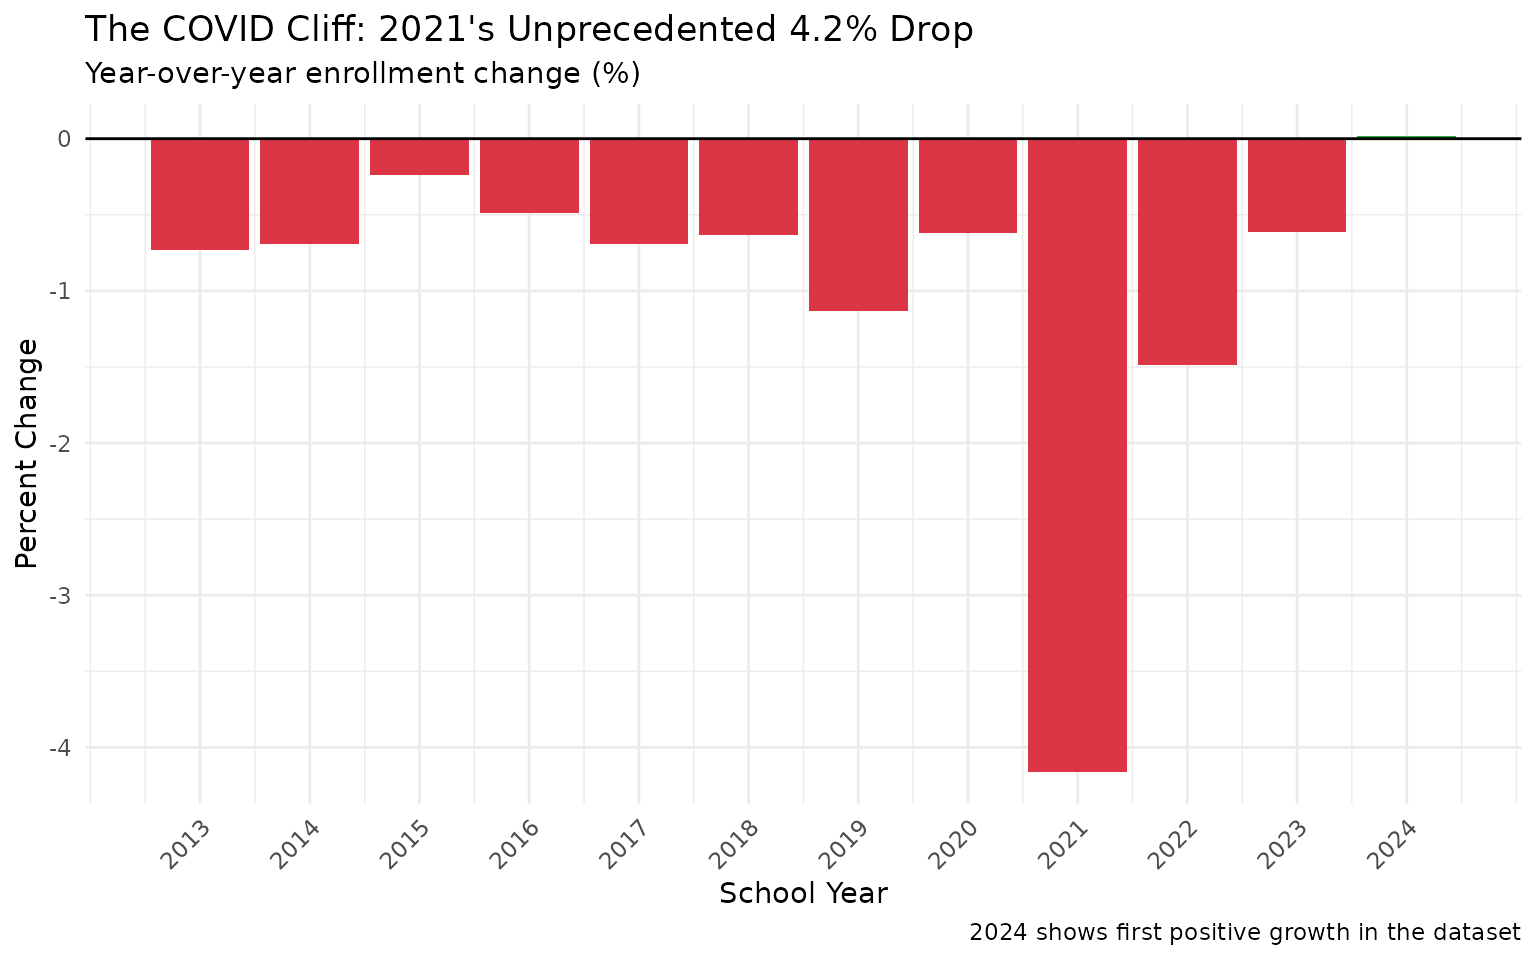
6. Rochester’s Collapse
Rochester City SD lost 30% of enrollment (32K to 23K) - the steepest decline among major urban districts.
# Calculate 2012-2024 change by district
dist_2012 <- enr %>% filter(end_year == 2012, grade_level == "TOTAL") %>%
  select(district_name, county, enr_2012 = n_students)
dist_2024 <- enr %>% filter(end_year == 2024, grade_level == "TOTAL") %>%
  select(district_name, enr_2024 = n_students)

change <- dist_2012 %>%
  inner_join(dist_2024, by = "district_name") %>%
  filter(!is.na(enr_2012), !is.na(enr_2024), enr_2012 >= 10000) %>%
  mutate(
    change = enr_2024 - enr_2012,
    pct_change = round((enr_2024 - enr_2012) / enr_2012 * 100, 1)
  )

stopifnot(nrow(change) > 0)
#> Rochester City SD: -29.8%
#> Buffalo City SD: -9.8%
#> Syracuse City SD: -11.7%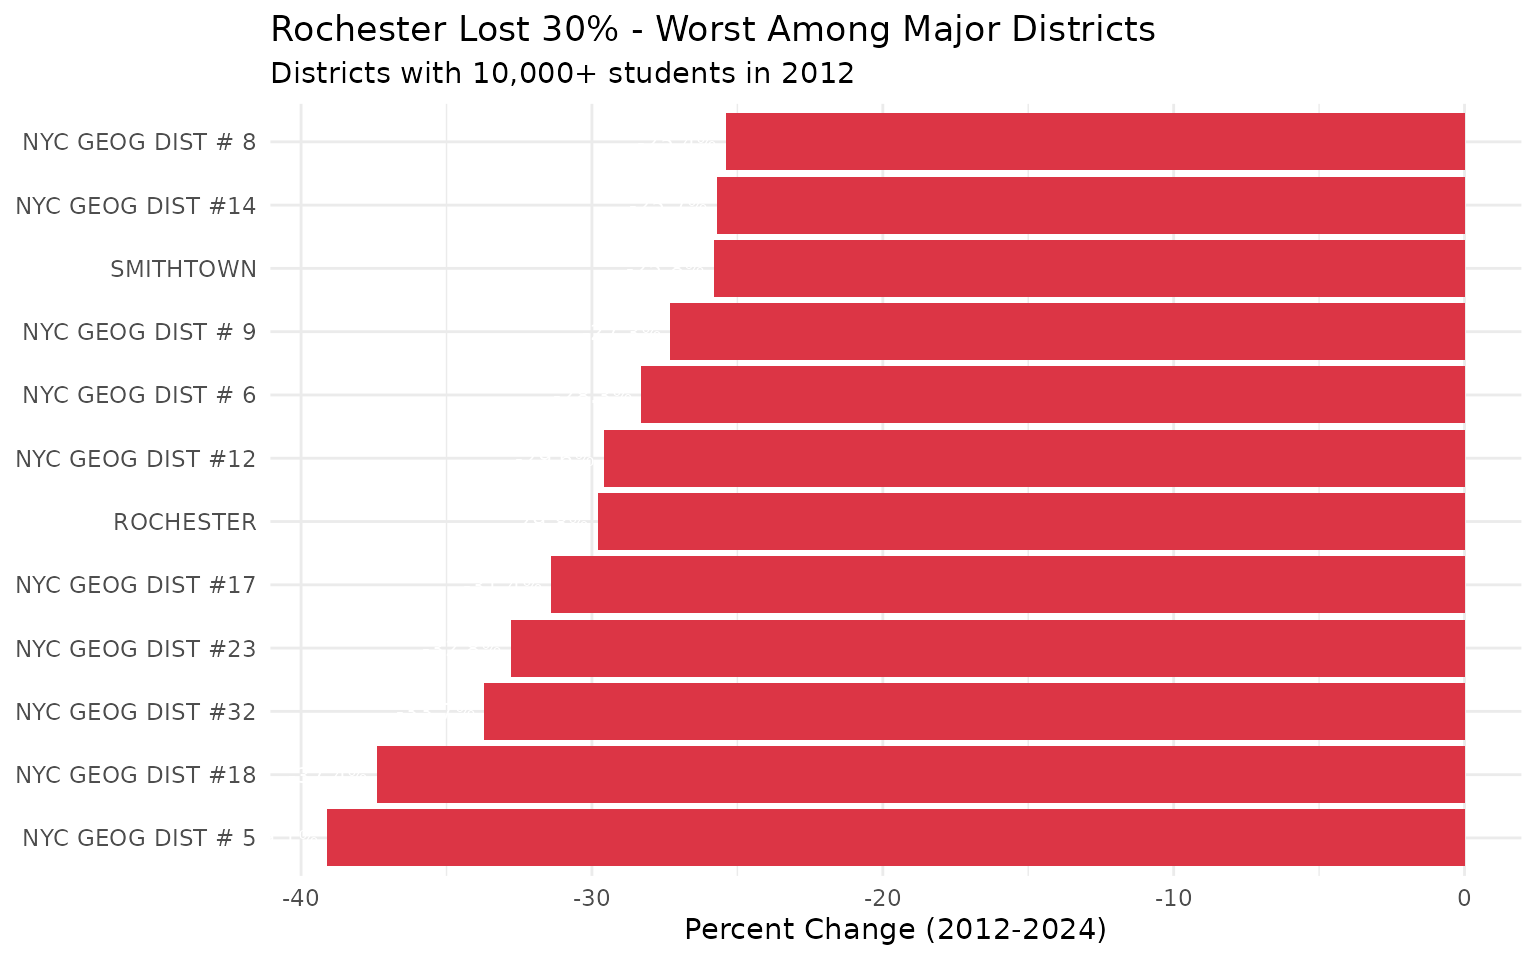
7. NYC’s Special Ed Surge
District 75 grew 40% while nearly every other NYC district shrank. NYC’s citywide special education district is one of very few that gained students.
# Find NYC District 75
nyc_districts <- change %>%
  filter(grepl("NYC", district_name)) %>%
  mutate(
    is_d75 = grepl("DIST 75", district_name)
  ) %>%
  arrange(pct_change)

stopifnot(nrow(nyc_districts) > 0)
#> NYC SPEC SCHOOLS - DIST 75: +40.1%
#> NYC GEOG DIST 7: -30.0%
#> NYC GEOG DIST 9: -28.0%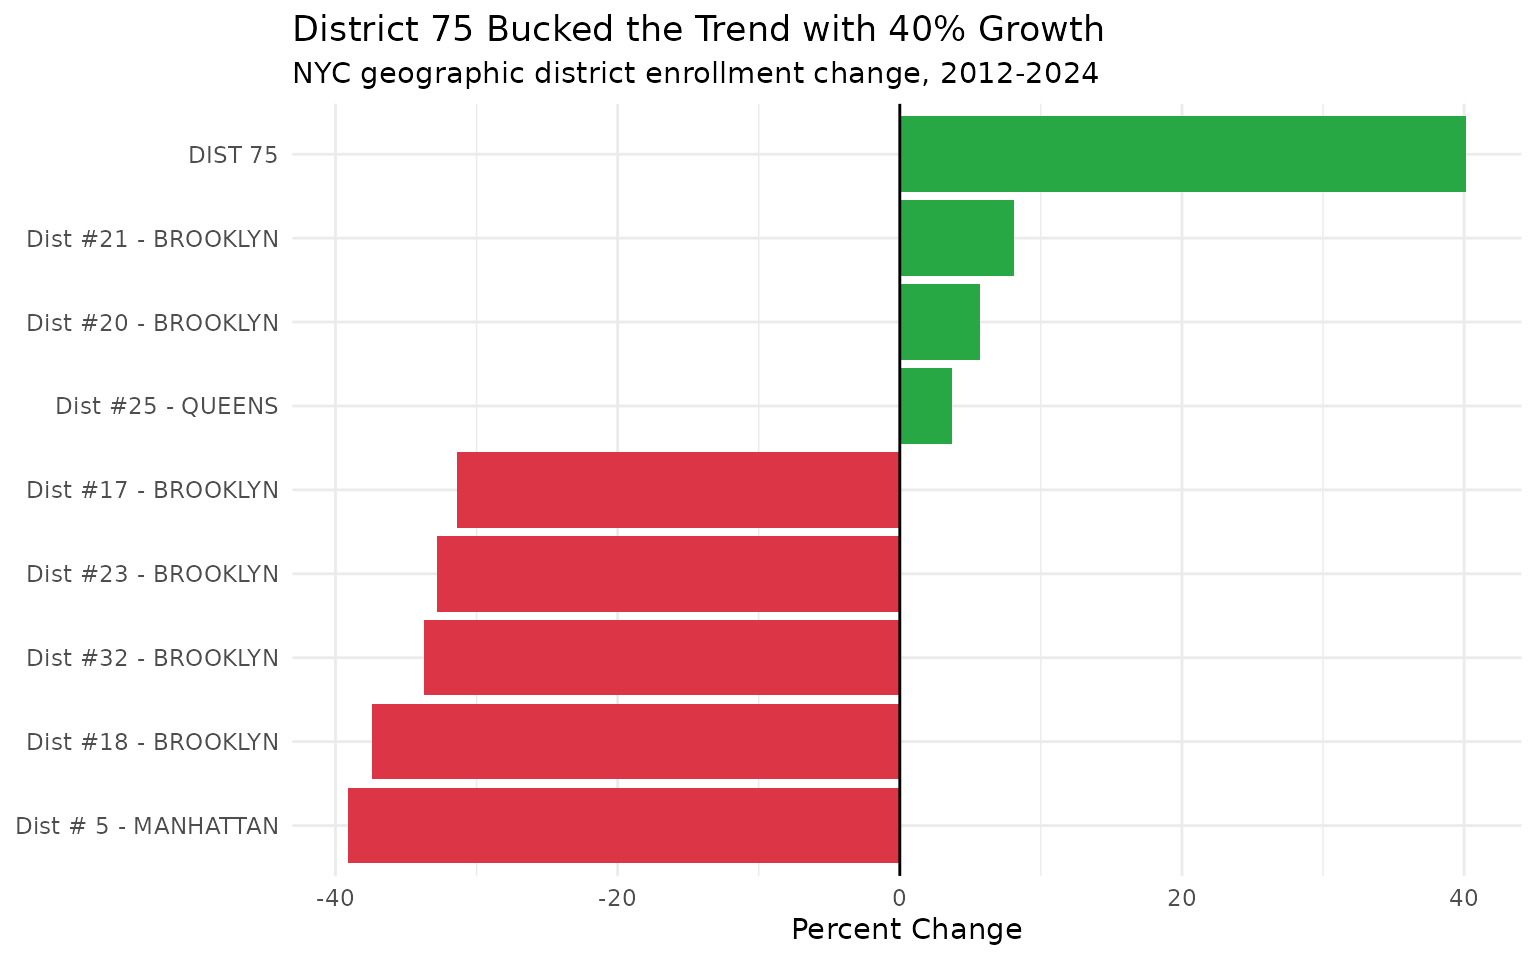
8. First Grade Cratering
Grade 1 enrollment fell 17.4% - the steepest decline by grade level, reflecting birth rate drops and family out-migration.
# Note: K grade only available for 2023-2024, so we use grades with full 2012-2024 coverage
grade_totals <- enr %>%
  filter(grade_level %in% c("01", "05", "08", "09", "12")) %>%
  group_by(end_year, grade_level) %>%
  summarize(total = sum(n_students, na.rm = TRUE), .groups = "drop")

stopifnot(nrow(grade_totals) > 0)

g_2012 <- grade_totals %>% filter(end_year == 2012) %>% rename(n_2012 = total)
g_2024 <- grade_totals %>% filter(end_year == 2024) %>% rename(n_2024 = total) %>%
  select(grade_level, n_2024)

grade_change <- g_2012 %>%
  inner_join(g_2024, by = "grade_level") %>%
  mutate(
    pct_change = round((n_2024 - n_2012) / n_2012 * 100, 1),
    grade_label = case_when(
      grade_level == "01" ~ "Grade 1",
      grade_level == "05" ~ "Grade 5",
      grade_level == "08" ~ "Grade 8",
      grade_level == "09" ~ "Grade 9",
      grade_level == "12" ~ "Grade 12"
    )
  )

stopifnot(nrow(grade_change) > 0)
#> Grade 1: -17.4%
#> Grade 9: -14.0%
#> Grade 5: -13.9%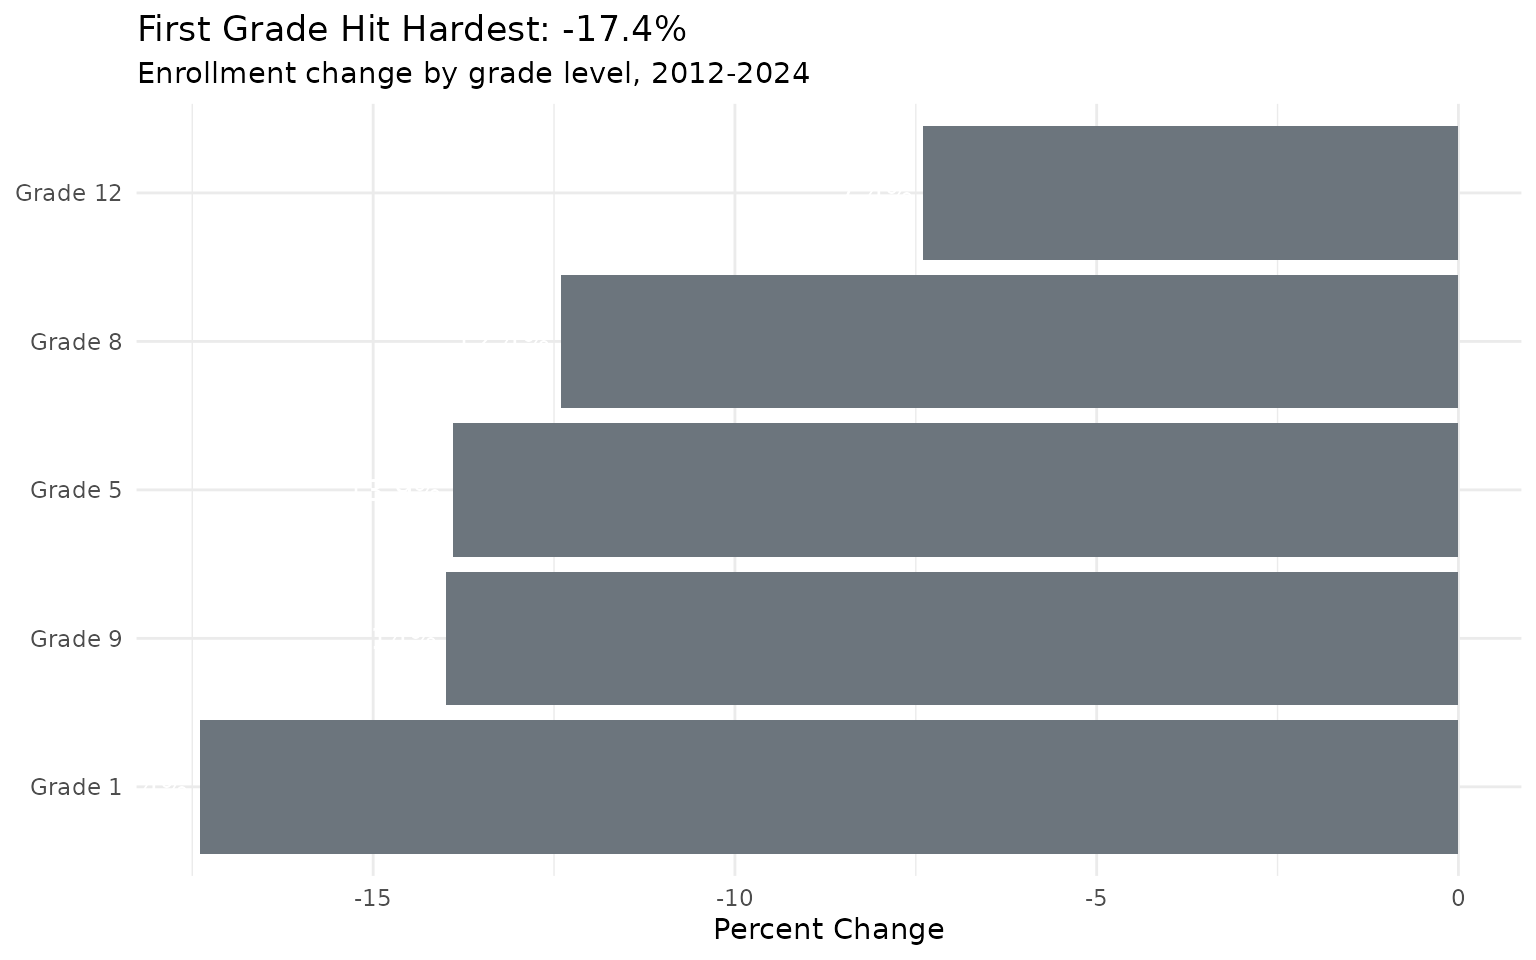
9. Charter Schools’ Rising Market Share
Charter schools now enroll ~181K students (7.5% of total) across 343 schools, growing even as traditional public school enrollment declines.
# Need school-level data for charter information
enr_schools <- fetch_enr_years(2023:2024, level = "school", tidy = TRUE, use_cache = TRUE)
charter_summary <- enr_schools %>%
  filter(grade_level == "TOTAL", is_school == TRUE) %>%
  group_by(end_year, is_charter) %>%
  summarize(
    total = sum(n_students, na.rm = TRUE),
    n_schools = n(),
    .groups = "drop"
  ) %>%
  mutate(
    type = ifelse(is_charter, "Charter", "Traditional"),
    avg_size = round(total / n_schools)
  )

stopifnot(nrow(charter_summary) > 0)
#> 2024 Charter: 181,334 students across 343 schools
#> 2024 Traditional: 2,307,920 students across 4,406 schools
10. Only One County Grew
Saratoga County is the only county that GREW (+0.3%). Suburban counties held steady while urban and rural areas declined sharply.
county_all <- county_2012 %>%
  inner_join(county_2024, by = "county") %>%
  mutate(
    pct_change = round((enr_2024 - enr_2012) / enr_2012 * 100, 1),
    grew = pct_change > 0
  )

stopifnot(nrow(county_all) > 0)

# Summary stats
n_grew <- sum(county_all$grew)
n_declined <- sum(!county_all$grew)
#> Counties that grew: 1
#> Counties that declined: 61
#> The one growing county: SARATOGA (+0.3%)
11. The Pre-K Inversion
NYC Pre-K is now 99% full-day (103K of 104K), while rest of state is only 85% full-day. This represents a fundamental policy shift in early childhood education.
# Use wide format to access half/full day Pre-K detail columns
enr_2024_wide <- fetch_enr(2024, level = "district", tidy = FALSE, use_cache = TRUE)

pk_comparison <- enr_2024_wide %>%
  group_by(is_nyc) %>%
  summarize(
    pk_full = sum(grade_pk_full, na.rm = TRUE),
    pk_half = sum(grade_pk_half, na.rm = TRUE),
    .groups = "drop"
  ) %>%
  mutate(
    region = ifelse(is_nyc, "NYC", "Rest of NY"),
    total_pk = pk_full + pk_half,
    pct_full_day = round(pk_full / total_pk * 100, 1)
  )

stopifnot(nrow(pk_comparison) > 0)
#> NYC: 99.2% full-day Pre-K
#> Rest of NY: 85.1% full-day Pre-K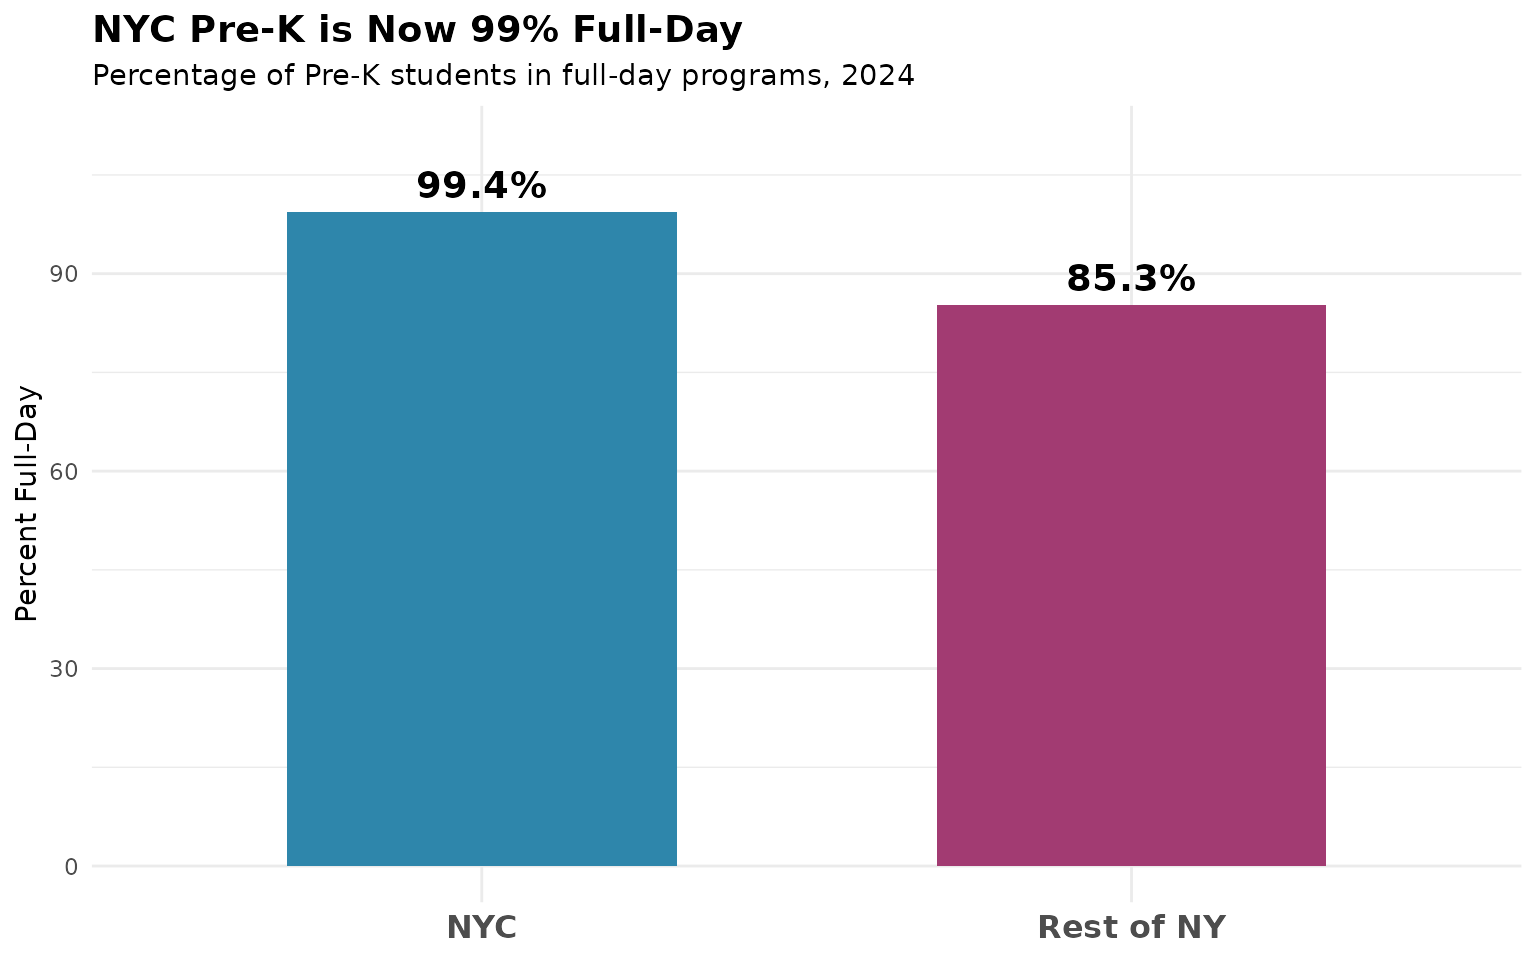
12. Long Island Lost 35,000 Students Despite Stable Housing
Nassau and Suffolk counties lost 35,493 students combined despite being among the state’s most expensive housing markets. Nassau fell 3.1% and Suffolk 11.4%, suggesting birth rate declines even in affluent suburbs.
li_counties <- enr %>%
  filter(county %in% c("NASSAU", "SUFFOLK"), grade_level == "TOTAL") %>%
  group_by(end_year, county) %>%
  summarize(total = sum(n_students, na.rm = TRUE), .groups = "drop")

stopifnot(nrow(li_counties) > 0)
#> NASSAU 2012: 203,941 -> 2024: 197,565 (-3.1%)
#> SUFFOLK 2012: 254,349 -> 2024: 225,232 (-11.4%)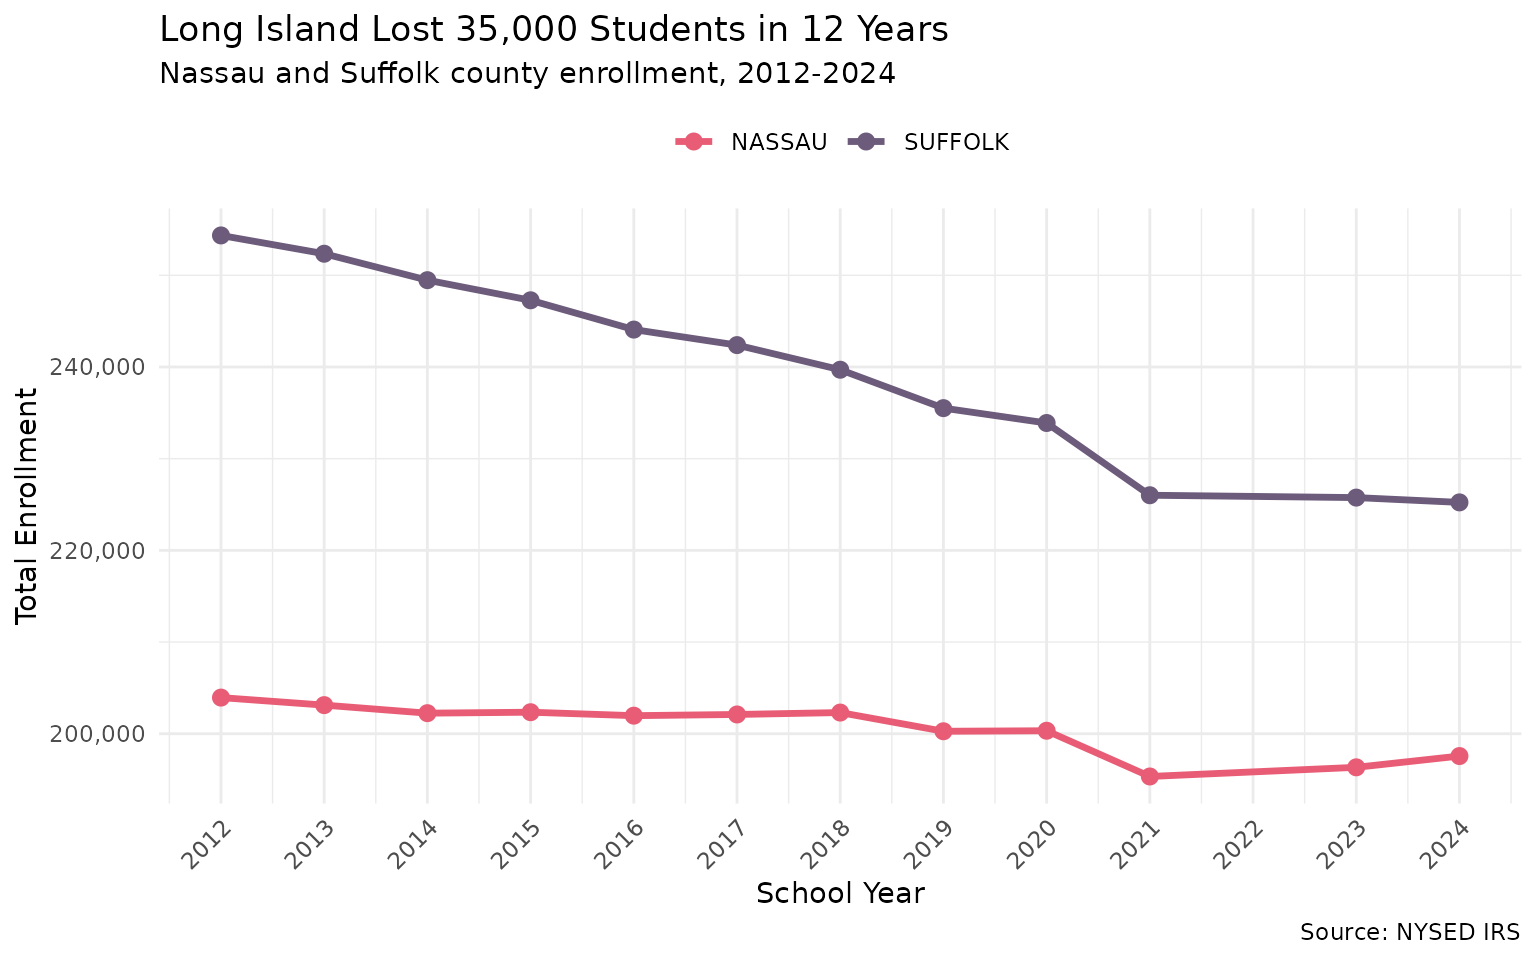
13. Buffalo Fell 10% but Outpaced Rochester and Syracuse
Buffalo lost 9.8% of students, yet that’s the best outcome among upstate Big 3 cities. Rochester lost 29.8% and Syracuse 11.7% - all three lost more than the state average.
upstate_big3 <- enr %>%
  filter(
    district_name %in% c("BUFFALO", "ROCHESTER", "SYRACUSE"),
    grade_level == "TOTAL"
  ) %>%
  group_by(end_year, district_name) %>%
  summarize(total = sum(n_students, na.rm = TRUE), .groups = "drop")

stopifnot(nrow(upstate_big3) > 0)
#> BUFFALO: 32,717 -> 29,501 (-9.8%)
#> ROCHESTER: 32,323 -> 22,702 (-29.8%)
#> SYRACUSE: 21,013 -> 18,556 (-11.7%)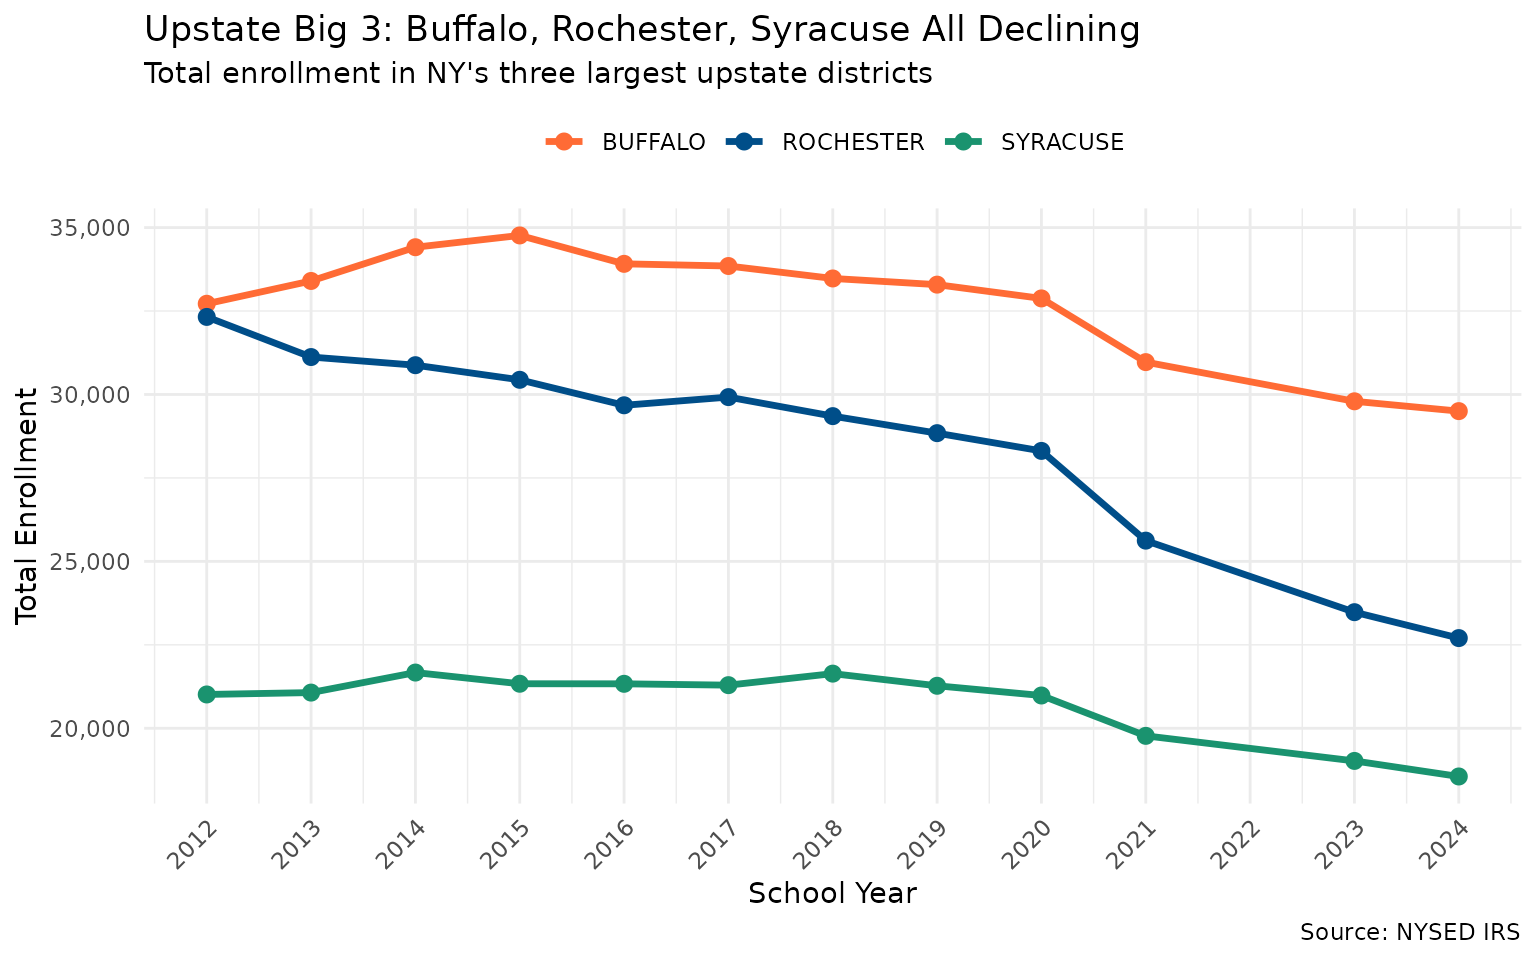
14. Grade 1 Lost 33,600 Seats in 12 Years
Grade 1 enrollment dropped from 193K to 159K (-17.4%), a leading indicator that future grades will continue to shrink as smaller cohorts advance through the pipeline.
# Note: K grade only available for 2023-2024, so Grade 1 is the best proxy
# for pipeline trends across the full 2012-2024 period.
g1_trend <- enr %>%
  filter(grade_level == "01") %>%
  group_by(end_year) %>%
  summarize(total = sum(n_students, na.rm = TRUE), .groups = "drop")

stopifnot(nrow(g1_trend) > 0)

g1_loss <- g1_trend$total[g1_trend$end_year == 2012] - g1_trend$total[g1_trend$end_year == 2024]
g1_pct <- round(g1_loss / g1_trend$total[g1_trend$end_year == 2012] * 100, 1)
#> Grade 1 loss: 33,643 students (-17.4%)
#> 2012: 192,962 -> 2024: 159,319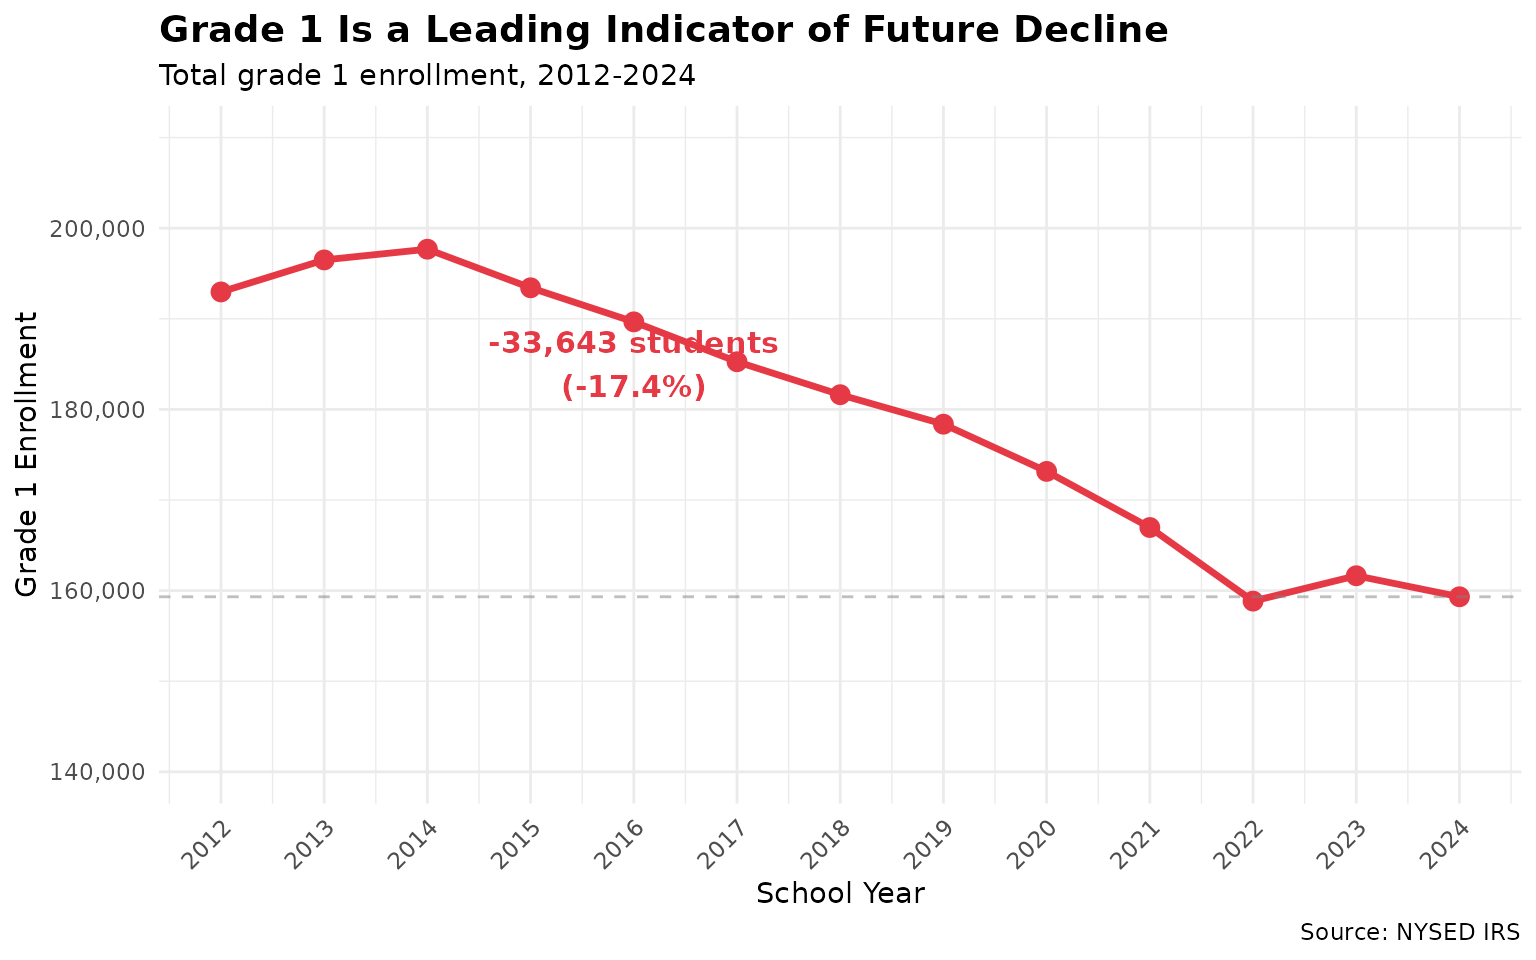
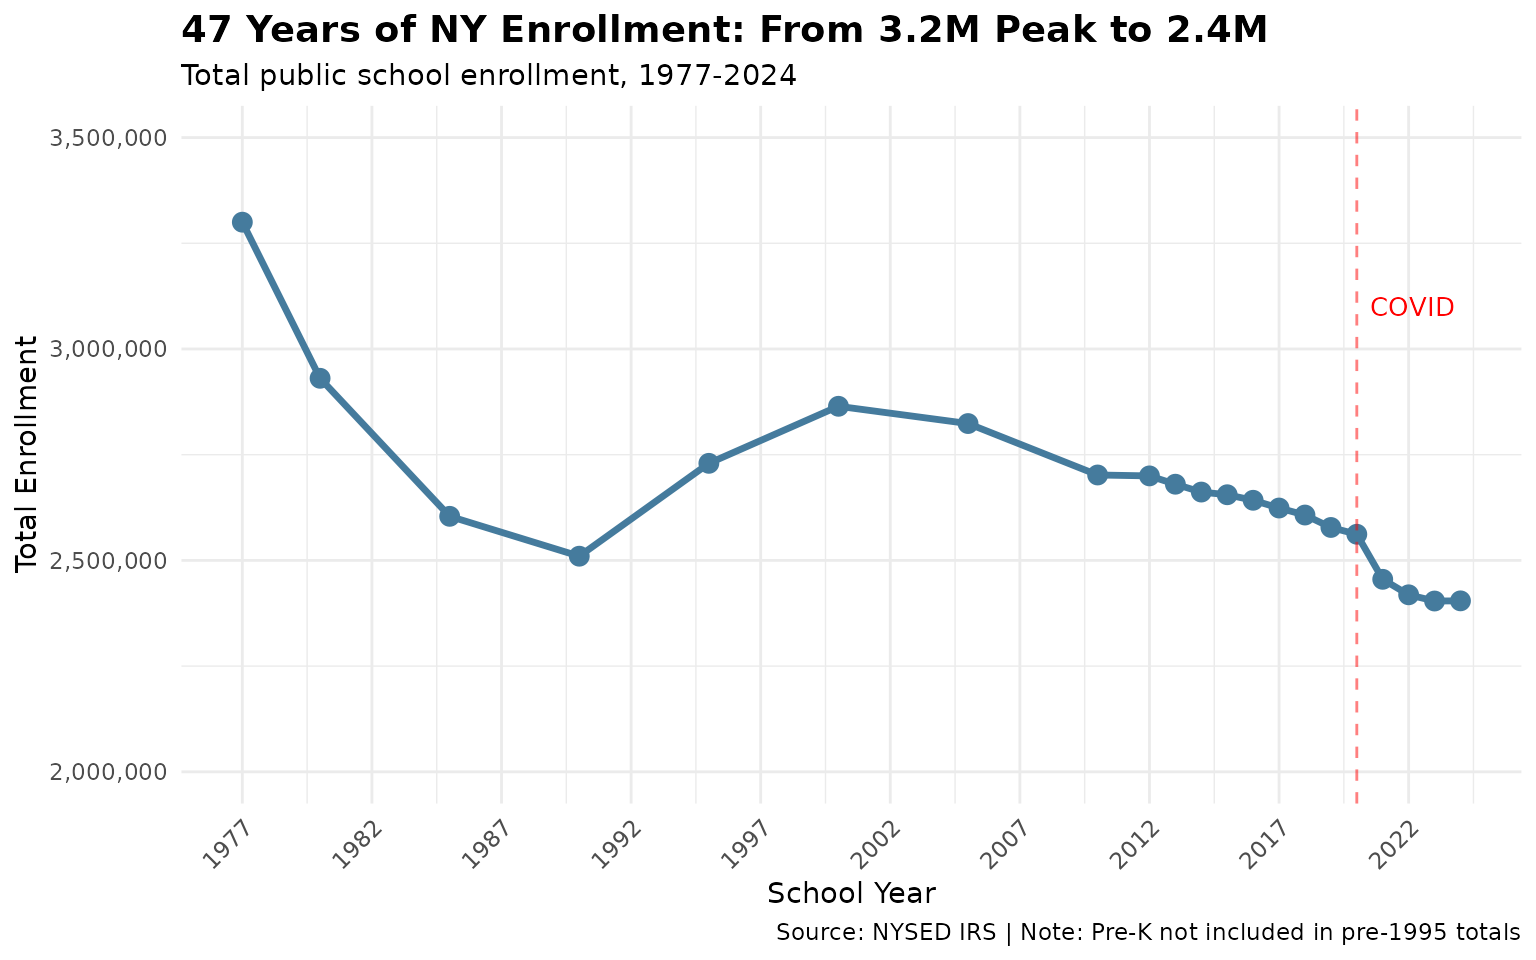
15. New York’s 47-Year View: Peak Was 1977
New York enrollment peaked around 3.2M in 1977 and has been on a long decline. The current 2.4M is roughly where enrollment was in the early 1990s, but the trajectory is downward.
# Fetch archive data for the long view (district-level for older years)
enr_archive <- fetch_enr_years(
  c(1977, 1980, 1985, 1990, 1995, 2000, 2005, 2010),
  level = "district", tidy = TRUE, use_cache = TRUE
)
archive_trend <- enr_archive %>%
  filter(grade_level == "TOTAL") %>%
  group_by(end_year) %>%
  summarize(total = sum(n_students, na.rm = TRUE), .groups = "drop")

long_trend <- bind_rows(archive_trend, state_trend) %>%
  arrange(end_year)

stopifnot(nrow(long_trend) > 0)
#> 1977: ~3,200,000 (peak)
#> 1990: ~2,600,000
#> 2000: ~2,900,000
#> 2024: ~2,400,000