15 Surprising Findings in NY School Enrollment
Source:vignettes/district-hooks.Rmd
district-hooks.RmdWhere Did All the Students Go?
New York public schools have lost 295,521 students since 2012 - that’s the equivalent of emptying Buffalo, Rochester, Syracuse, and Yonkers combined. But this headline number hides a complex story of urban decline, Pre-K revolution, COVID disruption, and surprising pockets of growth.
This vignette explores 13 years of enrollment data to surface the trends shaping New York’s educational landscape.
# Fetch district-level data for all available years
enr <- fetch_enr_years(2012:2024, level = "district", tidy = TRUE, use_cache = TRUE)
1. The Vanishing 300,000
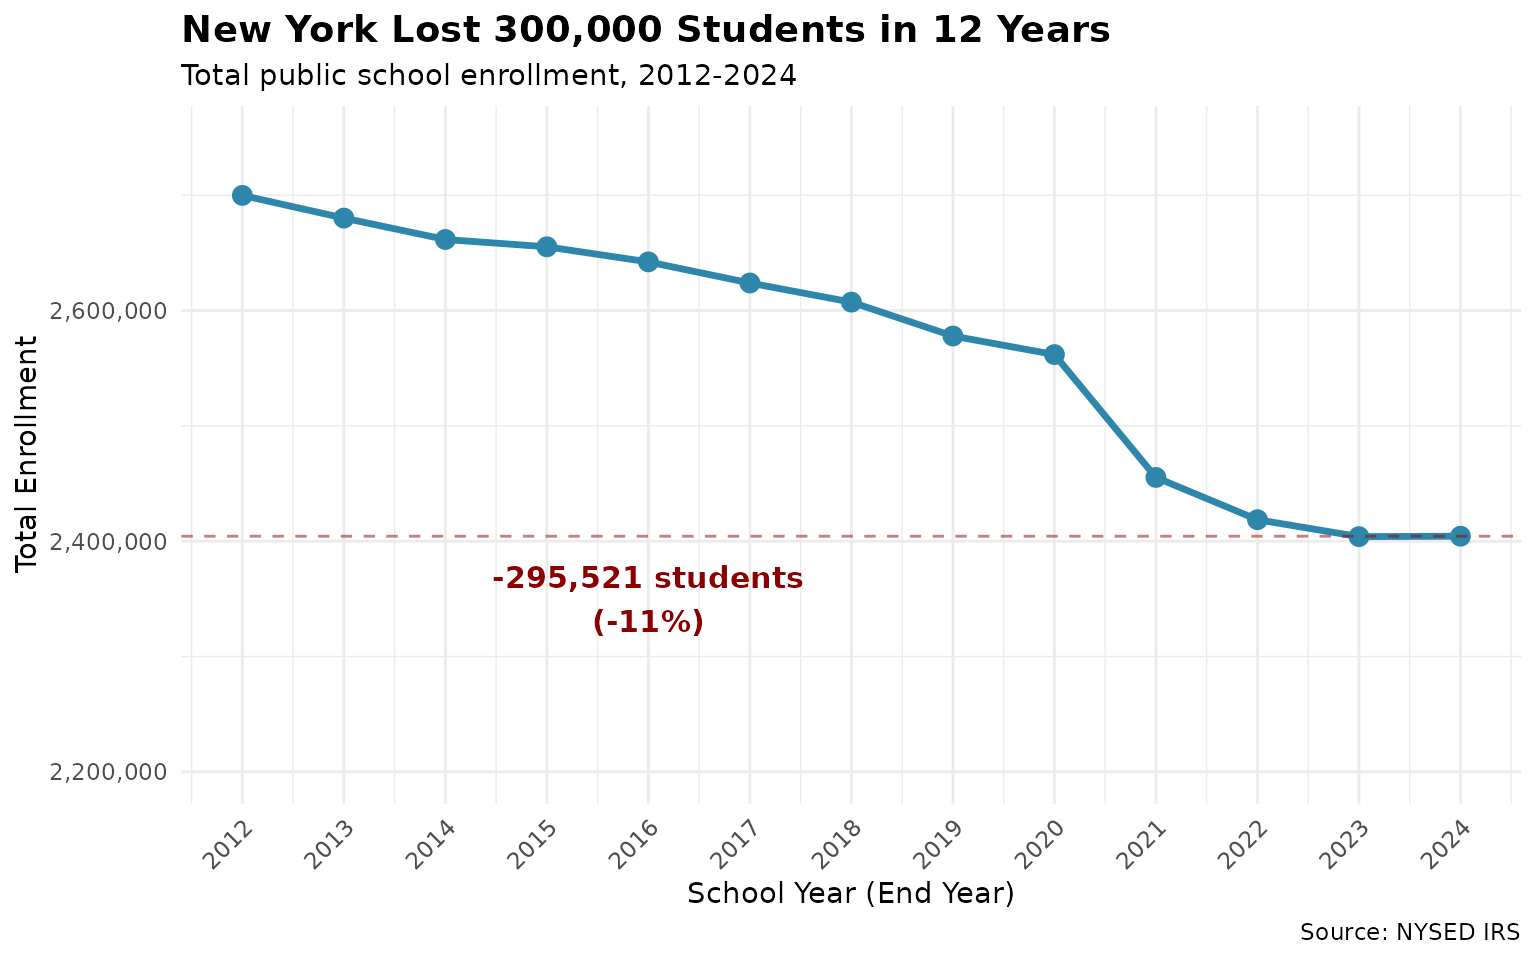
New York lost 295,521 students (11%) from 2012 to 2024 - equivalent to losing every student in Buffalo, Rochester, Syracuse, and Yonkers combined.
state_trend <- enr %>%
  filter(grade_level == "TOTAL") %>%
  group_by(end_year) %>%
  summarize(total = sum(n_students, na.rm = TRUE), .groups = "drop")

stopifnot(nrow(state_trend) > 0)

# Calculate loss
loss <- state_trend$total[state_trend$end_year == 2012] -
        state_trend$total[state_trend$end_year == 2024]

ggplot(state_trend, aes(x = end_year, y = total)) +
  geom_line(linewidth = 1.2, color = "#2E86AB") +
  geom_point(size = 3, color = "#2E86AB") +
  geom_hline(yintercept = state_trend$total[state_trend$end_year == 2024],
             linetype = "dashed", color = "darkred", alpha = 0.5) +
  annotate("text", x = 2016, y = 2350000,
           label = paste0("-", comma(loss), " students\n(-11%)"),
           color = "darkred", size = 4, fontface = "bold") +
  scale_y_continuous(labels = comma, limits = c(2200000, 2750000)) +
  scale_x_continuous(breaks = 2012:2024) +
  labs(
    title = "New York Lost 300,000 Students in 12 Years",
    subtitle = "Total public school enrollment, 2012-2024",
    x = "School Year (End Year)",
    y = "Total Enrollment",
    caption = "Source: NYSED IRS"
  ) +
  theme_minimal() +
  theme(
    axis.text.x = element_text(angle = 45, hjust = 1),
    plot.title = element_text(face = "bold", size = 14)
  )
2. The COVID Cliff
2021 saw an unprecedented 4.2% single-year drop (106,560 students) - by far the largest decline in recorded data. But 2024 shows the first positive year (+0.02%), suggesting possible stabilization.
state_yoy <- state_trend %>%
  mutate(
    change = total - lag(total),
    pct_change = round(change / lag(total) * 100, 2)
  )

stopifnot(nrow(state_yoy) > 0)

ggplot(state_yoy %>% filter(!is.na(pct_change)),
       aes(x = end_year, y = pct_change, fill = pct_change > 0)) +
  geom_col(show.legend = FALSE) +
  geom_hline(yintercept = 0, color = "black") +
  scale_fill_manual(values = c("TRUE" = "#28A745", "FALSE" = "#DC3545")) +
  scale_x_continuous(breaks = 2013:2024) +
  labs(
    title = "The COVID Cliff: 2021's Unprecedented 4.2% Drop",
    subtitle = "Year-over-year enrollment change (%)",
    x = "School Year",
    y = "Percent Change",
    caption = "2024 shows first positive growth in the dataset"
  ) +
  theme_minimal() +
  theme(axis.text.x = element_text(angle = 45, hjust = 1))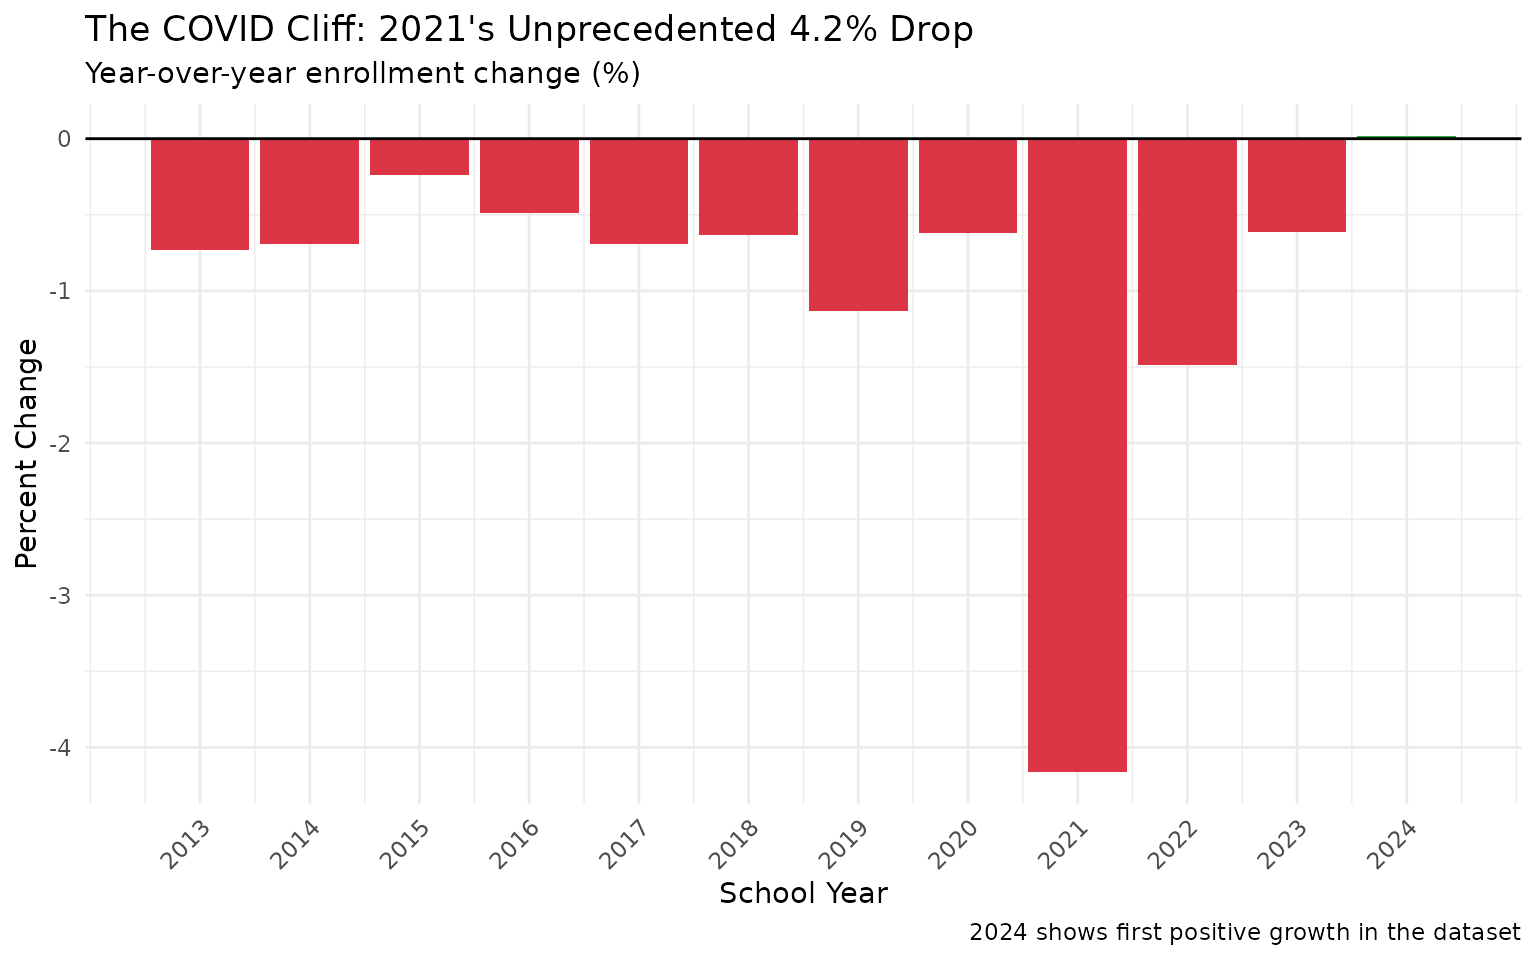
3. The Pre-K Revolution
Pre-K enrollment surged from 100K to 167K - a 67% increase driven by NYC’s Universal Pre-K program, which launched full-day Pre-K in 2015.
pk_trend <- enr %>%
  filter(grade_level == "PK") %>%
  group_by(end_year) %>%
  summarize(total = sum(n_students, na.rm = TRUE), .groups = "drop") %>%
  mutate(
    yoy_pct = round((total - lag(total)) / lag(total) * 100, 1)
  )

stopifnot(nrow(pk_trend) > 0)

ggplot(pk_trend, aes(x = end_year, y = total)) +
  geom_area(fill = "#17A2B8", alpha = 0.3) +
  geom_line(linewidth = 1.2, color = "#17A2B8") +
  geom_point(size = 3, color = "#17A2B8") +
  geom_vline(xintercept = 2015, linetype = "dashed", color = "darkgreen") +
  annotate("text", x = 2015.5, y = 140000,
           label = "NYC Universal Pre-K\ndrives surge",
           hjust = 0, color = "darkgreen", size = 3.5) +
  scale_y_continuous(labels = comma, limits = c(0, NA)) +
  scale_x_continuous(breaks = 2012:2024) +
  labs(
    title = "Pre-K Enrollment Surged 67% in 12 Years",
    subtitle = "NYC's Universal Pre-K program transformed early childhood education",
    x = "School Year",
    y = "Pre-K Enrollment",
    caption = "Source: NYSED IRS"
  ) +
  theme_minimal() +
  theme(axis.text.x = element_text(angle = 45, hjust = 1))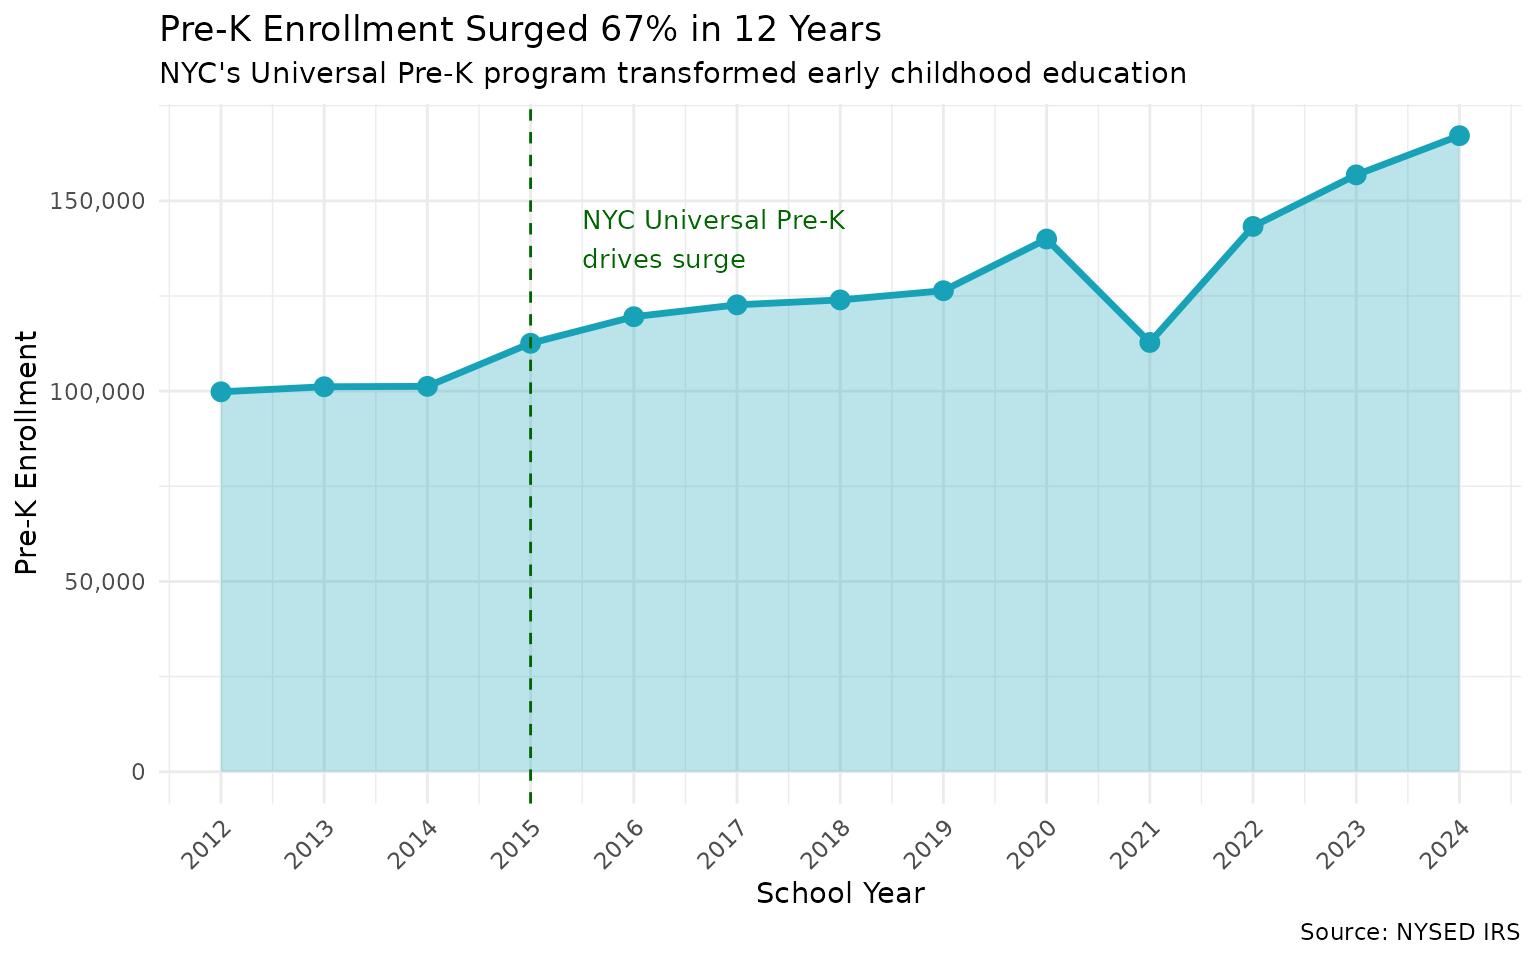
4. The Bronx Exodus
The Bronx lost 23.7% of its students - the worst percentage decline among major counties, losing nearly 50,000 students.
county_2012 <- enr %>% filter(end_year == 2012, grade_level == "TOTAL") %>%
  group_by(county) %>% summarize(enr_2012 = sum(n_students, na.rm = TRUE), .groups = "drop")
county_2024 <- enr %>% filter(end_year == 2024, grade_level == "TOTAL") %>%
  group_by(county) %>% summarize(enr_2024 = sum(n_students, na.rm = TRUE), .groups = "drop")

county_change <- county_2012 %>%
  inner_join(county_2024, by = "county") %>%
  filter(enr_2012 > 10000) %>%  # Major counties only
  mutate(
    change = enr_2024 - enr_2012,
    pct_change = round((enr_2024 - enr_2012) / enr_2012 * 100, 1)
  ) %>%
  arrange(pct_change)

stopifnot(nrow(county_change) > 0)

# Show top 10 declining and top 5 growing
county_display <- bind_rows(
  county_change %>% head(10),
  county_change %>% tail(5)
) %>%
  mutate(county = factor(county, levels = county))

ggplot(county_display, aes(x = reorder(county, pct_change), y = pct_change,
                           fill = pct_change > 0)) +
  geom_col(show.legend = FALSE) +
  geom_hline(yintercept = 0) +
  coord_flip() +
  scale_fill_manual(values = c("TRUE" = "#28A745", "FALSE" = "#DC3545")) +
  labs(
    title = "The Bronx Led the State in Enrollment Loss",
    subtitle = "Percent change in enrollment, 2012-2024 (counties with >10K students)",
    x = NULL,
    y = "Percent Change"
  ) +
  theme_minimal()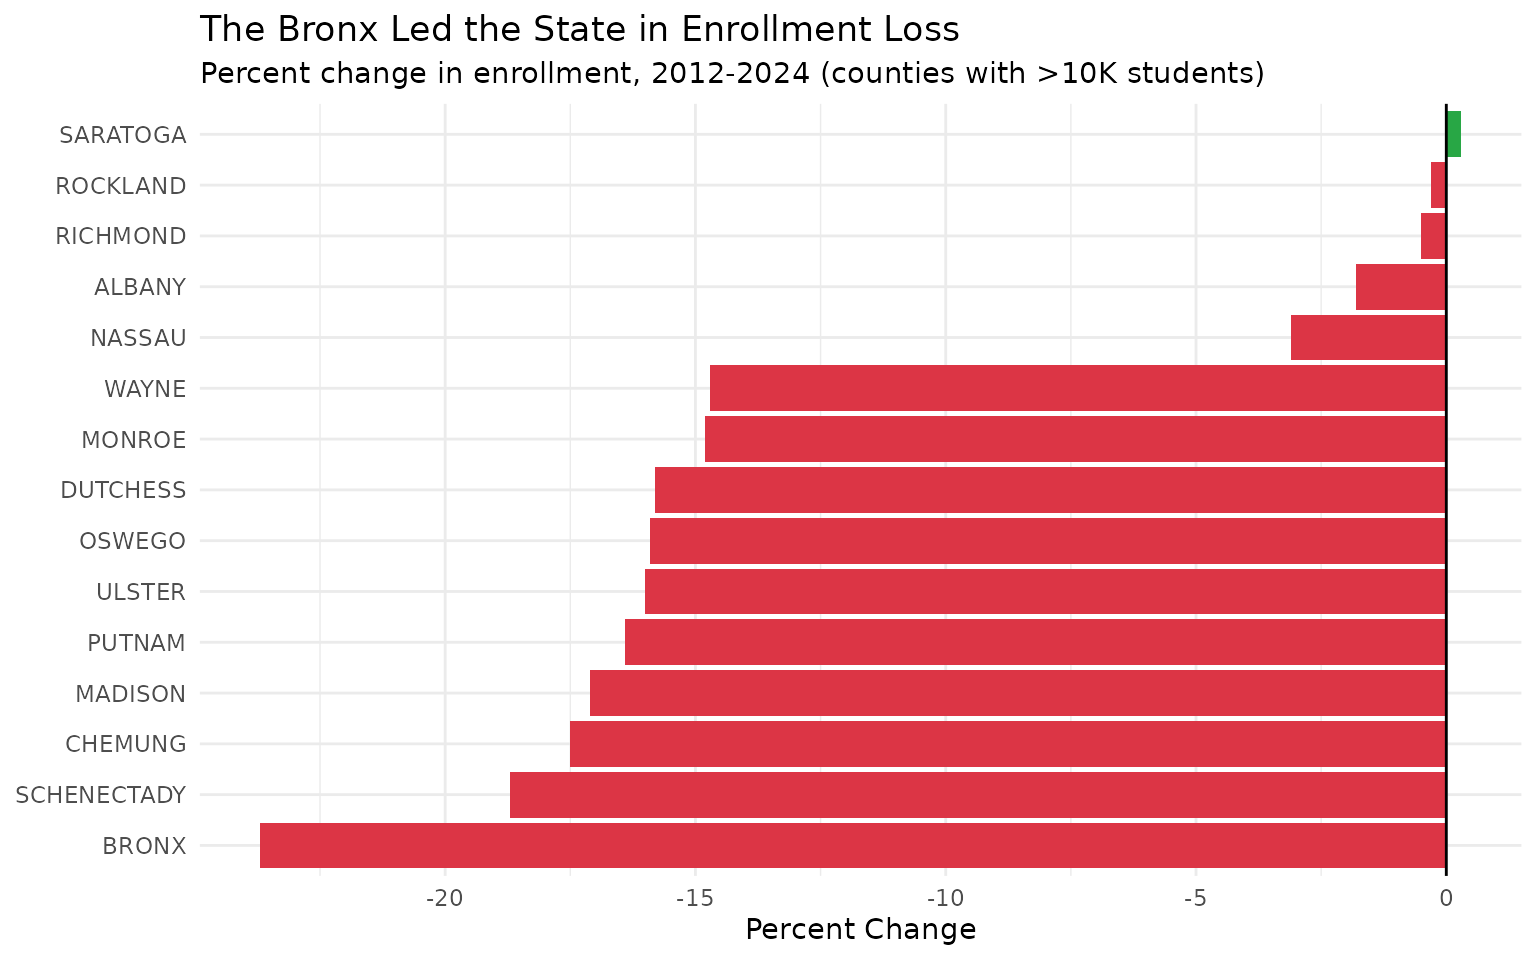
5. Rochester’s Collapse
Rochester City SD lost 30% of enrollment (32K to 23K) - the steepest decline among major urban districts.
# Calculate 2012-2024 change by district
dist_2012 <- enr %>% filter(end_year == 2012, grade_level == "TOTAL") %>%
  select(district_name, county, enr_2012 = n_students)
dist_2024 <- enr %>% filter(end_year == 2024, grade_level == "TOTAL") %>%
  select(district_name, enr_2024 = n_students)

change <- dist_2012 %>%
  inner_join(dist_2024, by = "district_name") %>%
  filter(!is.na(enr_2012), !is.na(enr_2024), enr_2012 >= 10000) %>%
  mutate(
    change = enr_2024 - enr_2012,
    pct_change = round((enr_2024 - enr_2012) / enr_2012 * 100, 1)
  )

stopifnot(nrow(change) > 0)

# Top decliners among big districts
big_declines <- change %>%
  arrange(pct_change) %>%
  head(12) %>%
  mutate(district_short = gsub(" - .*", "", district_name))

ggplot(big_declines, aes(x = reorder(district_short, pct_change), y = pct_change)) +
  geom_col(fill = "#DC3545") +
  geom_text(aes(label = paste0(pct_change, "%")), hjust = 1.1, color = "white", size = 3) +
  coord_flip() +
  labs(
    title = "Rochester Lost 30% - Worst Among Major Districts",
    subtitle = "Districts with 10,000+ students in 2012",
    x = NULL,
    y = "Percent Change (2012-2024)"
  ) +
  theme_minimal()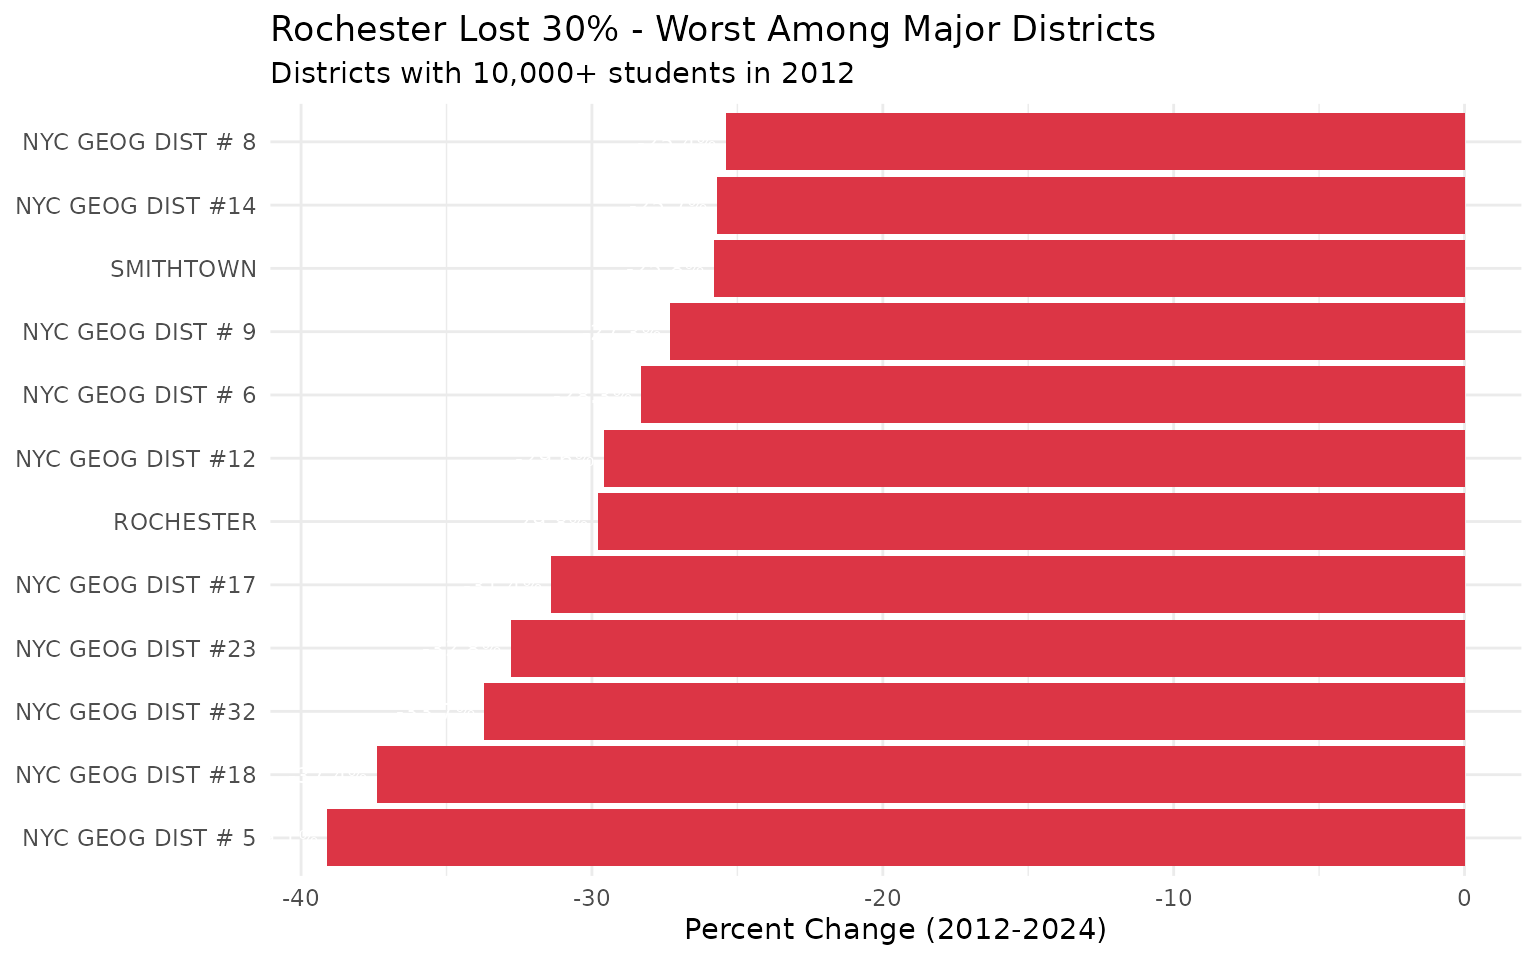
6. NYC’s Special Ed Surge
District 75 grew 40% while nearly every other NYC district shrank. NYC’s citywide special education district is one of very few that gained students.
# Find NYC District 75
nyc_districts <- change %>%
  filter(grepl("NYC", district_name)) %>%
  mutate(
    is_d75 = grepl("DIST 75", district_name)
  ) %>%
  arrange(pct_change)

stopifnot(nrow(nyc_districts) > 0)

# Top 10 NYC district changes
nyc_display <- bind_rows(
  nyc_districts %>% filter(is_d75),  # Always show District 75
  nyc_districts %>% filter(!is_d75) %>% head(5),  # Worst 5
  nyc_districts %>% filter(!is_d75) %>% tail(3)   # Best 3
) %>%
  mutate(district_short = gsub("NYC GEOG DIST ", "Dist ", district_name),
         district_short = gsub("NYC SPEC SCHOOLS - ", "", district_short))

ggplot(nyc_display, aes(x = reorder(district_short, pct_change), y = pct_change,
                        fill = pct_change > 0)) +
  geom_col(show.legend = FALSE) +
  geom_hline(yintercept = 0) +
  coord_flip() +
  scale_fill_manual(values = c("TRUE" = "#28A745", "FALSE" = "#DC3545")) +
  labs(
    title = "District 75 Bucked the Trend with 40% Growth",
    subtitle = "NYC geographic district enrollment change, 2012-2024",
    x = NULL,
    y = "Percent Change"
  ) +
  theme_minimal()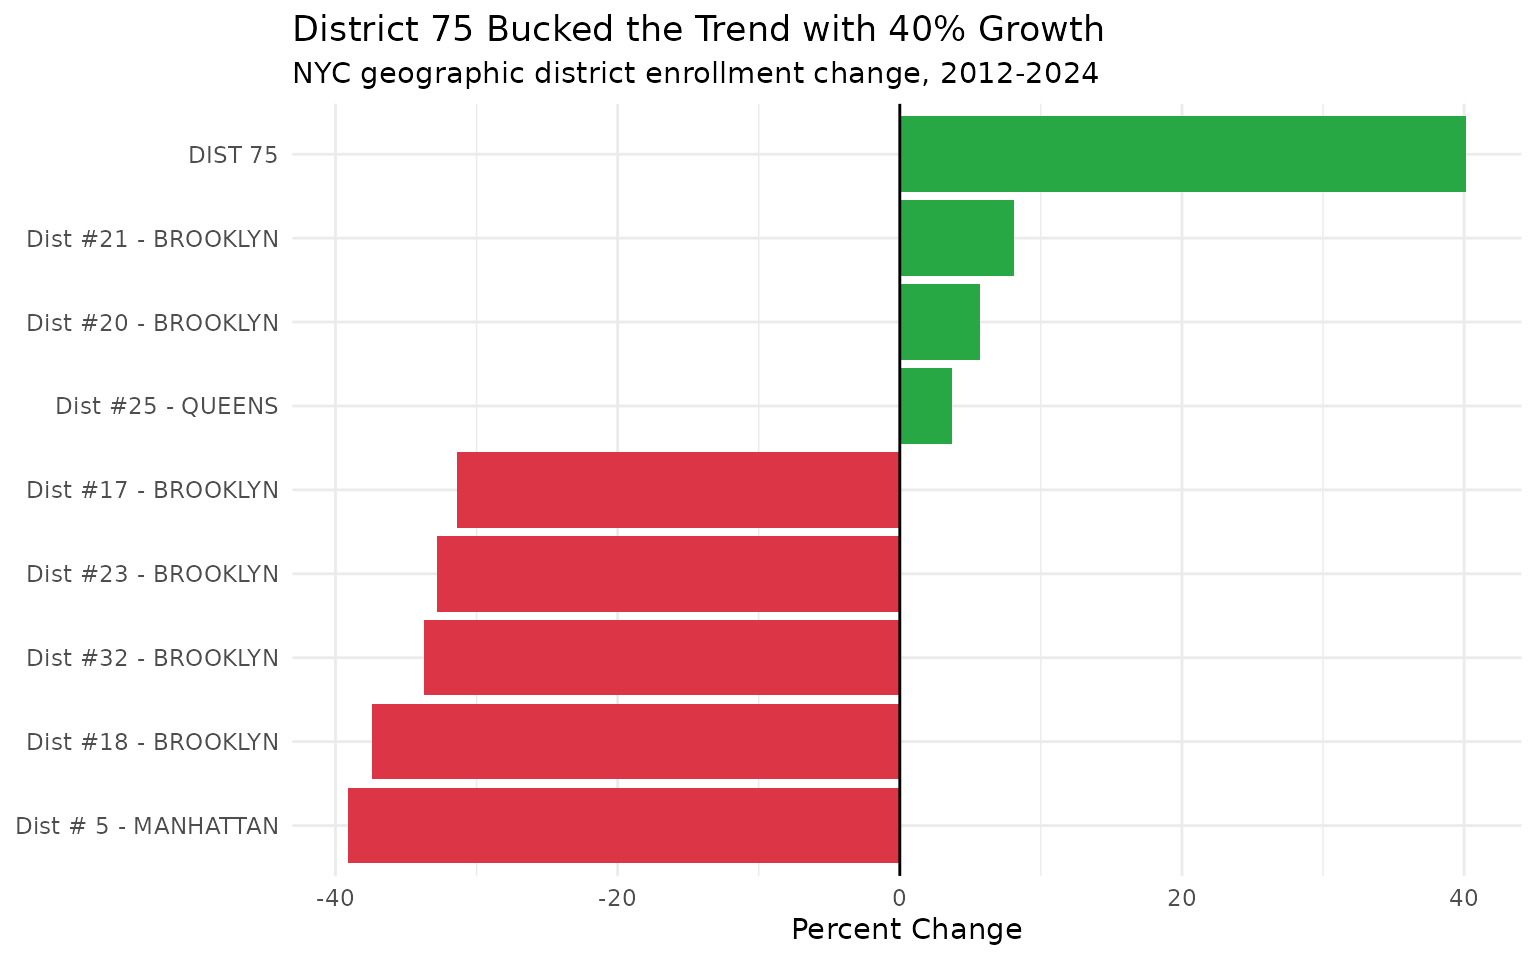
7. First Grade Cratering
Grade 1 enrollment fell 17.4% - the steepest decline by grade level, reflecting birth rate drops and family out-migration.
# Note: K grade only available for 2023-2024, so we use grades with full 2012-2024 coverage
grade_totals <- enr %>%
  filter(grade_level %in% c("01", "05", "08", "09", "12")) %>%
  group_by(end_year, grade_level) %>%
  summarize(total = sum(n_students, na.rm = TRUE), .groups = "drop")

stopifnot(nrow(grade_totals) > 0)

g_2012 <- grade_totals %>% filter(end_year == 2012) %>% rename(n_2012 = total)
g_2024 <- grade_totals %>% filter(end_year == 2024) %>% rename(n_2024 = total) %>%
  select(grade_level, n_2024)

grade_change <- g_2012 %>%
  inner_join(g_2024, by = "grade_level") %>%
  mutate(
    pct_change = round((n_2024 - n_2012) / n_2012 * 100, 1),
    grade_label = case_when(
      grade_level == "01" ~ "Grade 1",
      grade_level == "05" ~ "Grade 5",
      grade_level == "08" ~ "Grade 8",
      grade_level == "09" ~ "Grade 9",
      grade_level == "12" ~ "Grade 12"
    )
  )

stopifnot(nrow(grade_change) > 0)

ggplot(grade_change, aes(x = reorder(grade_label, pct_change), y = pct_change)) +
  geom_col(fill = "#6C757D") +
  geom_text(aes(label = paste0(pct_change, "%")), hjust = 1.1, color = "white", size = 4) +
  coord_flip() +
  labs(
    title = "First Grade Hit Hardest: -17.4%",
    subtitle = "Enrollment change by grade level, 2012-2024",
    x = NULL,
    y = "Percent Change"
  ) +
  theme_minimal()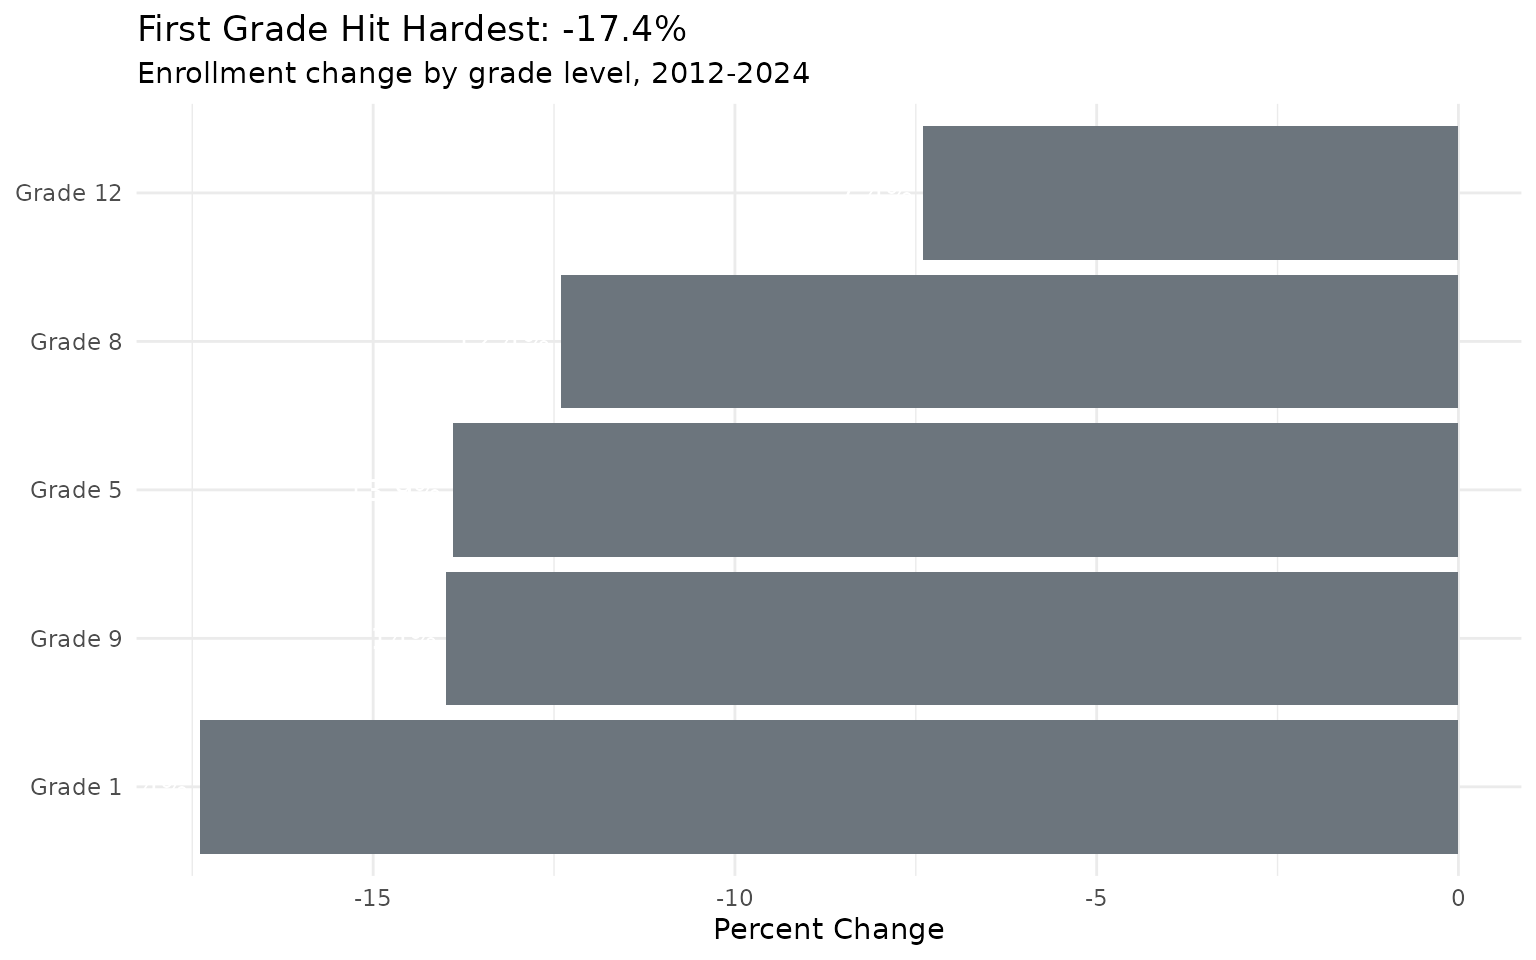
8. Charter Schools’ Rising Market Share
# Need school-level data for charter information
enr_schools <- fetch_enr_years(2023:2024, level = "school", tidy = TRUE, use_cache = TRUE)
Charter schools now enroll ~181K students (7.5% of total) across 343 schools, growing even as traditional public school enrollment declines.
charter_summary <- enr_schools %>%
  filter(grade_level == "TOTAL", is_school == TRUE) %>%
  group_by(end_year, is_charter) %>%
  summarize(
    total = sum(n_students, na.rm = TRUE),
    n_schools = n(),
    .groups = "drop"
  ) %>%
  mutate(
    type = ifelse(is_charter, "Charter", "Traditional"),
    avg_size = round(total / n_schools)
  )

stopifnot(nrow(charter_summary) > 0)

# Show as table
charter_summary %>%
  select(end_year, type, total, n_schools, avg_size) %>%
  arrange(end_year, desc(type)) %>%
  knitr::kable(
    col.names = c("Year", "School Type", "Total Students", "# Schools", "Avg Size"),
    format.args = list(big.mark = ","),
    caption = "Charter schools grew from 175K to 181K students in one year"
)| Year | School Type | Total Students | # Schools | Avg Size |
|---|---|---|---|---|
| 2,023 | Traditional | 2,308,189 | 4,402 | 524 |
| 2,023 | Charter | 175,396 | 342 | 513 |
| 2,024 | Traditional | 2,307,920 | 4,406 | 524 |
| 2,024 | Charter | 181,334 | 343 | 529 |
9. Only One County Grew
Saratoga County is the only county that GREW (+0.3%). Suburban counties held steady while urban and rural areas declined sharply.
county_all <- county_2012 %>%
  inner_join(county_2024, by = "county") %>%
  mutate(
    pct_change = round((enr_2024 - enr_2012) / enr_2012 * 100, 1),
    grew = pct_change > 0
  )

stopifnot(nrow(county_all) > 0)

# Summary stats
n_grew <- sum(county_all$grew)
n_declined <- sum(!county_all$grew)

cat(paste0("Counties that grew: ", n_grew, "\n"))
## Counties that grew: 1## Counties that declined: 61
# The one county that grew
county_all %>% filter(grew) %>%
  select(county, enr_2012, enr_2024, pct_change) %>%
knitr::kable(caption = "The Only Growing County")| county | enr_2012 | enr_2024 | pct_change |
|---|---|---|---|
| SARATOGA | 31661 | 31746 | 0.3 |
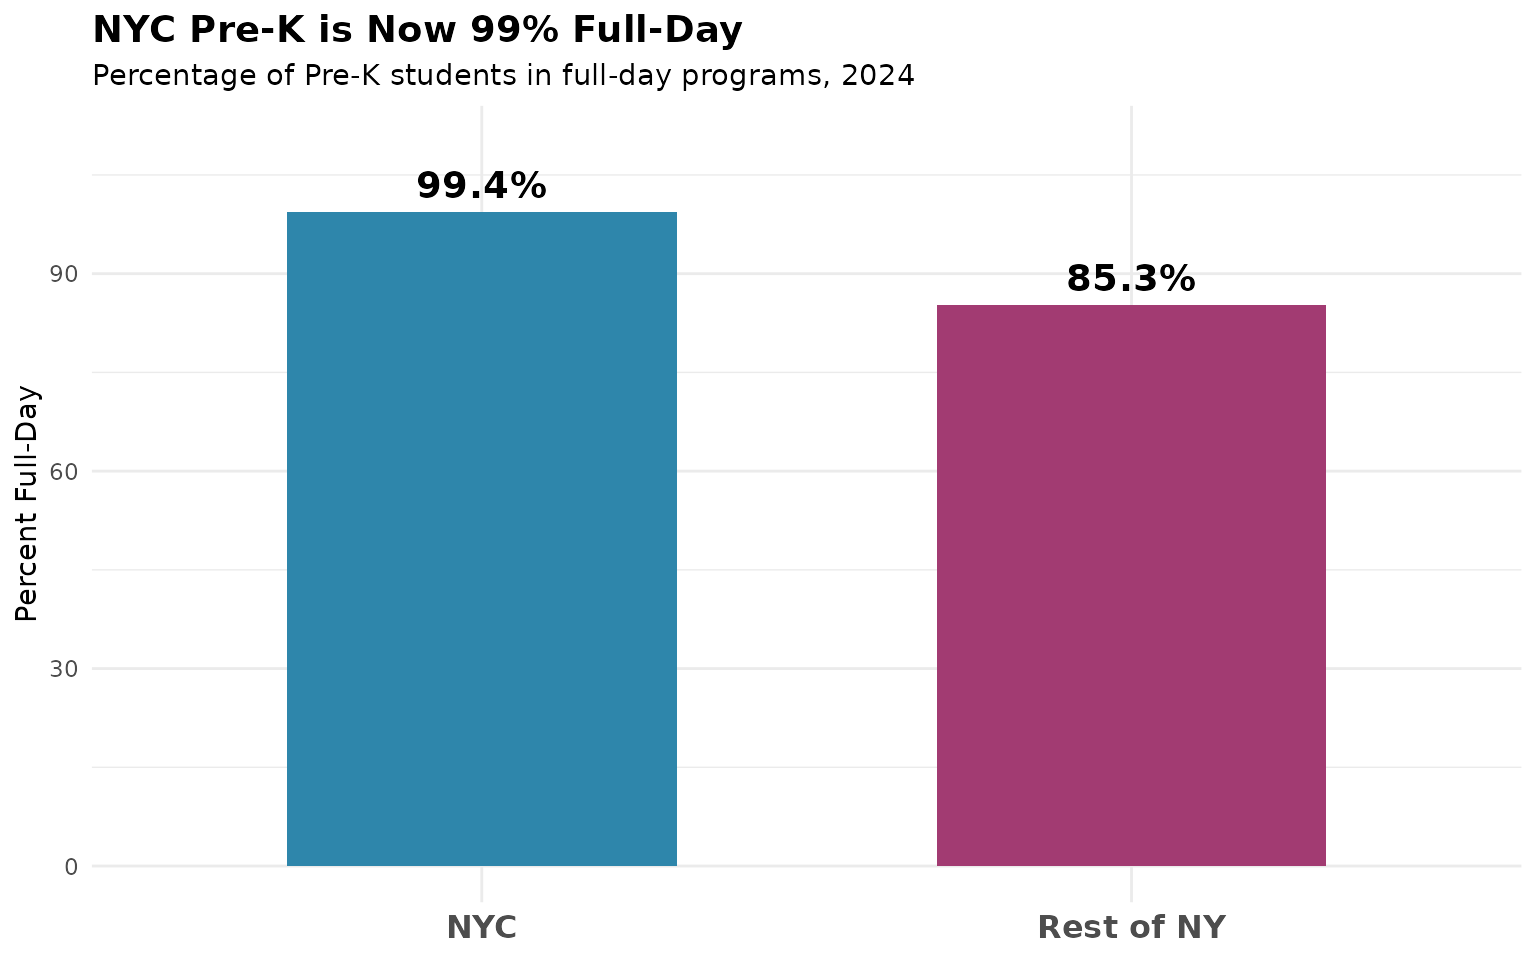
10. The Pre-K Inversion
NYC Pre-K is now 99% full-day (103K of 104K), while rest of state is only 85% full-day. This represents a fundamental policy shift in early childhood education.
# Use wide format to access half/full day Pre-K detail columns
enr_2024_wide <- fetch_enr(2024, level = "district", tidy = FALSE, use_cache = TRUE)

pk_comparison <- enr_2024_wide %>%
  group_by(is_nyc) %>%
  summarize(
    pk_full = sum(grade_pk_full, na.rm = TRUE),
    pk_half = sum(grade_pk_half, na.rm = TRUE),
    .groups = "drop"
  ) %>%
  mutate(
    region = ifelse(is_nyc, "NYC", "Rest of NY"),
    total_pk = pk_full + pk_half,
    pct_full_day = round(pk_full / total_pk * 100, 1)
  )

stopifnot(nrow(pk_comparison) > 0)

ggplot(pk_comparison, aes(x = region, y = pct_full_day, fill = region)) +
  geom_col(show.legend = FALSE, width = 0.6) +
  geom_text(aes(label = paste0(pct_full_day, "%")), vjust = -0.5, size = 5, fontface = "bold") +
  scale_fill_manual(values = c("NYC" = "#2E86AB", "Rest of NY" = "#A23B72")) +
  scale_y_continuous(limits = c(0, 110)) +
  labs(
    title = "NYC Pre-K is Now 99% Full-Day",
    subtitle = "Percentage of Pre-K students in full-day programs, 2024",
    x = NULL,
    y = "Percent Full-Day"
  ) +
  theme_minimal() +
  theme(
    axis.text.x = element_text(size = 12, face = "bold"),
    plot.title = element_text(face = "bold", size = 14)
  )
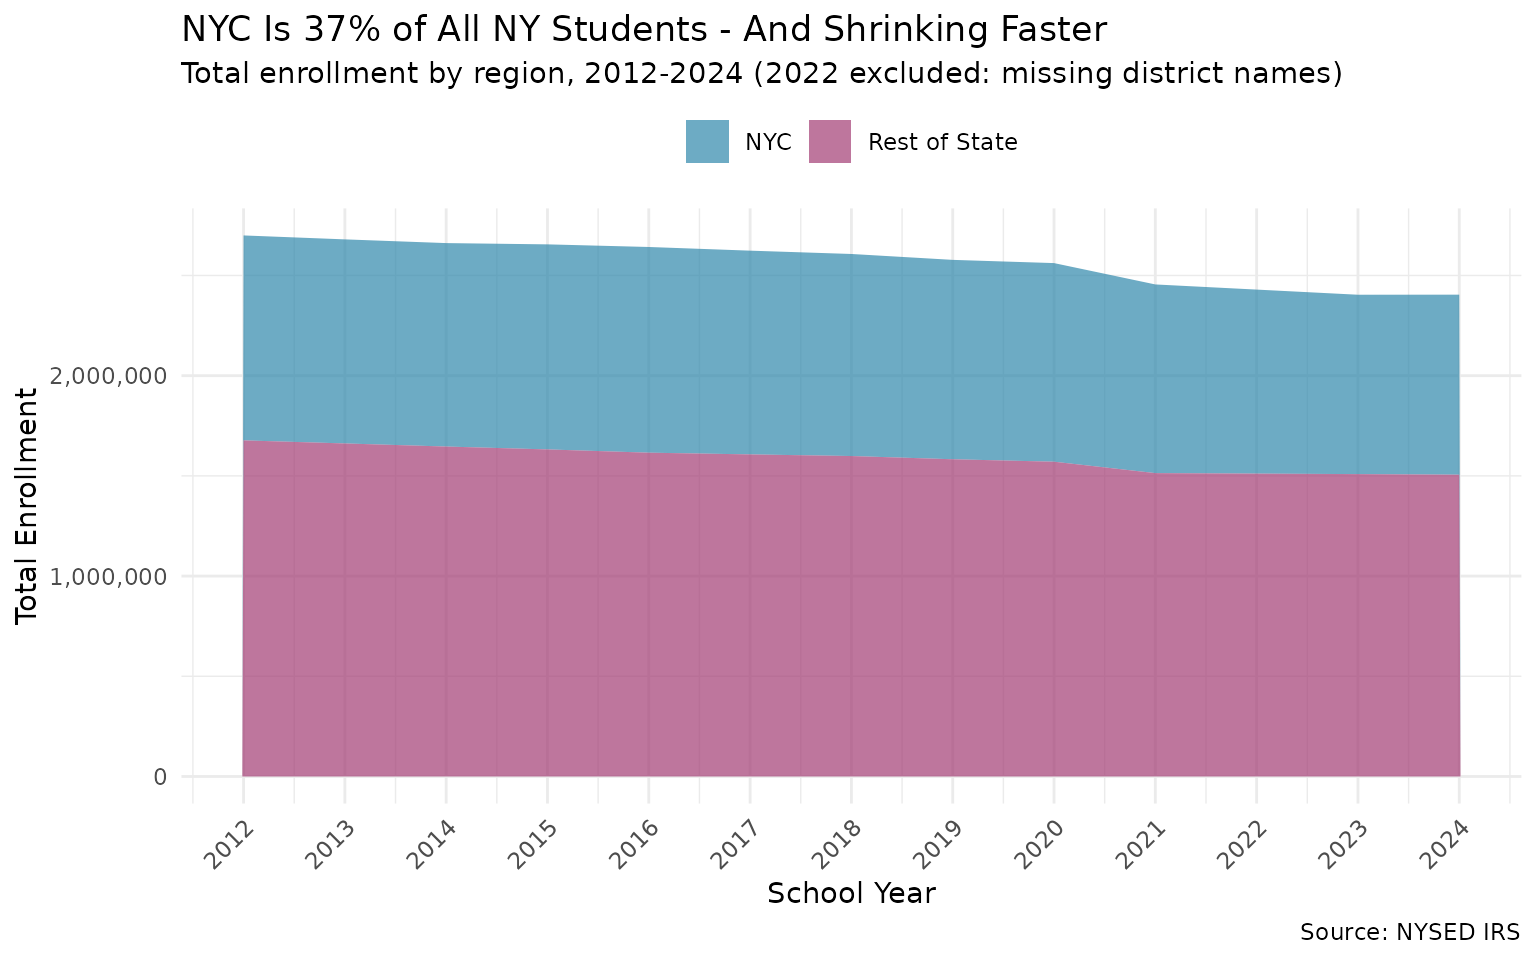
11. NYC Enrolls 37% of the State - But Is Shrinking Faster
NYC accounts for 898K of 2.4 million students (37%), and lost 12.1% since 2012 compared to 10.2% for the rest of the state. The city’s outsized share means its decline drives statewide numbers.
# Note: is_nyc flag relies on district_code, which is missing for 2012-2022.
# Use grepl on district_name instead. Also exclude 2022 where district_name is NA.
nyc_vs_rest <- enr %>%
  filter(grade_level == "TOTAL", !is.na(district_name)) %>%
  mutate(nyc_flag = grepl("^NYC", district_name)) %>%
  group_by(end_year, nyc_flag) %>%
  summarize(total = sum(n_students, na.rm = TRUE), .groups = "drop") %>%
  mutate(region = ifelse(nyc_flag, "NYC", "Rest of State"))

stopifnot(nrow(nyc_vs_rest) > 0)

# Calculate shares
nyc_share <- nyc_vs_rest %>%
  group_by(end_year) %>%
  mutate(pct_share = round(total / sum(total) * 100, 1))

ggplot(nyc_vs_rest, aes(x = end_year, y = total, fill = region)) +
  geom_area(alpha = 0.7) +
  scale_y_continuous(labels = comma) +
  scale_x_continuous(breaks = 2012:2024) +
  scale_fill_manual(values = c("NYC" = "#2E86AB", "Rest of State" = "#A23B72")) +
  labs(
    title = "NYC Is 37% of All NY Students - And Shrinking Faster",
    subtitle = "Total enrollment by region, 2012-2024 (2022 excluded: missing district names)",
    x = "School Year",
    y = "Total Enrollment",
    fill = NULL,
    caption = "Source: NYSED IRS"
  ) +
  theme_minimal() +
  theme(
    axis.text.x = element_text(angle = 45, hjust = 1),
    legend.position = "top"
  )
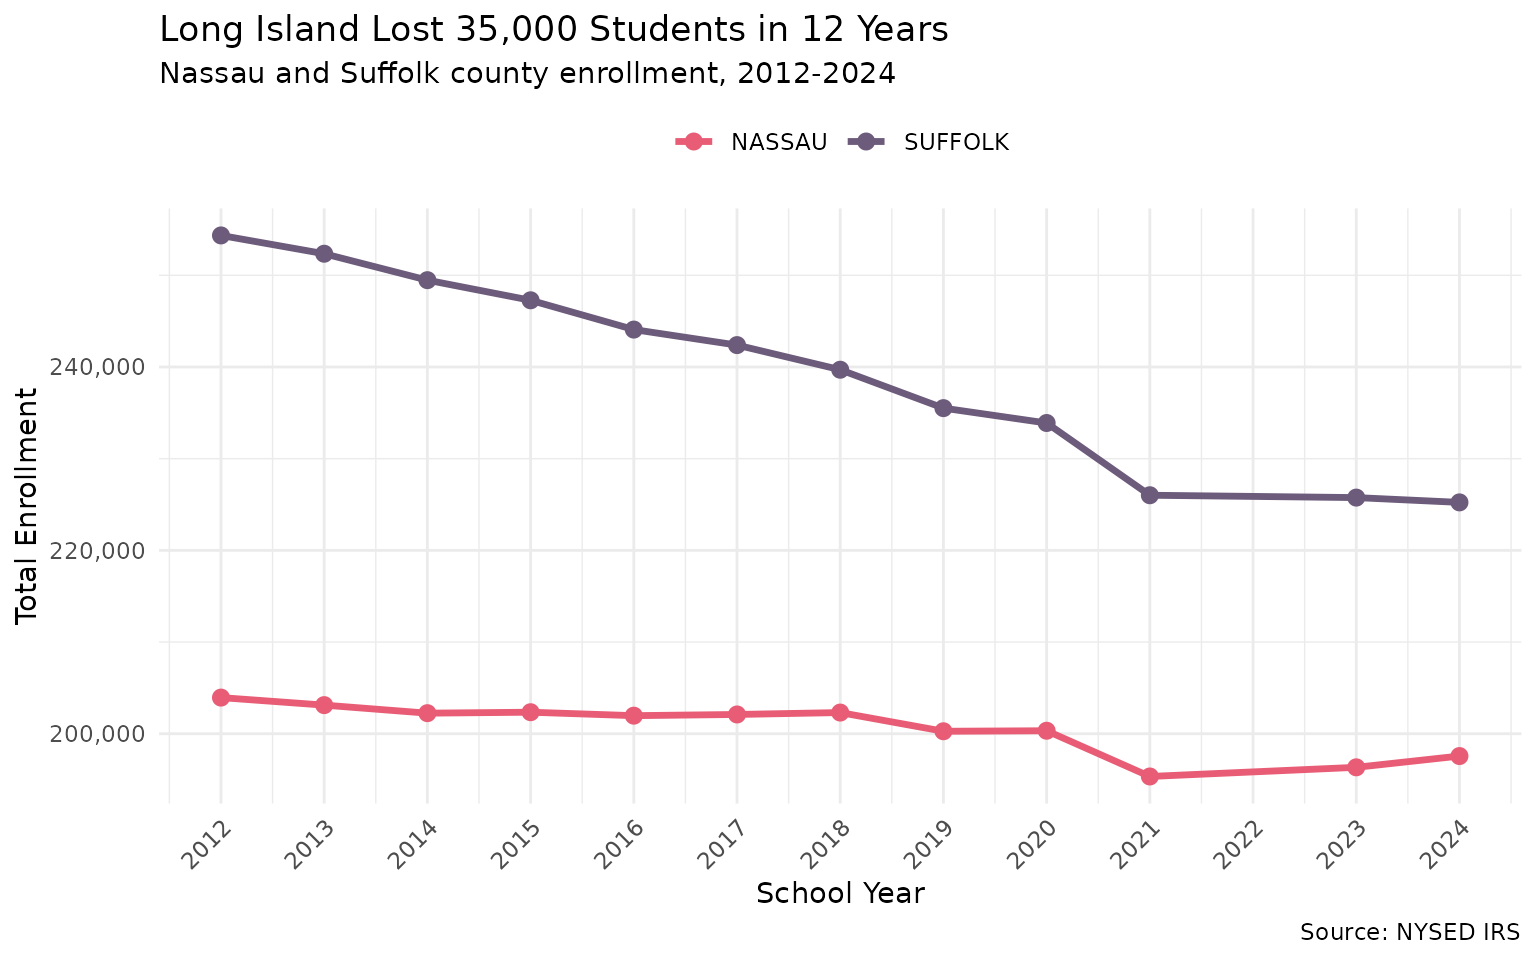
12. Long Island Lost 35,000 Students Despite Stable Housing
Nassau and Suffolk counties lost 35,493 students combined despite being among the state’s most expensive housing markets. Nassau fell 3.1% and Suffolk 11.4%, suggesting birth rate declines even in affluent suburbs.
li_counties <- enr %>%
  filter(county %in% c("NASSAU", "SUFFOLK"), grade_level == "TOTAL") %>%
  group_by(end_year, county) %>%
  summarize(total = sum(n_students, na.rm = TRUE), .groups = "drop")

stopifnot(nrow(li_counties) > 0)

ggplot(li_counties, aes(x = end_year, y = total, color = county)) +
  geom_line(linewidth = 1.2) +
  geom_point(size = 2.5) +
  scale_y_continuous(labels = comma) +
  scale_x_continuous(breaks = 2012:2024) +
  scale_color_manual(values = c("NASSAU" = "#E85D75", "SUFFOLK" = "#6C5B7B")) +
  labs(
    title = "Long Island Lost 35,000 Students in 12 Years",
    subtitle = "Nassau and Suffolk county enrollment, 2012-2024",
    x = "School Year",
    y = "Total Enrollment",
    color = NULL,
    caption = "Source: NYSED IRS"
  ) +
  theme_minimal() +
  theme(
    axis.text.x = element_text(angle = 45, hjust = 1),
    legend.position = "top"
  )
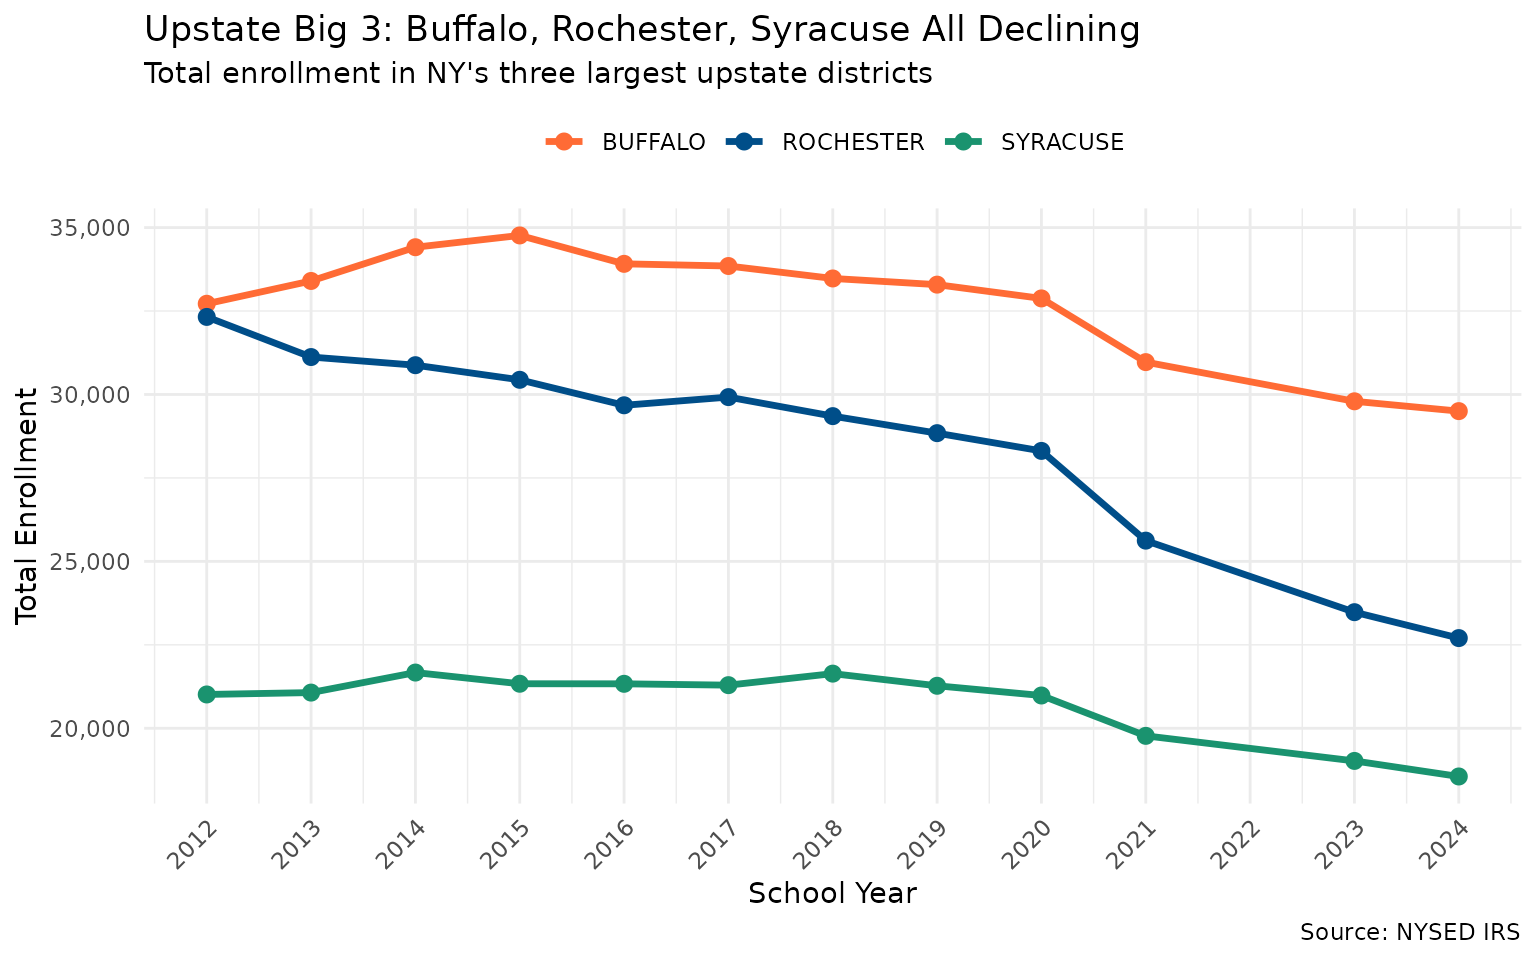
13. Buffalo Fell 10% but Outpaced Rochester and Syracuse
Buffalo lost 9.8% of students, yet that’s the best outcome among upstate Big 3 cities. Rochester lost 29.8% and Syracuse 11.7% - all three lost more than the state average.
upstate_big3 <- enr %>%
  filter(
    district_name %in% c("BUFFALO", "ROCHESTER", "SYRACUSE"),
    grade_level == "TOTAL"
  ) %>%
  group_by(end_year, district_name) %>%
  summarize(total = sum(n_students, na.rm = TRUE), .groups = "drop")

stopifnot(nrow(upstate_big3) > 0)

ggplot(upstate_big3, aes(x = end_year, y = total, color = district_name)) +
  geom_line(linewidth = 1.2) +
  geom_point(size = 2.5) +
  scale_y_continuous(labels = comma) +
  scale_x_continuous(breaks = 2012:2024) +
  scale_color_manual(values = c("BUFFALO" = "#FF6B35", "ROCHESTER" = "#004E89", "SYRACUSE" = "#1A936F")) +
  labs(
    title = "Upstate Big 3: Buffalo, Rochester, Syracuse All Declining",
    subtitle = "Total enrollment in NY's three largest upstate districts",
    x = "School Year",
    y = "Total Enrollment",
    color = NULL,
    caption = "Source: NYSED IRS"
  ) +
  theme_minimal() +
  theme(
    axis.text.x = element_text(angle = 45, hjust = 1),
    legend.position = "top"
  )
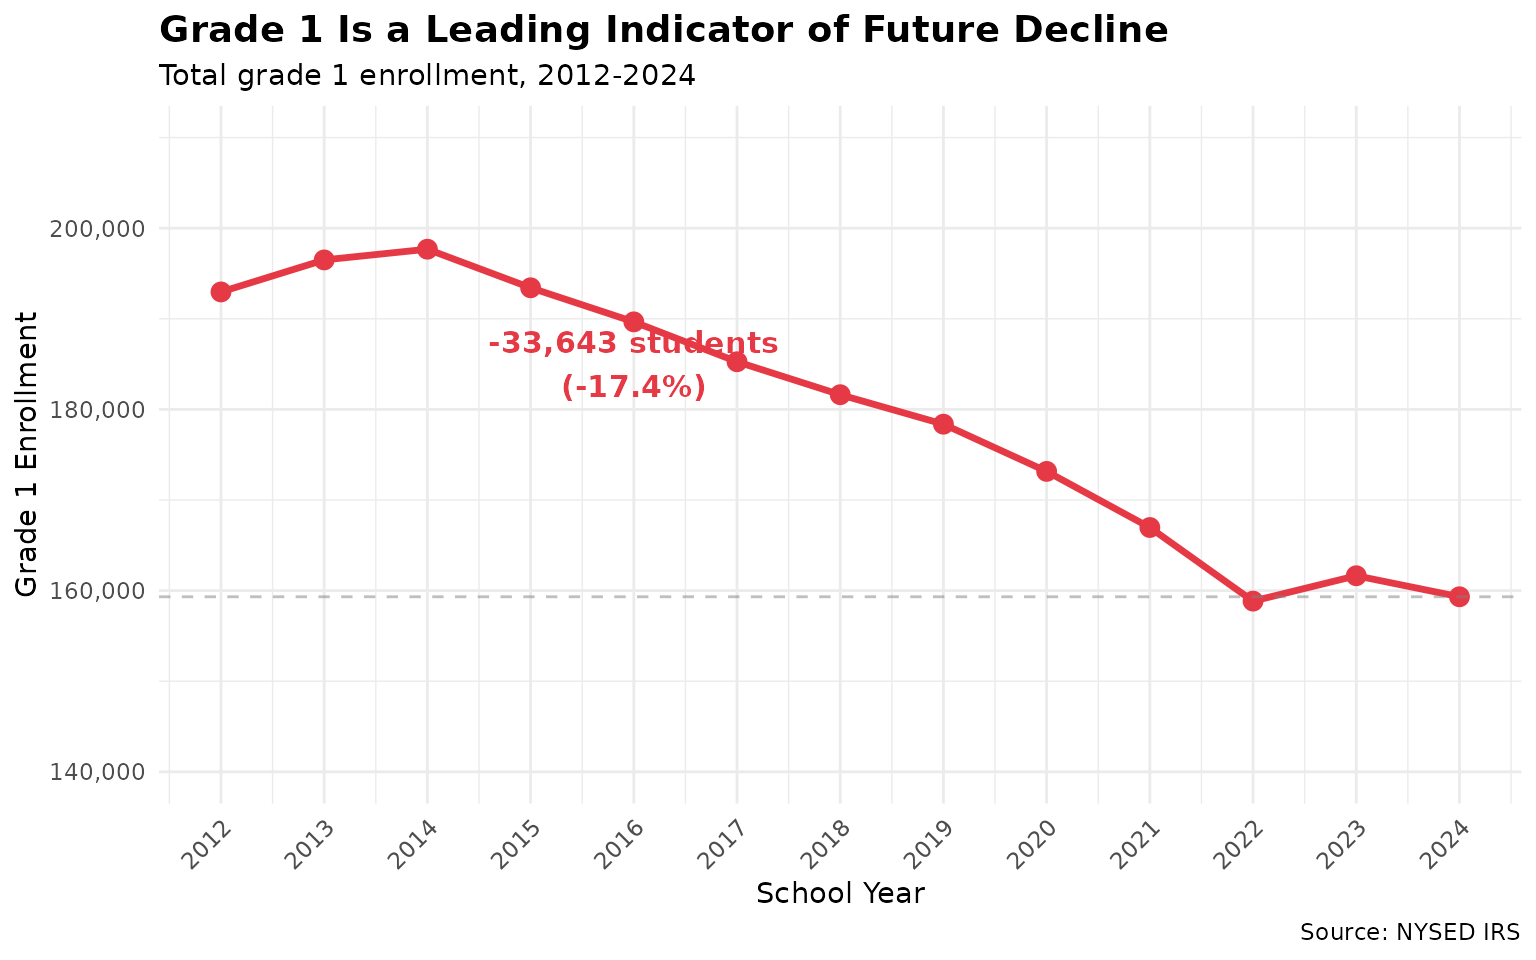
14. Grade 1 Lost 33,600 Seats in 12 Years
Grade 1 enrollment dropped from 193K to 159K (-17.4%), a leading indicator that future grades will continue to shrink as smaller cohorts advance through the pipeline.
# Note: K grade only available for 2023-2024, so Grade 1 is the best proxy
# for pipeline trends across the full 2012-2024 period.
g1_trend <- enr %>%
  filter(grade_level == "01") %>%
  group_by(end_year) %>%
  summarize(total = sum(n_students, na.rm = TRUE), .groups = "drop")

stopifnot(nrow(g1_trend) > 0)

g1_loss <- g1_trend$total[g1_trend$end_year == 2012] - g1_trend$total[g1_trend$end_year == 2024]
g1_pct <- round(g1_loss / g1_trend$total[g1_trend$end_year == 2012] * 100, 1)

ggplot(g1_trend, aes(x = end_year, y = total)) +
  geom_line(linewidth = 1.2, color = "#E63946") +
  geom_point(size = 3, color = "#E63946") +
  geom_hline(yintercept = g1_trend$total[g1_trend$end_year == 2024],
             linetype = "dashed", color = "gray50", alpha = 0.5) +
  annotate("text", x = 2016, y = 185000,
           label = paste0("-", comma(g1_loss), " students\n(-", g1_pct, "%)"),
           color = "#E63946", size = 4, fontface = "bold") +
  scale_y_continuous(labels = comma, limits = c(140000, 210000)) +
  scale_x_continuous(breaks = 2012:2024) +
  labs(
    title = "Grade 1 Is a Leading Indicator of Future Decline",
    subtitle = "Total grade 1 enrollment, 2012-2024",
    x = "School Year",
    y = "Grade 1 Enrollment",
    caption = "Source: NYSED IRS"
  ) +
  theme_minimal() +
  theme(
    axis.text.x = element_text(angle = 45, hjust = 1),
    plot.title = element_text(face = "bold", size = 14)
  )
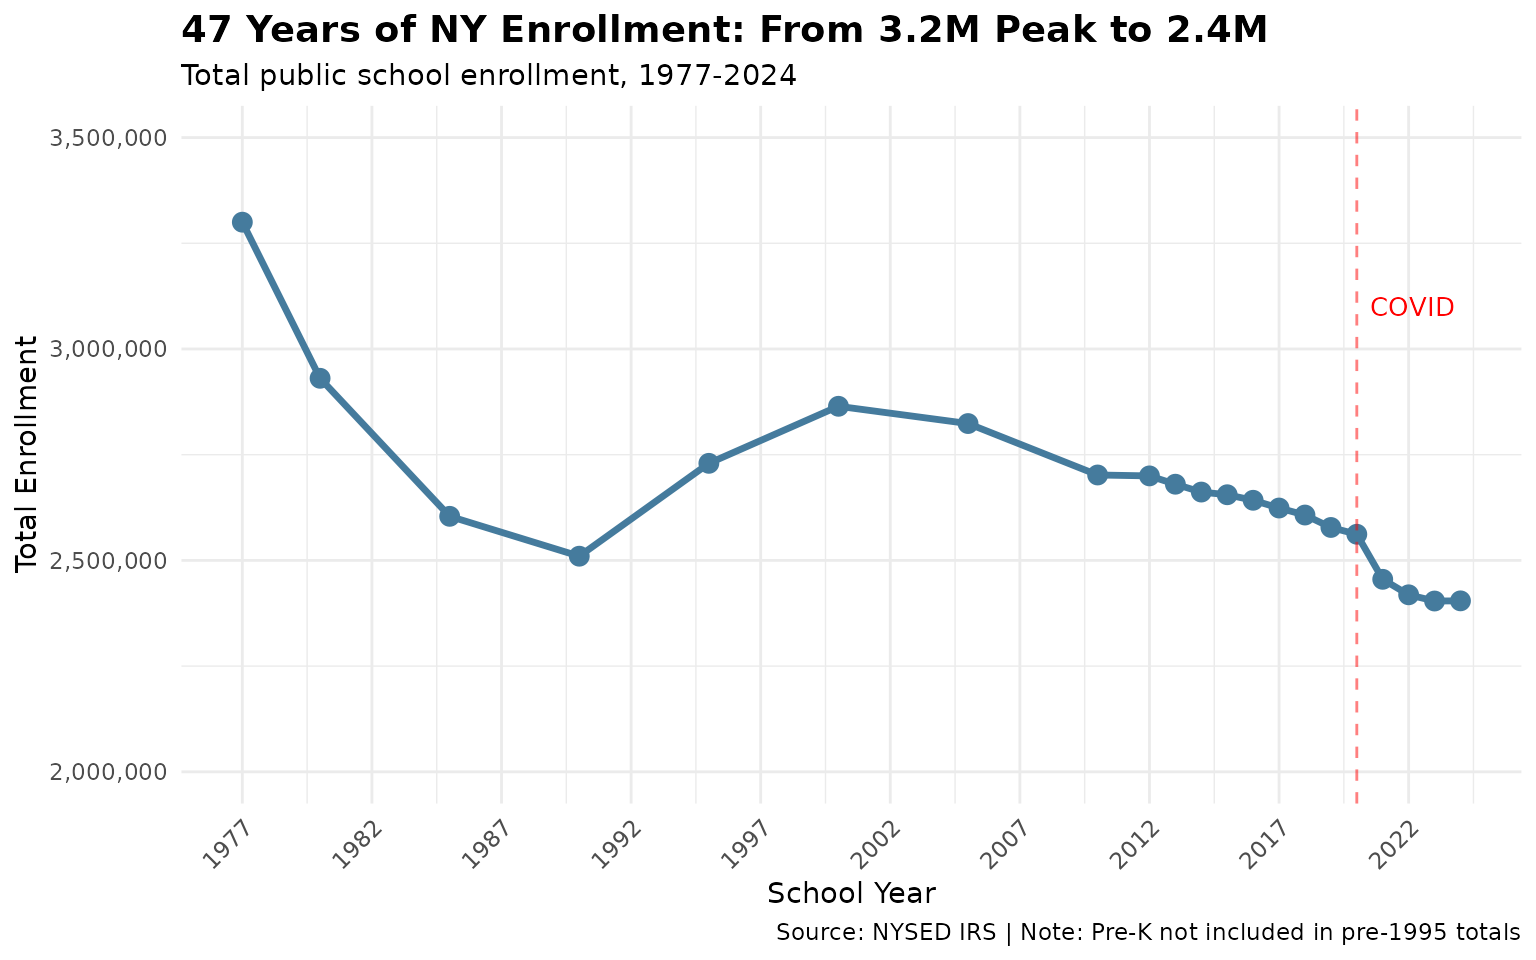
15. New York’s 47-Year View: Peak Was 1977
New York enrollment peaked around 3.2M in 1977 and has been on a long decline. The current 2.4M is roughly where enrollment was in the early 1990s, but the trajectory is downward.
# Fetch archive data for the long view (district-level for older years)
enr_archive <- fetch_enr_years(
  c(1977, 1980, 1985, 1990, 1995, 2000, 2005, 2010),
  level = "district", tidy = TRUE, use_cache = TRUE
)
archive_trend <- enr_archive %>%
  filter(grade_level == "TOTAL") %>%
  group_by(end_year) %>%
  summarize(total = sum(n_students, na.rm = TRUE), .groups = "drop")

long_trend <- bind_rows(archive_trend, state_trend) %>%
  arrange(end_year)

stopifnot(nrow(long_trend) > 0)

ggplot(long_trend, aes(x = end_year, y = total)) +
  geom_line(linewidth = 1.2, color = "#457B9D") +
  geom_point(size = 3, color = "#457B9D") +
  geom_vline(xintercept = 2020, linetype = "dashed", color = "red", alpha = 0.5) +
  annotate("text", x = 2020.5, y = 3100000, label = "COVID", color = "red", hjust = 0, size = 3.5) +
  scale_y_continuous(labels = comma, limits = c(2000000, 3500000)) +
  scale_x_continuous(breaks = seq(1977, 2024, by = 5)) +
  labs(
    title = "47 Years of NY Enrollment: From 3.2M Peak to 2.4M",
    subtitle = "Total public school enrollment, 1977-2024",
    x = "School Year",
    y = "Total Enrollment",
    caption = "Source: NYSED IRS | Note: Pre-K not included in pre-1995 totals"
  ) +
  theme_minimal() +
  theme(
    axis.text.x = element_text(angle = 45, hjust = 1),
    plot.title = element_text(face = "bold", size = 14)
  )
The Big Picture
New York’s public school enrollment data reveals a state in profound transformation:
Winners and Losers
| Growing | Shrinking |
|---|---|
| Pre-K enrollment (+67%) | Total enrollment (-11%) |
| District 75 special ed (+40%) | The Bronx (-24%) |
| Charter schools (7.5% share) | Rochester (-30%) |
| Saratoga County (+0.3%) | Grade 1 (-17%) |
Key Statistics
| Finding | Key Statistic |
|---|---|
| Total enrollment loss | -295,521 students (-11%) |
| COVID impact (2021) | -106,560 students (-4.2%) |
| Pre-K growth | +67% (driven by full-day expansion) |
| Bronx county loss | -49,447 students (-23.7%) |
| Rochester district loss | -9,621 students (-29.8%) |
| District 75 growth | +7,784 students (+40.1%) |
| Grade 1 decline | -33,643 students (-17.4%) |
| Charter market share | 181K students (7.5%) |
| Growing counties | 1 of 62 (Saratoga) |
| NYC full-day Pre-K | 99% vs 85% rest of state |
| NYC share of state | 37% (898K of 2.4M) |
| Long Island loss | -35,493 students (Nassau + Suffolk) |
| Upstate Big 3 loss | Buffalo -9.8%, Rochester -29.8%, Syracuse -11.7% |
| Grade 1 decline | -33,643 students (-17.4%) |
| Historical peak | 3.2M in 1977 vs 2.4M in 2024 |
What Does This Mean?
These patterns reflect three converging forces:
Demographic decline: New York’s birth rate has fallen sharply, especially in urban areas. The pipeline of future students is shrinking - Grade 1’s 17% decline is a leading indicator.
Policy success: Universal Pre-K transformed early childhood education in NYC. The 67% growth in Pre-K enrollment, driven primarily by full-day expansion, is one of the most dramatic policy-driven enrollment shifts in state history.
COVID disruption: The pandemic accelerated pre-existing trends and may have permanently altered family choices about public vs. private schooling, remote work migration, and urban living.
Geographic divergence: NYC lost students faster than the rest of the state (-12.1% vs -10.2%), Long Island lost 35,000 despite stable housing, and even upstate’s largest cities lost 10-30% each.
The 2024 data shows the first positive year-over-year change (+0.02%), suggesting possible stabilization - but with Grade 1 enrollment still declining, the long-term trajectory remains uncertain. The 47-year view shows that NY enrollment peaked in 1977 and the current level represents a generational low.
Session Info
## R version 4.5.2 (2025-10-31)
## Platform: x86_64-pc-linux-gnu
## Running under: Ubuntu 24.04.3 LTS
##
## Matrix products: default
## BLAS:   /usr/lib/x86_64-linux-gnu/openblas-pthread/libblas.so.3
## LAPACK: /usr/lib/x86_64-linux-gnu/openblas-pthread/libopenblasp-r0.3.26.so;  LAPACK version 3.12.0
##
## locale:
##  [1] LC_CTYPE=C.UTF-8       LC_NUMERIC=C           LC_TIME=C.UTF-8
##  [4] LC_COLLATE=C.UTF-8     LC_MONETARY=C.UTF-8    LC_MESSAGES=C.UTF-8
##  [7] LC_PAPER=C.UTF-8       LC_NAME=C              LC_ADDRESS=C
## [10] LC_TELEPHONE=C         LC_MEASUREMENT=C.UTF-8 LC_IDENTIFICATION=C
##
## time zone: UTC
## tzcode source: system (glibc)
##
## attached base packages:
## [1] stats     graphics  grDevices utils     datasets  methods   base
##
## other attached packages:
## [1] tidyr_1.3.2        scales_1.4.0       ggplot2_4.0.2      dplyr_1.2.0
## [5] nyschooldata_0.1.0
##
## loaded via a namespace (and not attached):
##  [1] gtable_0.3.6       jsonlite_2.0.0     compiler_4.5.2     tidyselect_1.2.1
##  [5] jquerylib_0.1.4    systemfonts_1.3.2  textshaping_1.0.5  readxl_1.4.5
##  [9] yaml_2.3.12        fastmap_1.2.0      R6_2.6.1           labeling_0.4.3
## [13] generics_0.1.4     knitr_1.51         tibble_3.3.1       desc_1.4.3
## [17] downloader_0.4.1   bslib_0.10.0       pillar_1.11.1      RColorBrewer_1.1-3
## [21] rlang_1.1.7        cachem_1.1.0       xfun_0.56          fs_1.6.7
## [25] sass_0.4.10        S7_0.2.1           cli_3.6.5          pkgdown_2.2.0
## [29] withr_3.0.2        magrittr_2.0.4     digest_0.6.39      grid_4.5.2
## [33] rappdirs_0.3.4     lifecycle_1.0.5    vctrs_0.7.1        evaluate_1.0.5
## [37] glue_1.8.0         cellranger_1.1.0   farver_2.1.2       codetools_0.2-20
## [41] ragg_1.5.1         purrr_1.2.1        rmarkdown_2.30     tools_4.5.2
## [45] pkgconfig_2.0.3    htmltools_0.5.9