library(okschooldata)
library(dplyr)
library(tidyr)
library(ggplot2)
theme_set(theme_minimal(base_size = 14))
Oklahoma administers the Oklahoma School Testing Program (OSTP) to students in grades 3-8, testing ELA, Math, and Science (grades 5 and 8 only). This vignette explores assessment trends from 2022-2025.
Data note: 2024 results show a large proficiency spike (e.g., Grade 3 ELA jumped from 29% to 51%) likely reflecting an assessment framework change rather than real student improvement. Multi-year trends should be interpreted cautiously around that year.
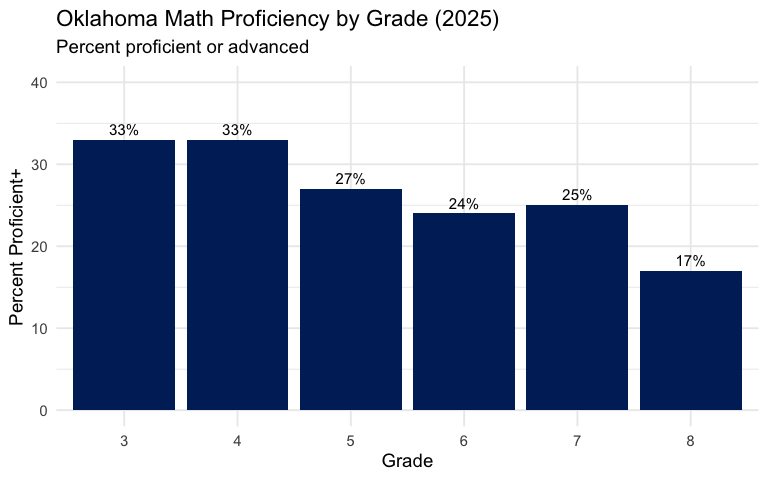
1. Only 17% of 8th Graders Are Proficient in Math
Oklahoma’s math proficiency rates decline sharply with grade level. In 2025, 33% of 3rd graders were proficient, but only 17% of 8th graders cleared the bar.
assess_2025 <- fetch_assessment(2025, tidy = FALSE, use_cache = TRUE)

state_math_2025 <- assess_2025 |>
  filter(is_state) |>
  select(grade, math_proficient_plus_pct) |>
  filter(!is.na(math_proficient_plus_pct))

stopifnot(nrow(state_math_2025) > 0)
print(state_math_2025)
#> # A tibble: 6 × 2
#>   grade math_proficient_plus_pct
#>   <dbl>                    <dbl>
#> 1     3                       33
#> 2     4                       33
#> 3     5                       27
#> 4     6                       24
#> 5     7                       25
#> 6     8                       17

ggplot(state_math_2025, aes(x = factor(grade), y = math_proficient_plus_pct)) +
  geom_col(fill = "#002868") +
  geom_text(aes(label = paste0(math_proficient_plus_pct, "%")),
            vjust = -0.5, size = 4) +
  scale_y_continuous(limits = c(0, 40)) +
  labs(
    title = "Oklahoma Math Proficiency by Grade (2025)",
    subtitle = "Percent proficient or advanced",
    x = "Grade",
    y = "Percent Proficient+"
  )
2. Oklahoma City Students Are Half as Likely to Be Proficient as the State Average
OKC Public Schools (55I089) posted 15% math proficiency and 14% ELA proficiency in Grade 3 for 2025, compared to the state’s 33% and 27% respectively.
state_g3 <- assess_2025 |>
  filter(is_state, grade == 3) |>
  select(ela_proficient_plus_pct, math_proficient_plus_pct) |>
  mutate(entity = "State")

okc_g3 <- assess_2025 |>
  filter(aggregation_level == "district", district_id == "55I089", grade == 3) |>
  select(ela_proficient_plus_pct, math_proficient_plus_pct) |>
  mutate(entity = "OKC Public Schools")

compare_g3 <- bind_rows(state_g3, okc_g3) |>
  pivot_longer(cols = c(ela_proficient_plus_pct, math_proficient_plus_pct),
               names_to = "subject", values_to = "pct") |>
  mutate(subject = if_else(subject == "ela_proficient_plus_pct", "ELA", "Math"))

stopifnot(nrow(compare_g3) > 0)
print(compare_g3)
#> # A tibble: 4 × 3
#>   entity             subject   pct
#>   <chr>              <chr>   <dbl>
#> 1 State              ELA        27
#> 2 State              Math       33
#> 3 OKC Public Schools ELA        14
#> 4 OKC Public Schools Math       15

ggplot(compare_g3, aes(x = subject, y = pct, fill = entity)) +
  geom_col(position = "dodge") +
  geom_text(aes(label = paste0(pct, "%")),
            position = position_dodge(width = 0.9), vjust = -0.5, size = 4) +
  scale_fill_manual(values = c("OKC Public Schools" = "#841617", "State" = "#002868")) +
  scale_y_continuous(limits = c(0, 40)) +
  labs(
    title = "Grade 3 Proficiency: OKC vs. State (2025)",
    x = "Subject",
    y = "Percent Proficient+",
    fill = NULL
  ) +
  theme(legend.position = "bottom")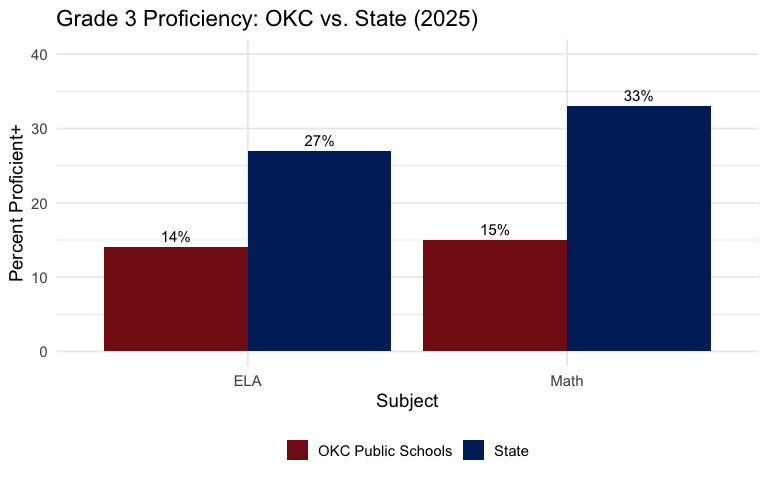
3. Edmond Outperforms the State by 15-20 Points
Edmond (55I012) posted 48% math and 42% ELA proficiency in Grade 3 – far above state averages, illustrating the suburban advantage.
edmond_assess <- assess_2025 |>
  filter(aggregation_level == "district", district_id == "55I012") |>
  select(grade, group_name, ela_proficient_plus_pct, math_proficient_plus_pct)

stopifnot(nrow(edmond_assess) > 0)
print(edmond_assess)
#> # A tibble: 6 × 4
#>   grade group_name ela_proficient_plus_pct math_proficient_plus_pct
#>   <dbl> <chr>                        <dbl>                    <dbl>
#> 1     3 Edmond                          42                       48
#> 2     4 Edmond                          35                       45
#> 3     5 Edmond                          44                       44
#> 4     6 Edmond                          35                       37
#> 5     7 Edmond                          34                       37
#> 6     8 Edmond                          32                       22

edmond_long <- edmond_assess |>
  pivot_longer(cols = c(ela_proficient_plus_pct, math_proficient_plus_pct),
               names_to = "subject", values_to = "pct") |>
  mutate(subject = if_else(subject == "ela_proficient_plus_pct", "ELA", "Math"))

ggplot(edmond_long, aes(x = factor(grade), y = pct, fill = subject)) +
  geom_col(position = "dodge") +
  geom_text(aes(label = paste0(pct, "%")),
            position = position_dodge(width = 0.9), vjust = -0.5, size = 3.5) +
  scale_fill_manual(values = c("ELA" = "#841617", "Math" = "#002868")) +
  scale_y_continuous(limits = c(0, 60)) +
  labs(
    title = "Edmond Public Schools Proficiency by Grade (2025)",
    x = "Grade",
    y = "Percent Proficient+",
    fill = NULL
  ) +
  theme(legend.position = "bottom")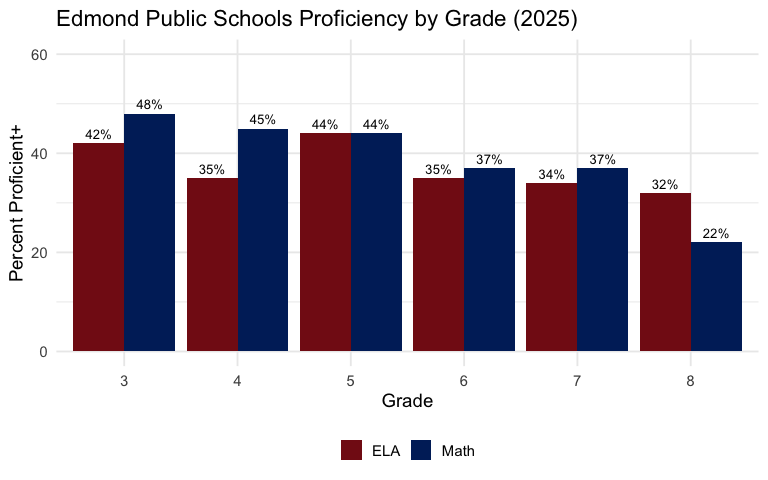
4. Tulsa’s 6% 8th Grade Math Proficiency Rate
Tulsa Public Schools (72I001) had only 6% of 8th graders proficient in math in 2025. Across all grades, Tulsa trailed the state by 10-15 points.
tulsa_assess <- assess_2025 |>
  filter(aggregation_level == "district", district_id == "72I001") |>
  select(grade, group_name, ela_proficient_plus_pct, math_proficient_plus_pct)

stopifnot(nrow(tulsa_assess) > 0)
print(tulsa_assess)
#> # A tibble: 6 × 4
#>   grade group_name ela_proficient_plus_pct math_proficient_plus_pct
#>   <dbl> <chr>                        <dbl>                    <dbl>
#> 1     3 Tulsa                           14                       16
#> 2     4 Tulsa                           12                       15
#> 3     5 Tulsa                           15                       12
#> 4     6 Tulsa                           15                        9
#> 5     7 Tulsa                           11                       11
#> 6     8 Tulsa                           13                        6

tulsa_long <- tulsa_assess |>
  pivot_longer(cols = c(ela_proficient_plus_pct, math_proficient_plus_pct),
               names_to = "subject", values_to = "pct") |>
  mutate(subject = if_else(subject == "ela_proficient_plus_pct", "ELA", "Math"))

ggplot(tulsa_long, aes(x = factor(grade), y = pct, fill = subject)) +
  geom_col(position = "dodge") +
  geom_text(aes(label = paste0(pct, "%")),
            position = position_dodge(width = 0.9), vjust = -0.5, size = 3.5) +
  scale_fill_manual(values = c("ELA" = "#841617", "Math" = "#002868")) +
  scale_y_continuous(limits = c(0, 25)) +
  labs(
    title = "Tulsa Public Schools Proficiency by Grade (2025)",
    x = "Grade",
    y = "Percent Proficient+",
    fill = NULL
  ) +
  theme(legend.position = "bottom")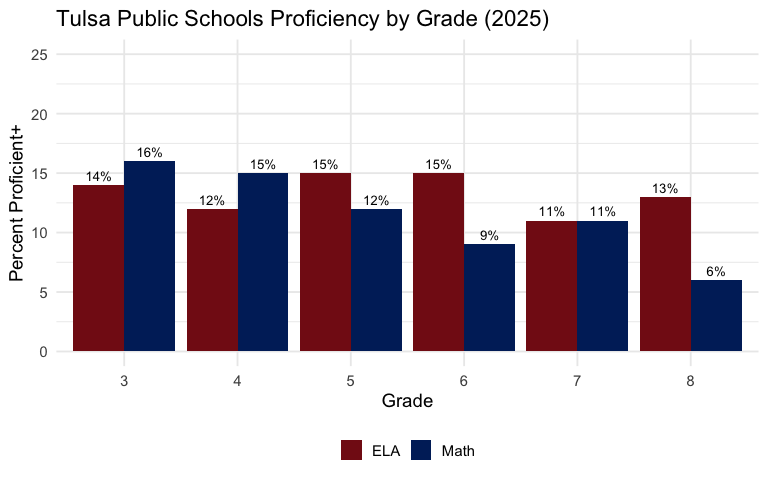
5. Grade 3 Math Proficiency Distribution: Two-Thirds Below Proficient
In 2025, 32% of Grade 3 students scored Below Basic in math, and 35% scored Basic. Only 23% were Proficient and 10% Advanced.
g3_2025 <- assess_2025 |> filter(is_state, grade == 3)

math_dist <- data.frame(
  level = c("Below Basic", "Basic", "Proficient", "Advanced"),
  pct = c(g3_2025$math_below_basic_pct,
          g3_2025$math_basic_pct,
          g3_2025$math_proficient_pct,
          g3_2025$math_advanced_pct)
)
math_dist$level <- factor(math_dist$level,
                          levels = c("Below Basic", "Basic", "Proficient", "Advanced"))

stopifnot(nrow(math_dist) > 0)
print(math_dist)
#>         level pct
#> 1 Below Basic  32
#> 2       Basic  35
#> 3  Proficient  23
#> 4    Advanced  10

ggplot(math_dist, aes(x = level, y = pct, fill = level)) +
  geom_col() +
  geom_text(aes(label = paste0(pct, "%")), vjust = -0.5, size = 4) +
  scale_fill_manual(values = c("Below Basic" = "#d73027", "Basic" = "#fc8d59",
                               "Proficient" = "#91cf60", "Advanced" = "#1a9850")) +
  scale_y_continuous(limits = c(0, 42)) +
  labs(
    title = "Oklahoma Grade 3 Math Proficiency Distribution (2025)",
    x = "Performance Level",
    y = "Percent of Students",
    fill = NULL
  ) +
  theme(legend.position = "none")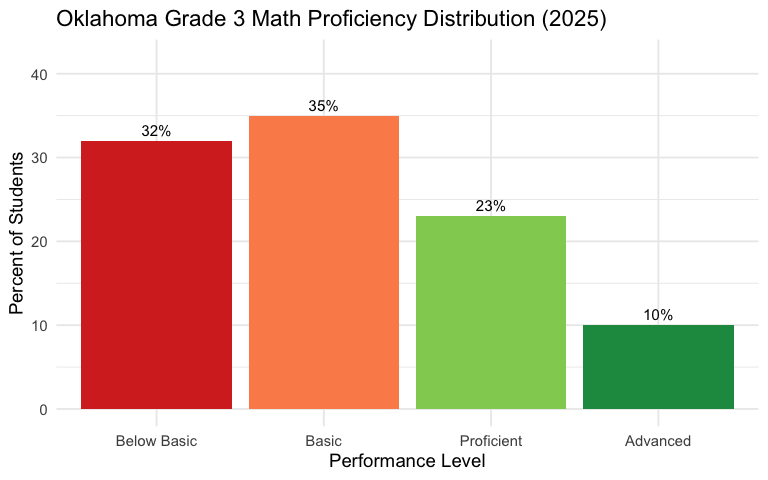
6. ELA: 43% of 3rd Graders Score Below Basic
ELA results are even more concerning than math. 43% of 3rd graders scored Below Basic in ELA in 2025, with only 27% reaching Proficient or Advanced.
ela_dist <- data.frame(
  level = c("Below Basic", "Basic", "Proficient", "Advanced"),
  pct = c(g3_2025$ela_below_basic_pct,
          g3_2025$ela_basic_pct,
          g3_2025$ela_proficient_pct,
          g3_2025$ela_advanced_pct)
)
ela_dist$level <- factor(ela_dist$level,
                         levels = c("Below Basic", "Basic", "Proficient", "Advanced"))

stopifnot(nrow(ela_dist) > 0)
print(ela_dist)
#>         level pct
#> 1 Below Basic  43
#> 2       Basic  30
#> 3  Proficient  24
#> 4    Advanced   3

ggplot(ela_dist, aes(x = level, y = pct, fill = level)) +
  geom_col() +
  geom_text(aes(label = paste0(pct, "%")), vjust = -0.5, size = 4) +
  scale_fill_manual(values = c("Below Basic" = "#d73027", "Basic" = "#fc8d59",
                               "Proficient" = "#91cf60", "Advanced" = "#1a9850")) +
  scale_y_continuous(limits = c(0, 50)) +
  labs(
    title = "Oklahoma Grade 3 ELA Proficiency Distribution (2025)",
    x = "Performance Level",
    y = "Percent of Students",
    fill = NULL
  ) +
  theme(legend.position = "none")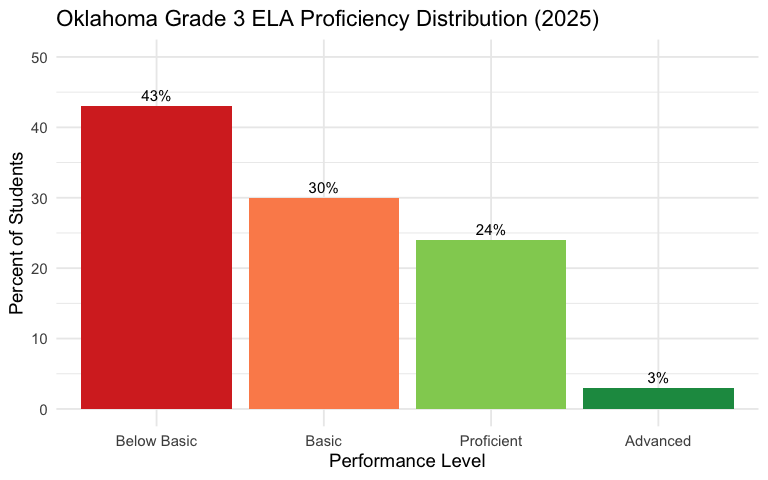
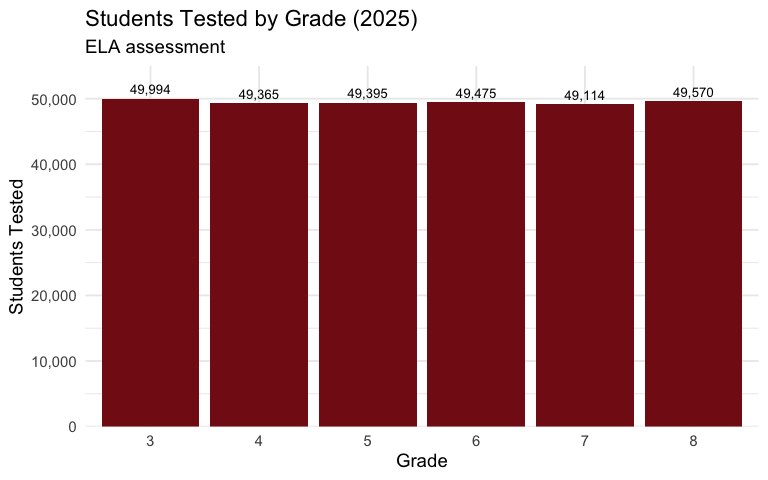
7. Nearly 297,000 Students Tested Statewide
Oklahoma tested approximately 297,000 students in grades 3-8 for both ELA and Math in 2025.
tested_2025 <- assess_2025 |>
  filter(is_state) |>
  select(grade, ela_valid_n, math_valid_n)

stopifnot(nrow(tested_2025) > 0)
print(tested_2025)
#> # A tibble: 6 × 3
#>   grade ela_valid_n math_valid_n
#>   <dbl>       <dbl>        <dbl>
#> 1     3       49994        49954
#> 2     4       49365        49339
#> 3     5       49395        49362
#> 4     6       49475        49458
#> 5     7       49114        49080
#> 6     8       49570        49491

total_tested <- tested_2025 |>
  summarize(
    total_ela = sum(ela_valid_n, na.rm = TRUE),
    total_math = sum(math_valid_n, na.rm = TRUE)
  )
print(total_tested)
#> # A tibble: 1 × 2
#>   total_ela total_math
#>       <dbl>      <dbl>
#> 1    296913     296684

ggplot(tested_2025, aes(x = factor(grade), y = ela_valid_n)) +
  geom_col(fill = "#841617") +
  geom_text(aes(label = scales::comma(ela_valid_n)), vjust = -0.5, size = 3.5) +
  scale_y_continuous(labels = scales::comma, expand = expansion(mult = c(0, 0.1))) +
  labs(
    title = "Students Tested by Grade (2025)",
    subtitle = "ELA assessment",
    x = "Grade",
    y = "Students Tested"
  )
8. 541 Districts Report Assessment Data
Oklahoma’s fragmented system means 541 districts report OSTP data across grades 3-8.
n_dist <- assess_2025 |>
filter(aggregation_level == "district") |>
summarize(n_districts = n_distinct(district_id))
stopifnot(n_dist$n_districts > 0)
print(n_dist)
#> # A tibble: 1 × 1
#> n_districts
#> <int>
#> 1 541
# Count by year
assess_multi <- fetch_assessment_multi(c(2022, 2023, 2025), tidy = FALSE, use_cache = TRUE)
district_counts <- assess_multi |>
filter(aggregation_level == "district") |>
group_by(end_year) |>
summarize(n_districts = n_distinct(district_id), .groups = "drop")
print(district_counts)
#> # A tibble: 3 × 2
#> end_year n_districts
#> <dbl> <int>
#> 1 2022 543
#> 2 2023 531
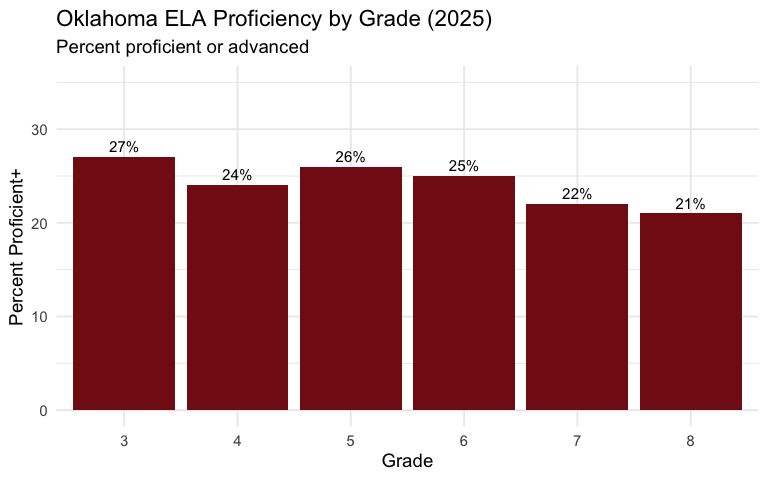
#> 3 2025 5419. ELA Proficiency Also Declines with Grade Level
Like math, ELA proficiency drops as students advance. Grade 3 is 27% proficient; by grade 8 it falls to 21%.
state_ela_2025 <- assess_2025 |>
  filter(is_state) |>
  select(grade, ela_proficient_plus_pct) |>
  filter(!is.na(ela_proficient_plus_pct))

stopifnot(nrow(state_ela_2025) > 0)
print(state_ela_2025)
#> # A tibble: 6 × 2
#>   grade ela_proficient_plus_pct
#>   <dbl>                   <dbl>
#> 1     3                      27
#> 2     4                      24
#> 3     5                      26
#> 4     6                      25
#> 5     7                      22
#> 6     8                      21

ggplot(state_ela_2025, aes(x = factor(grade), y = ela_proficient_plus_pct)) +
  geom_col(fill = "#841617") +
  geom_text(aes(label = paste0(ela_proficient_plus_pct, "%")),
            vjust = -0.5, size = 4) +
  scale_y_continuous(limits = c(0, 35)) +
  labs(
    title = "Oklahoma ELA Proficiency by Grade (2025)",
    subtitle = "Percent proficient or advanced",
    x = "Grade",
    y = "Percent Proficient+"
  )
10. Science Tested Only in Grades 5 and 8
Science proficiency is tested only in grades 5 and 8. In 2025, 33% of 5th graders and 35% of 8th graders were proficient – higher than math.
Data Notes
- Source: Oklahoma State Department of Education (OSDE), State Testing Resources
- Assessment: Oklahoma School Testing Program (OSTP) for grades 3-8
- Subjects: ELA, Mathematics, and Science (grades 5 and 8 only)
- Proficiency Levels: Below Basic, Basic, Proficient, Advanced
- Years Available: 2017-2019, 2022-2025 (no 2020-2021 due to COVID-19)
-
Suppression: Data shown as
***when counts are too low to protect student privacy - 2024 anomaly: 2024 results show substantially higher proficiency rates (e.g., Grade 3 ELA 51% vs 27-29% in other years), likely reflecting an assessment framework or scoring change
sessionInfo()
#> R version 4.5.2 (2025-10-31)
#> Platform: x86_64-pc-linux-gnu
#> Running under: Ubuntu 24.04.3 LTS
#>
#> Matrix products: default
#> BLAS:   /usr/lib/x86_64-linux-gnu/openblas-pthread/libblas.so.3
#> LAPACK: /usr/lib/x86_64-linux-gnu/openblas-pthread/libopenblasp-r0.3.26.so;  LAPACK version 3.12.0
#>
#> locale:
#>  [1] LC_CTYPE=C.UTF-8       LC_NUMERIC=C           LC_TIME=C.UTF-8
#>  [4] LC_COLLATE=C.UTF-8     LC_MONETARY=C.UTF-8    LC_MESSAGES=C.UTF-8
#>  [7] LC_PAPER=C.UTF-8       LC_NAME=C              LC_ADDRESS=C
#> [10] LC_TELEPHONE=C         LC_MEASUREMENT=C.UTF-8 LC_IDENTIFICATION=C
#>
#> time zone: UTC
#> tzcode source: system (glibc)
#>
#> attached base packages:
#> [1] stats     graphics  grDevices utils     datasets  methods   base
#>
#> other attached packages:
#> [1] ggplot2_4.0.2      tidyr_1.3.2        dplyr_1.2.0        okschooldata_0.1.0
#>
#> loaded via a namespace (and not attached):
#>  [1] rappdirs_0.3.4     sass_0.4.10        utf8_1.2.6         generics_0.1.4
#>  [5] hms_1.1.4          digest_0.6.39      magrittr_2.0.4     evaluate_1.0.5
#>  [9] grid_4.5.2         RColorBrewer_1.1-3 fastmap_1.2.0      cellranger_1.1.0
#> [13] jsonlite_2.0.0     httr_1.4.8         purrr_1.2.1        scales_1.4.0
#> [17] codetools_0.2-20   textshaping_1.0.5  jquerylib_0.1.4    cli_3.6.5
#> [21] rlang_1.1.7        crayon_1.5.3       bit64_4.6.0-1      withr_3.0.2
#> [25] cachem_1.1.0       yaml_2.3.12        tools_4.5.2        parallel_4.5.2
#> [29] tzdb_0.5.0         curl_7.0.0         vctrs_0.7.1        R6_2.6.1
#> [33] lifecycle_1.0.5    fs_1.6.7           bit_4.6.0          vroom_1.7.0
#> [37] ragg_1.5.1         pkgconfig_2.0.3    desc_1.4.3         pkgdown_2.2.0
#> [41] pillar_1.11.1      bslib_0.10.0       gtable_0.3.6       glue_1.8.0
#> [45] systemfonts_1.3.2  xfun_0.56          tibble_3.3.1       tidyselect_1.2.1
#> [49] knitr_1.51         farver_2.1.2       htmltools_0.5.9    rmarkdown_2.30
#> [53] labeling_0.4.3     readr_2.2.0        compiler_4.5.2     S7_0.2.1
#> [57] readxl_1.4.5