Fetch and analyze Oklahoma school enrollment and assessment data from the Oklahoma State Department of Education (OSDE) in R or Python. 10 years of enrollment data (2016-2025) and 7 years of OSTP assessment data (2017-2019, 2022-2025) for every school, district, and the state.
Part of the njschooldata family.
Full documentation — all 16 stories with interactive charts, getting-started guide, and complete function reference.
Highlights
library(okschooldata)
library(dplyr)
library(tidyr)
library(ggplot2)
theme_set(theme_minimal(base_size = 14))

enr_multi <- fetch_enr_multi(c(2016, 2017, 2019, 2021, 2022, 2023), use_cache = TRUE)

assess_2025 <- fetch_assessment(2025, tidy = FALSE, use_cache = TRUE)
1. EPIC Charter Schools: From 6,000 to 60,000 and Back
EPIC Charter Schools (virtual) grew from 6,037 students in 2016 to a staggering 59,445 in 2021, making it the largest educational entity in Oklahoma. After a financial scandal and state audit, enrollment fell back to 28,478 by 2023.
epic_trend <- enr_multi |>
  filter(is_district, grepl("EPIC|Epic", district_name, ignore.case = TRUE),
         subgroup == "total_enrollment", grade_level == "TOTAL") |>
  group_by(end_year) |>
  summarize(n_students = sum(n_students), .groups = "drop") |>
  arrange(end_year)

stopifnot(nrow(epic_trend) > 0)
print(epic_trend)
#> # A tibble: 6 x 2
#>   end_year n_students
#>      <int>      <dbl>
#> 1     2016       6037
#> 2     2017       9077
#> 3     2019      21305
#> 4     2021      59445
#> 5     2022      38334
#> 6     2023      28478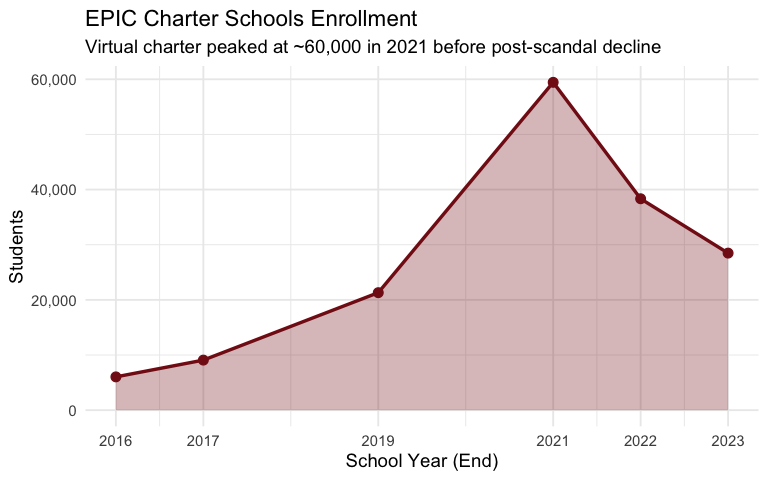
2. Only 17% of 8th Graders Are Proficient in Math
Oklahoma’s math proficiency rates decline sharply with grade level. In 2025, 33% of 3rd graders were proficient, but only 17% of 8th graders cleared the bar.
state_math_2025 <- assess_2025 |>
  filter(is_state) |>
  select(grade, math_proficient_plus_pct) |>
  filter(!is.na(math_proficient_plus_pct))

stopifnot(nrow(state_math_2025) > 0)
print(state_math_2025)
#> # A tibble: 6 x 2
#>   grade math_proficient_plus_pct
#>   <dbl>                    <dbl>
#> 1     3                       33
#> 2     4                       33
#> 3     5                       27
#> 4     6                       24
#> 5     7                       25
#> 6     8                       17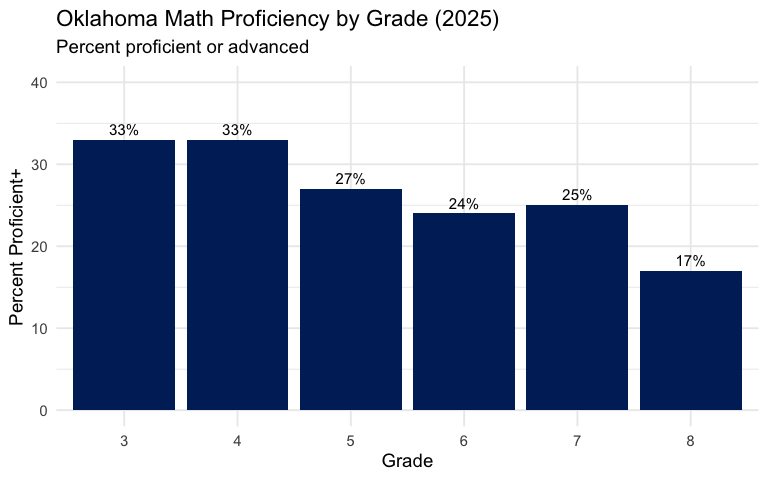
3. Oklahoma City Lost 27% of Its Students Since 2016
Oklahoma City Public Schools (55I089) shed over 12,000 students from 2016 to 2023, a decline of 27.1% – the steepest drop of any large Oklahoma district. The district went from being the state’s largest to trading places with Tulsa.
okc_trend <- enr_multi |>
  filter(is_district, district_id == "55I089",
         subgroup == "total_enrollment", grade_level == "TOTAL") |>
  select(end_year, district_name, n_students) |>
  arrange(end_year)

stopifnot(nrow(okc_trend) > 0)
print(okc_trend)
#>   end_year district_name n_students
#> 1     2016 OKLAHOMA CITY      45577
#> 2     2017 OKLAHOMA CITY      45757
#> 3     2019 OKLAHOMA CITY      44138
#> 4     2021 OKLAHOMA CITY      37344
#> 5     2022 OKLAHOMA CITY      32086
#> 6     2023 OKLAHOMA CITY      33245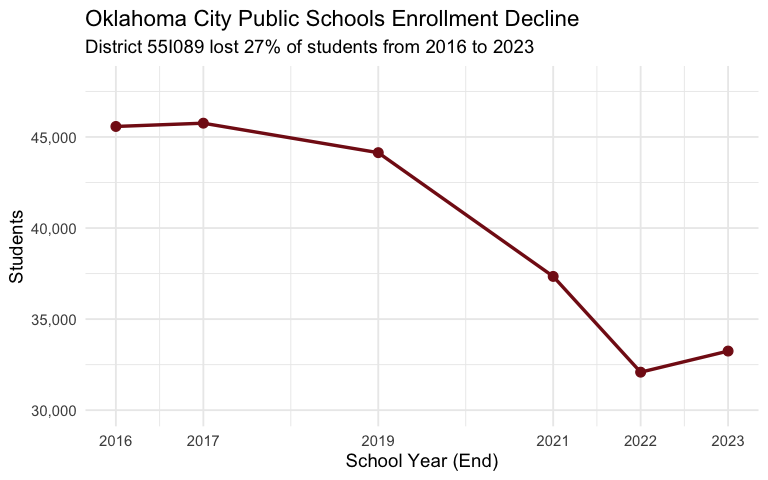
Data Taxonomy
| Category | Years | Function | Details |
|---|---|---|---|
| Enrollment | 2016-2025 |
fetch_enr() / fetch_enr_multi()
|
State, district, campus. Total enrollment by grade |
| Assessments | 2017-2019, 2022-2025 |
fetch_assessment() / fetch_assessment_multi()
|
State, district. ELA, Math, Science (grades 3-8) |
| Graduation | — | — | Not yet available |
| Directory | 2025-2026 | fetch_directory() |
District and site directories |
| Per-Pupil Spending | — | — | Not yet available |
| Accountability | — | — | Not yet available |
| Chronic Absence | — | — | Not yet available |
| EL Progress | — | — | Not yet available |
| Special Ed | — | — | Not yet available |
See DATA-CATEGORY-TAXONOMY.md for what each category covers.
Quick Start
R - Enrollment
library(okschooldata)
library(dplyr)

# Get 2023 enrollment data (2022-23 school year)
enr <- fetch_enr(2023)

# Statewide total
enr |>
  filter(is_state, subgroup == "total_enrollment", grade_level == "TOTAL") |>
  pull(n_students)
#> 701258

# Top 10 districts
enr |>
  filter(is_district, subgroup == "total_enrollment", grade_level == "TOTAL") |>
  arrange(desc(n_students)) |>
  select(district_name, n_students) |>
  head(10)

# Get multiple years
enr_multi <- fetch_enr_multi(c(2016, 2017, 2019, 2021, 2022, 2023))
R - Assessment
library(okschooldata)
library(dplyr)

# Get 2025 assessment data (OSTP)
assess <- fetch_assessment(2025, tidy = FALSE)

# Statewide math proficiency by grade
assess |>
  filter(is_state) |>
  select(grade, math_proficient_plus_pct)

# Get multiple years
assess_multi <- fetch_assessment_multi(c(2022, 2023, 2025))
Python - Enrollment
import pyokschooldata as ok

# Get 2023 enrollment data (2022-23 school year)
df = ok.fetch_enr(2023)

# Statewide total
state_total = df[(df['is_state'] == True) &
                 (df['subgroup'] == 'total_enrollment') &
                 (df['grade_level'] == 'TOTAL')]
print(state_total['n_students'].values[0])

# Top 10 districts
districts = df[(df['is_district'] == True) &
               (df['subgroup'] == 'total_enrollment') &
               (df['grade_level'] == 'TOTAL')]
print(districts.nlargest(10, 'n_students')[['district_name', 'n_students']])Explore More
Full analysis with 16 stories across two vignettes: - Enrollment trends — 10 stories - Assessment analysis — 10 stories - Function reference
Data Notes
Enrollment Data Source
Enrollment data is sourced directly from the Oklahoma State Department of Education (OSDE). OSDE publishes enrollment counts by school, district, and statewide for each school year.
Assessment Data Source
Assessment data is sourced from OSDE’s State Testing Resources. OSTP results include proficiency levels for ELA, Math, and Science.
Reporting Period
- Enrollment: Based on the first Monday of October student count (Census Day)
- Assessment: OSTP administered in spring; results reflect that school year
Known Data Caveats
- Demographics not in enrollment files: OSDE enrollment Excel files contain only total counts by grade, not race/ethnicity or special population breakdowns
- 2024 assessment anomaly: 2024 OSTP results show substantially higher proficiency (e.g., Grade 3 ELA 51% vs 27-29% other years), likely due to an assessment framework change
-
County names are ALL CAPS in the data (e.g.,
OKLAHOMA,TULSA) -
Charter school classification: Charter schools use district type codes Z and G (e.g.,
55Z014for EPIC) - Virtual schools: EPIC and other virtual schools are included as regular districts but serve students across traditional geographic boundaries
- Enrollment parser issues: Years 2018 (comparison format), 2020 (double-counted), and 2024-2025 (new format) have parsing bugs
- District ID 55I001 is Putnam City, NOT Oklahoma City (which is 55I089)
Deeper Dive
Data note: Enrollment years 2018, 2020, 2024, and 2025 have parser issues with OSDE file format changes and are excluded from multi-year analyses. Known-good years: 2016, 2017, 2019, 2021, 2022, 2023.
4. Statewide Enrollment Grew Modestly Despite Urban Losses
Despite OKC’s 27% decline, statewide enrollment grew from 692,670 to 701,258 between 2016 and 2023 – a modest 1.2% gain. Suburban growth and charter expansion offset urban losses.
state_trend <- enr_multi |>
  filter(is_state, subgroup == "total_enrollment", grade_level == "TOTAL") |>
  select(end_year, n_students) |>
  arrange(end_year)

stopifnot(nrow(state_trend) > 0)
print(state_trend)
#>   end_year n_students
#> 1     2016     692670
#> 2     2017     693710
#> 3     2019     698586
#> 4     2021     694113
#> 5     2022     698696
#> 6     2023     701258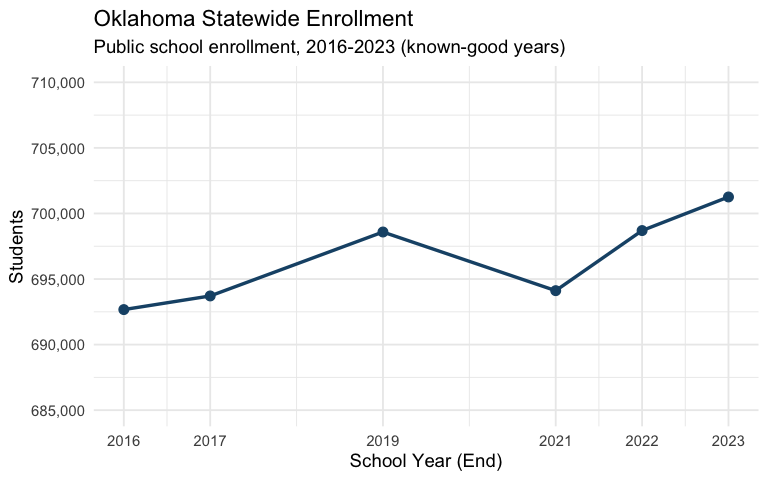
5. Suburban Boomtowns: Piedmont and Deer Creek Lead Growth
Piedmont (+38.6%) and Deer Creek (+35.7%) led enrollment growth among mid-to-large districts from 2016 to 2023. These OKC-area suburban districts absorbed families leaving urban cores.
growth <- enr_multi |>
  filter(is_district, subgroup == "total_enrollment", grade_level == "TOTAL",
         end_year %in% c(2016, 2023)) |>
  select(end_year, district_id, district_name, n_students) |>
  pivot_wider(names_from = end_year, values_from = n_students, names_prefix = "yr_") |>
  filter(!is.na(yr_2016), !is.na(yr_2023), yr_2016 >= 500) |>
  mutate(
    change = yr_2023 - yr_2016,
    pct_change = round(change / yr_2016 * 100, 1)
  ) |>
  arrange(desc(pct_change))

top_growers <- head(growth, 10)
stopifnot(nrow(top_growers) > 0)
print(top_growers |> select(district_name, yr_2016, yr_2023, pct_change))
#> # A tibble: 10 x 4
#>    district_name                 yr_2016 yr_2023 pct_change
#>    <chr>                           <dbl>   <dbl>      <dbl>
#>  1 CASHION                           517     725       40.2
#>  2 PIEDMONT                         3649    5056       38.6
#>  3 OKLAHOMA VIRTUAL CHARTER ACAD    2400    3259       35.8
#>  4 DEER CREEK                       5628    7636       35.7
#>  5 SILO                              889    1157       30.1
#>  6 KIEFER                            731     951       30.1
#>  7 BIXBY                            6046    7800       29
#>  8 ASTEC CHARTERS                    928    1166       25.6
#>  9 MUSTANG                         10798   13494       25
#> 10 COLCORD                           607     756       24.5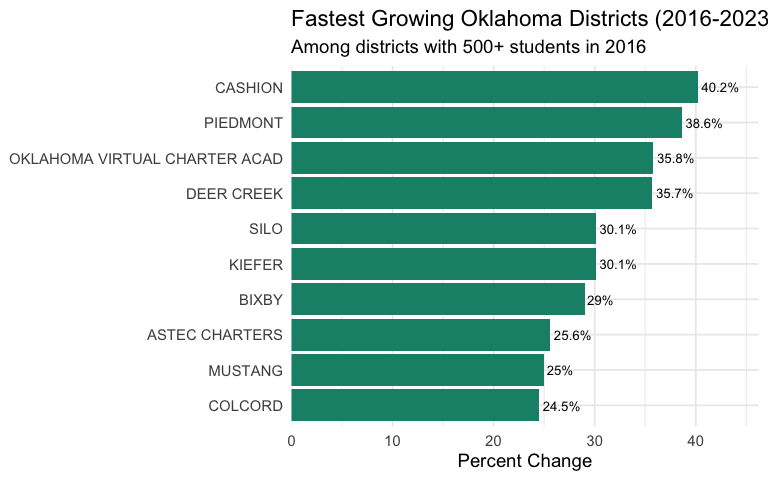
6. Top 10 Districts by Enrollment
Tulsa narrowly edges Oklahoma City as the state’s largest traditional district, while EPIC Charter and Edmond compete for third.
top10 <- enr_multi |>
  filter(is_district, subgroup == "total_enrollment", grade_level == "TOTAL",
         end_year == 2023) |>
  select(district_id, district_name, n_students) |>
  arrange(desc(n_students)) |>
  head(10)

stopifnot(nrow(top10) > 0)
print(top10)
#>    district_id       district_name n_students
#> 1       72I001               TULSA      33871
#> 2       55I089       OKLAHOMA CITY      33245
#> 3       55Z014 Epic Charter School      28478
#> 4       55I012              EDMOND      26190
#> 5       14I002               MOORE      24632
#> 6       72I003        BROKEN ARROW      20115
#> 7       55I001         PUTNAM CITY      18905
#> 8       14I029              NORMAN      15786
#> 9       72I009               UNION      14890
#> 10      16I008              LAWTON      13979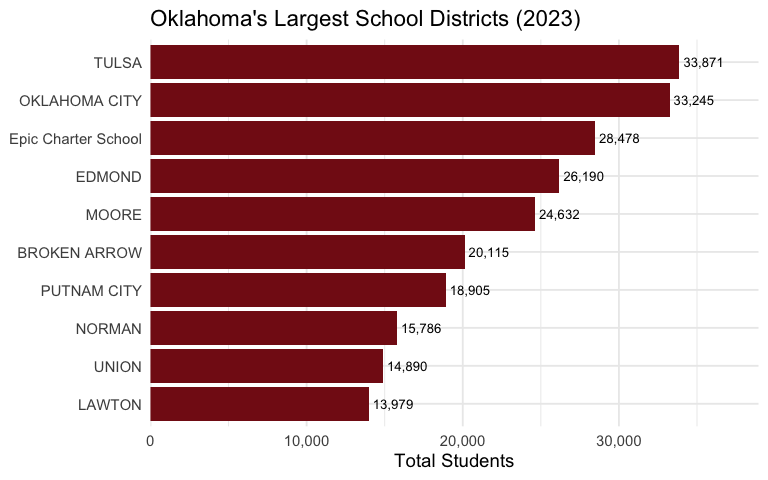
7. Two Counties Hold 40% of All Students
Oklahoma and Tulsa counties together enroll 282,607 students – 40.3% of the entire state.
county_enr <- enr_multi |>
  filter(is_district, grade_level == "TOTAL", subgroup == "total_enrollment",
         end_year == 2023) |>
  group_by(county) |>
  summarize(n_students = sum(n_students, na.rm = TRUE), .groups = "drop") |>
  filter(!is.na(county)) |>
  arrange(desc(n_students)) |>
  head(10)

stopifnot(nrow(county_enr) > 0)
print(county_enr)
#> # A tibble: 10 x 2
#>    county       n_students
#>    <chr>             <dbl>
#>  1 OKLAHOMA         161956
#>  2 TULSA            120651
#>  3 CLEVELAND         45975
#>  4 CANADIAN          32393
#>  5 COMANCHE          21147
#>  6 ROGERS            13265
#>  7 POTTAWATOMIE      12535
#>  8 CREEK             12110
#>  9 MUSKOGEE          11878
#> 10 GARFIELD          11055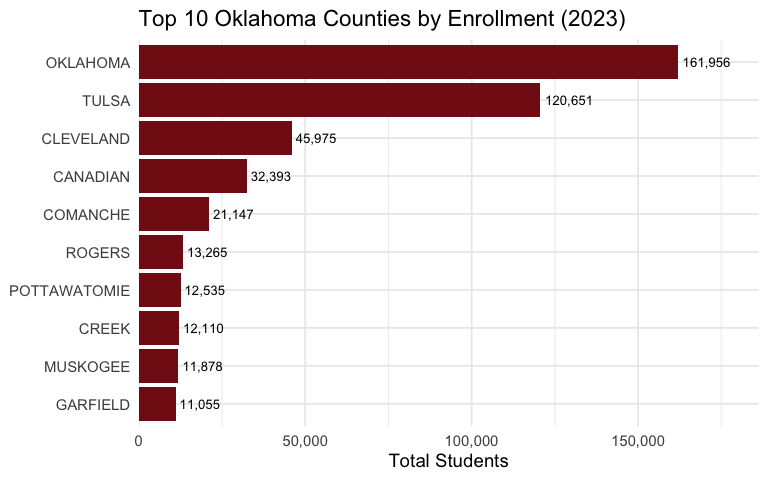
8. 309 Districts Have Fewer Than 500 Students
Oklahoma’s 543 districts include 309 with fewer than 500 students. Only 13 districts top 10,000.
size_dist <- enr_multi |>
  filter(is_district, subgroup == "total_enrollment", grade_level == "TOTAL",
         end_year == 2023) |>
  mutate(
    size_bucket = case_when(
      n_students < 100 ~ "Under 100",
      n_students < 500 ~ "100-499",
      n_students < 1000 ~ "500-999",
      n_students < 5000 ~ "1,000-4,999",
      n_students < 10000 ~ "5,000-9,999",
      TRUE ~ "10,000+"
    ),
    size_bucket = factor(size_bucket,
      levels = c("Under 100", "100-499", "500-999",
                 "1,000-4,999", "5,000-9,999", "10,000+"))
  ) |>
  count(size_bucket)

stopifnot(nrow(size_dist) > 0)
print(size_dist)
#>     size_bucket   n
#> 1     Under 100  35
#> 2       100-499 274
#> 3       500-999 102
#> 4   1,000-4,999 109
#> 5   5,000-9,999  10
#> 6       10,000+  13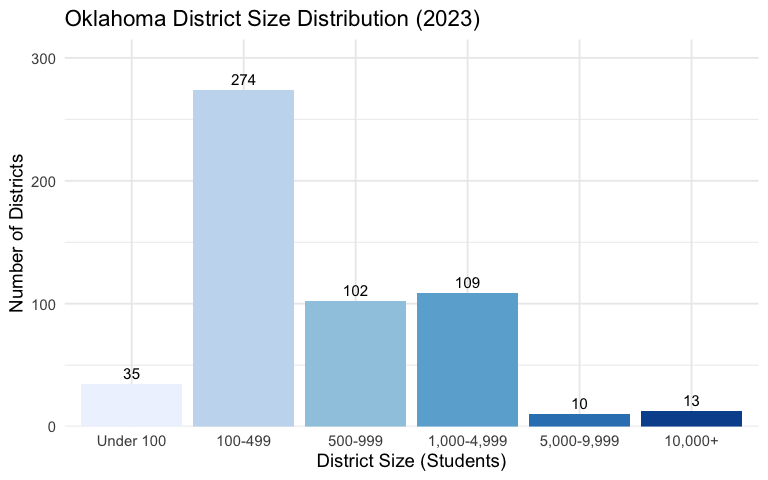
9. Southeast Oklahoma Is Shrinking
The 10 southeastern counties (McCurtain, Pushmataha, Choctaw, LeFlore, Latimer, Pittsburg, Atoka, Bryan, Coal, Haskell) lost 3.7% of enrollment while the rest of the state grew 1.5%.
se_counties <- c("MCCURTAIN", "PUSHMATAHA", "CHOCTAW", "LEFLORE", "LATIMER",
                 "PITTSBURG", "ATOKA", "BRYAN", "COAL", "HASKELL")

region_trend <- enr_multi |>
  filter(is_district, subgroup == "total_enrollment", grade_level == "TOTAL") |>
  mutate(region = if_else(county %in% se_counties, "Southeast", "Rest of State")) |>
  group_by(end_year, region) |>
  summarize(n_students = sum(n_students), .groups = "drop") |>
  group_by(region) |>
  mutate(index = round(n_students / first(n_students) * 100, 1)) |>
  ungroup()

stopifnot(nrow(region_trend) > 0)
print(region_trend)
#> # A tibble: 12 x 4
#>    end_year region        n_students index
#>       <int> <chr>              <dbl> <dbl>
#>  1     2016 Rest of State     657935 100
#>  2     2016 Southeast          34735 100
#>  3     2017 Rest of State     659040 100.2
#>  4     2017 Southeast          34670  99.8
#>  5     2019 Rest of State     664703 101
#>  6     2019 Southeast          33883  97.5
#>  7     2021 Rest of State     662068 100.6
#>  8     2021 Southeast          32045  92.3
#>  9     2022 Rest of State     665768 101.2
#> 10     2022 Southeast          32928  94.8
#> 11     2023 Rest of State     667791 101.5
#> 12     2023 Southeast          33467  96.3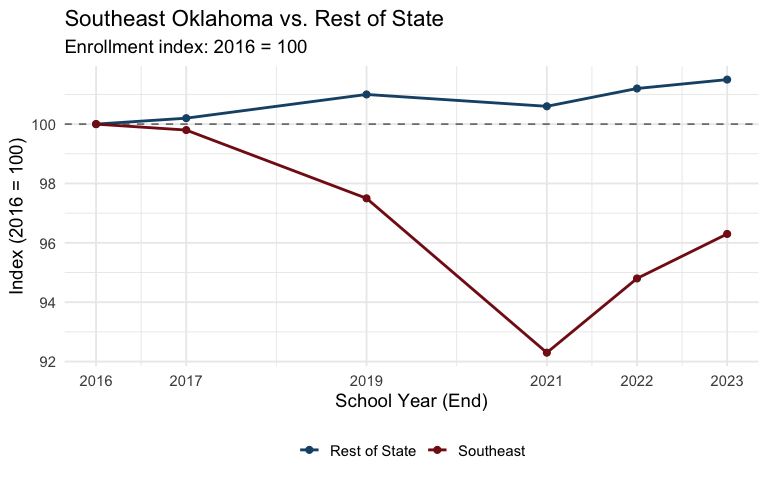
10. Kindergarten Enrollment Dropped 6% Since 2016
Kindergarten enrollment fell from 53,453 in 2016 to 50,009 in 2023. The COVID-era dip in 2021 (50,351) barely recovered.
k_trend <- enr_multi |>
  filter(is_state, subgroup == "total_enrollment", grade_level == "K") |>
  select(end_year, n_students) |>
  arrange(end_year)

stopifnot(nrow(k_trend) > 0)
print(k_trend)
#>   end_year n_students
#> 1     2016      53453
#> 2     2017      52184
#> 3     2019      52515
#> 4     2021      50351
#> 5     2022      51272
#> 6     2023      50009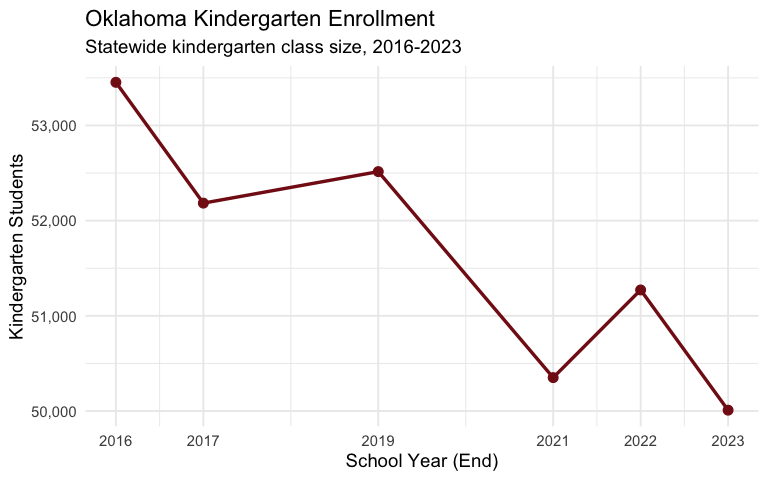
11. Tulsa and OKC Follow the Same Downward Path
Both Tulsa (72I001) and Oklahoma City (55I089) experienced parallel enrollment declines since 2016, losing students to suburban districts and virtual schools.
urban_trend <- enr_multi |>
  filter(is_district, district_id %in% c("55I089", "72I001"),
         subgroup == "total_enrollment", grade_level == "TOTAL") |>
  mutate(district_label = case_when(
    district_id == "55I089" ~ "Oklahoma City",
    district_id == "72I001" ~ "Tulsa"
  )) |>
  select(end_year, district_label, n_students)

stopifnot(nrow(urban_trend) > 0)
print(urban_trend)
#>    end_year district_label n_students
#> 1      2016  Oklahoma City      45577
#> 2      2016          Tulsa      40867
#> 3      2017  Oklahoma City      45757
#> 4      2017          Tulsa      40459
#> 5      2019  Oklahoma City      44138
#> 6      2019          Tulsa      39056
#> 7      2021  Oklahoma City      37344
#> 8      2021          Tulsa      35765
#> 9      2022  Oklahoma City      32086
#> 10     2022          Tulsa      33211
#> 11     2023  Oklahoma City      33245
#> 12     2023          Tulsa      33871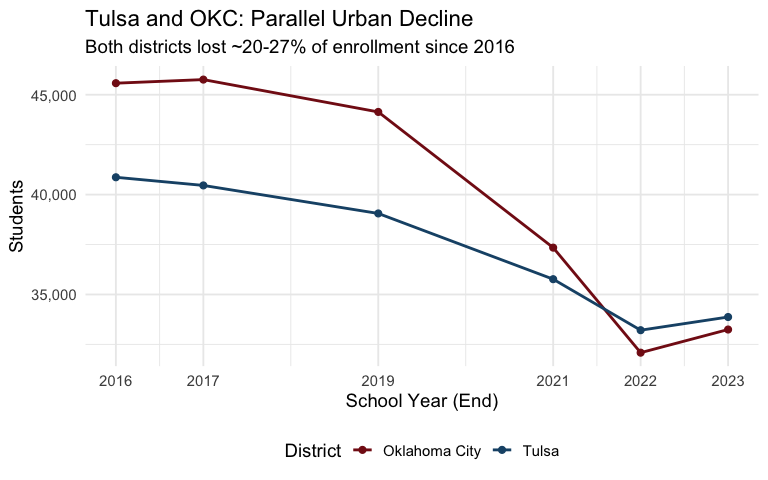
12. Oklahoma City Students Are Half as Likely to Be Proficient as the State Average
OKC Public Schools (55I089) posted 15% math proficiency and 14% ELA proficiency in Grade 3 for 2025, compared to the state’s 33% and 27%.
state_g3 <- assess_2025 |>
  filter(is_state, grade == 3) |>
  select(ela_proficient_plus_pct, math_proficient_plus_pct) |>
  mutate(entity = "State")

okc_g3 <- assess_2025 |>
  filter(aggregation_level == "district", district_id == "55I089", grade == 3) |>
  select(ela_proficient_plus_pct, math_proficient_plus_pct) |>
  mutate(entity = "OKC Public Schools")

compare_g3 <- bind_rows(state_g3, okc_g3) |>
  pivot_longer(cols = c(ela_proficient_plus_pct, math_proficient_plus_pct),
               names_to = "subject", values_to = "pct") |>
  mutate(subject = if_else(subject == "ela_proficient_plus_pct", "ELA", "Math"))

stopifnot(nrow(compare_g3) > 0)
print(compare_g3)
#> # A tibble: 4 x 3
#>   entity             subject   pct
#>   <chr>              <chr>   <dbl>
#> 1 State              ELA        27
#> 2 State              Math       33
#> 3 OKC Public Schools ELA        14
#> 4 OKC Public Schools Math       15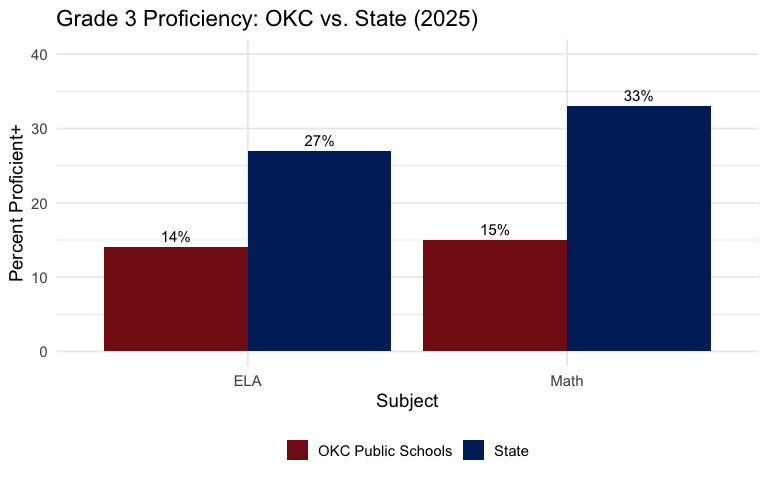
13. Edmond Outperforms the State by 15-20 Points
Edmond (55I012) posted 48% math and 42% ELA proficiency in Grade 3 – far above state averages, illustrating the suburban advantage.
edmond_assess <- assess_2025 |>
  filter(aggregation_level == "district", district_id == "55I012") |>
  select(grade, group_name, ela_proficient_plus_pct, math_proficient_plus_pct)

stopifnot(nrow(edmond_assess) > 0)
print(edmond_assess)
#> # A tibble: 6 x 4
#>   grade group_name ela_proficient_plus_pct math_proficient_plus_pct
#>   <dbl> <chr>                        <dbl>                    <dbl>
#> 1     3 Edmond                          42                       48
#> 2     4 Edmond                          35                       45
#> 3     5 Edmond                          44                       44
#> 4     6 Edmond                          35                       37
#> 5     7 Edmond                          34                       37
#> 6     8 Edmond                          32                       22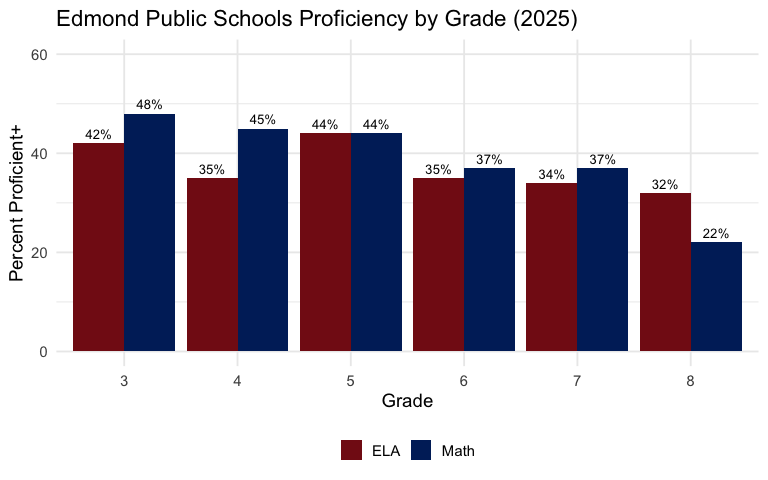
14. Tulsa’s 6% 8th Grade Math Proficiency Rate
Tulsa Public Schools (72I001) had only 6% of 8th graders proficient in math in 2025. Across all grades, Tulsa trailed the state by 10-15 points.
tulsa_assess <- assess_2025 |>
  filter(aggregation_level == "district", district_id == "72I001") |>
  select(grade, group_name, ela_proficient_plus_pct, math_proficient_plus_pct)

stopifnot(nrow(tulsa_assess) > 0)
print(tulsa_assess)
#> # A tibble: 6 x 4
#>   grade group_name ela_proficient_plus_pct math_proficient_plus_pct
#>   <dbl> <chr>                        <dbl>                    <dbl>
#> 1     3 Tulsa                           14                       16
#> 2     4 Tulsa                           12                       15
#> 3     5 Tulsa                           15                       12
#> 4     6 Tulsa                           15                        9
#> 5     7 Tulsa                           11                       11
#> 6     8 Tulsa                           13                        6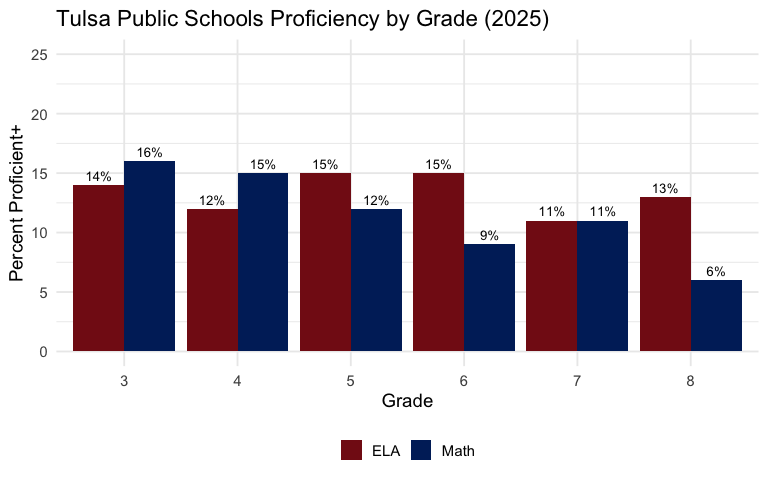
15. ELA: 43% of 3rd Graders Score Below Basic
ELA results are even more concerning than math. 43% of 3rd graders scored Below Basic in ELA in 2025, with only 27% reaching Proficient or Advanced.
g3_2025 <- assess_2025 |> filter(is_state, grade == 3)

ela_dist <- data.frame(
  level = c("Below Basic", "Basic", "Proficient", "Advanced"),
  pct = c(g3_2025$ela_below_basic_pct,
          g3_2025$ela_basic_pct,
          g3_2025$ela_proficient_pct,
          g3_2025$ela_advanced_pct)
)
ela_dist$level <- factor(ela_dist$level,
                         levels = c("Below Basic", "Basic", "Proficient", "Advanced"))

stopifnot(nrow(ela_dist) > 0)
print(ela_dist)
#>         level pct
#> 1 Below Basic  43
#> 2       Basic  30
#> 3  Proficient  24
#> 4    Advanced   3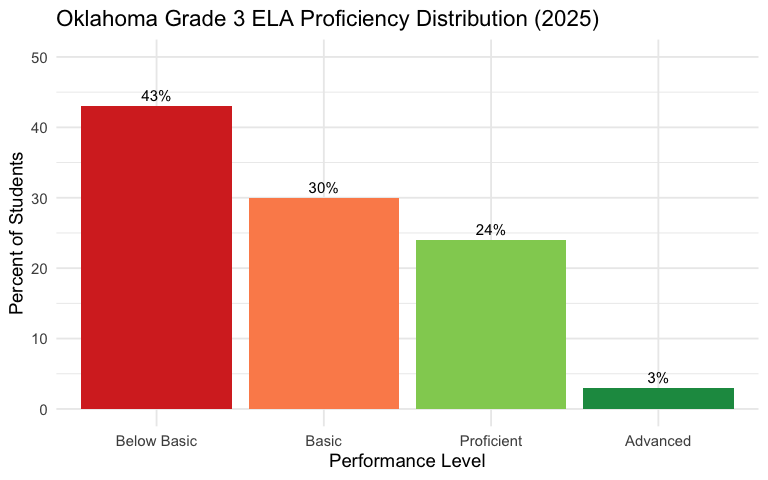
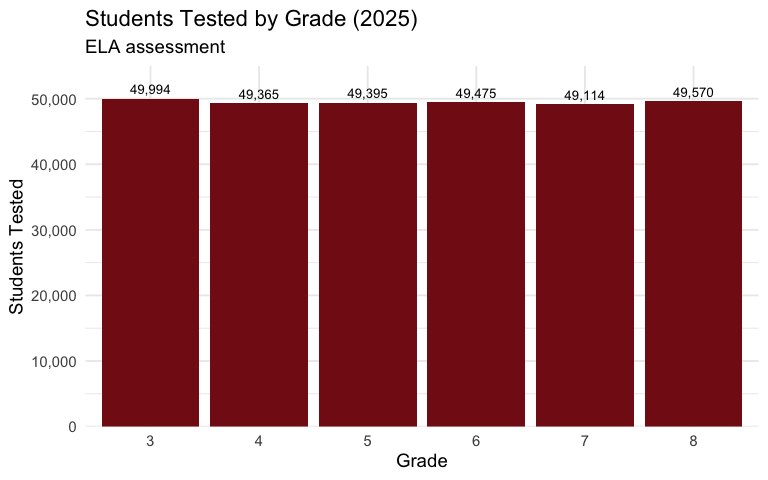
16. Nearly 297,000 Students Tested Statewide
Oklahoma tested approximately 297,000 students in grades 3-8 for both ELA and Math in 2025.
tested_2025 <- assess_2025 |>
  filter(is_state) |>
  select(grade, ela_valid_n, math_valid_n)

stopifnot(nrow(tested_2025) > 0)
print(tested_2025)
#> # A tibble: 6 x 3
#>   grade ela_valid_n math_valid_n
#>   <dbl>       <dbl>        <dbl>
#> 1     3       49994        49954
#> 2     4       49365        49339
#> 3     5       49395        49362
#> 4     6       49475        49458
#> 5     7       49114        49080
#> 6     8       49570        49491

total_tested <- tested_2025 |>
  summarize(
    total_ela = sum(ela_valid_n, na.rm = TRUE),
    total_math = sum(math_valid_n, na.rm = TRUE)
  )
print(total_tested)
#> # A tibble: 1 x 2
#>   total_ela total_math
#>       <dbl>      <dbl>
#> 1    296913     296684