Overview
This vignette performs data quality assurance checks on California
enrollment data fetched using the caschooldata package. We
analyze:
- Statewide enrollment time series and year-over-year changes
- Major district enrollment patterns
- Data completeness and anomalies
- Known data quality issues
Data Availability Note
The California Department of Education provides enrollment data in two formats:
- Modern Census Day format (2024-2025): Files with comprehensive demographic breakdowns, aggregation levels (state/county/district/school), and Transitional Kindergarten data.
- Historical format (2018-2023): School-level files with race/ethnicity and gender data. District, county, and state aggregates are computed from school-level records.
This QA report analyzes both historical and modern data to validate time series consistency.
Fetch Available Data
# Fetch historical and modern enrollment data
# Historical years (2018-2023) use school-level files
# Modern years (2024-2025) use Census Day files with all aggregation levels
# NOTE: Limited to 2023-2024 to reduce memory usage for vignette building
years <- c(2023, 2024)
enr <- fetch_enr_multi(years, use_cache = TRUE)

# Check what we got
enr %>%
  group_by(end_year) %>%
  summarize(
    n_records = n(),
    n_schools = sum(is_school & grade_level == "TOTAL" & reporting_category == "TA"),
    n_districts = sum(is_district & grade_level == "TOTAL" & reporting_category == "TA"),
    n_counties = sum(is_county & grade_level == "TOTAL" & reporting_category == "TA"),
    .groups = "drop"
  )
## # A tibble: 2 × 5
## end_year n_records n_schools n_districts n_counties
## <int> <int> <int> <int> <int>
## 1 2023 1559572 10581 1018 58
## 2 2024 2712729 10579 2354 169Statewide Enrollment Time Series
Total Enrollment by Year
state_totals <- enr %>%
  filter(
    is_state,
    grade_level == "TOTAL",
    reporting_category == "TA",  # Total All
    charter_status == "All"     # Overall total (not charter-specific)
  ) %>%
  select(end_year, n_students) %>%
  arrange(end_year)

stopifnot(nrow(state_totals) > 0)

state_totals
## # A tibble: 2 × 2
## end_year n_students
## <int> <dbl>
## 1 2023 5852544
## 2 2024 5837690Year-over-Year Changes
Checking for enrollment jumps greater than 5%:
state_yoy <- state_totals %>%
  arrange(end_year) %>%
  mutate(
    prev_year = lag(n_students),
    change = n_students - prev_year,
    pct_change = (n_students - prev_year) / prev_year * 100
  )

state_yoy
## # A tibble: 2 × 5
## end_year n_students prev_year change pct_change
## <int> <dbl> <dbl> <dbl> <dbl>
## 1 2023 5852544 NA NA NA
## 2 2024 5837690 5852544 -14854 -0.254
# Flag any large changes (>5%)
large_changes <- state_yoy %>%
  filter(abs(pct_change) > 5)

if (nrow(large_changes) > 0) {
  cat("WARNING: Year-over-year changes exceeding 5%:\n")
  print(large_changes)
} else {
  cat("No year-over-year changes exceeding 5% threshold.\n")
}
## No year-over-year changes exceeding 5% threshold.Statewide Enrollment Visualization
ggplot(state_totals, aes(x = factor(end_year), y = n_students)) +
  geom_col(fill = "steelblue") +
  geom_text(aes(label = scales::comma(n_students)), vjust = -0.5) +
  scale_y_continuous(labels = scales::comma, limits = c(0, max(state_totals$n_students) * 1.1)) +
  labs(
    title = "California K-12 Enrollment by Year",
    subtitle = "Census Day Enrollment (First Wednesday in October)",
    x = "School Year End",
    y = "Total Enrollment"
  ) +
  theme_minimal()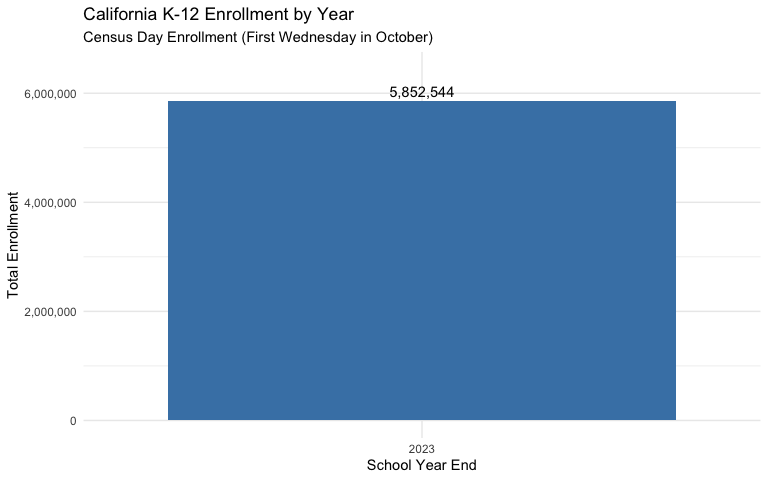
Major District Analysis
We analyze the five largest school districts in California:
- Los Angeles Unified School District
- San Diego Unified School District
- Long Beach Unified School District
- Fresno Unified School District
- Santa Ana Unified School District
# Define major districts by name pattern matching
major_district_patterns <- c(
  "Los Angeles Unified",
  "San Diego Unified",
  "Long Beach Unified",
  "Fresno Unified",
  "Santa Ana Unified"
)

# Find these districts in the data
district_totals <- enr %>%
  filter(
    is_district,
    grade_level == "TOTAL",
    reporting_category == "TA"
  )

# Match district names
major_districts <- district_totals %>%
  filter(
    grepl("Los Angeles Unified", district_name, ignore.case = TRUE) |
    grepl("San Diego Unified", district_name, ignore.case = TRUE) |
    grepl("Long Beach Unified", district_name, ignore.case = TRUE) |
    grepl("Fresno Unified", district_name, ignore.case = TRUE) |
    grepl("Santa Ana Unified", district_name, ignore.case = TRUE)
  ) %>%
  select(end_year, district_name, county_name, n_students, cds_code) %>%
  arrange(district_name, end_year)

# Display results
major_districts %>%
  pivot_wider(
    id_cols = c(district_name, county_name, cds_code),
    names_from = end_year,
    values_from = n_students,
    names_prefix = "enr_"
  )
## # A tibble: 10 × 5
## district_name county_name cds_code enr_2023 enr_2024
## <chr> <chr> <chr> <list> <list>
## 1 Fresno Unified FRESNO 10621660000000 <dbl [1]> <NULL>
## 2 Fresno Unified Fresno 106216600000NA <NULL> <dbl [3]>
## 3 Long Beach Unified LOS ANGELES 19647250000000 <dbl [1]> <NULL>
## 4 Long Beach Unified Los Angeles 196472500000NA <NULL> <dbl [3]>
## 5 Los Angeles Unified LOS ANGELES 19647330000000 <dbl [1]> <NULL>
## 6 Los Angeles Unified Los Angeles 196473300000NA <NULL> <dbl [3]>
## 7 San Diego Unified SAN DIEGO 37683380000000 <dbl [1]> <NULL>
## 8 San Diego Unified San Diego 376833800000NA <NULL> <dbl [3]>
## 9 Santa Ana Unified ORANGE 30666700000000 <dbl [1]> <NULL>
## 10 Santa Ana Unified Orange 306667000000NA <NULL> <dbl [3]>District Year-over-Year Changes
district_yoy <- major_districts %>%
  arrange(district_name, end_year) %>%
  group_by(district_name) %>%
  mutate(
    prev_year = lag(n_students),
    change = n_students - prev_year,
    pct_change = (n_students - prev_year) / prev_year * 100
  ) %>%
  ungroup() %>%
  filter(!is.na(pct_change))

# Check for large changes
district_large_changes <- district_yoy %>%
  filter(abs(pct_change) > 5)

if (nrow(district_large_changes) > 0) {
  cat("Districts with year-over-year changes exceeding 5%:\n")
  district_large_changes %>%
    select(district_name, end_year, n_students, prev_year, pct_change) %>%
    print()
} else {
  cat("No major districts have year-over-year changes exceeding 5%.\n")
}
## Districts with year-over-year changes exceeding 5%:
## # A tibble: 8 × 5
## district_name end_year n_students prev_year pct_change
## <chr> <int> <dbl> <dbl> <dbl>
## 1 Fresno Unified 2024 3234 68246 -95.3
## 2 Long Beach Unified 2024 301 63966 -99.5
## 3 Los Angeles Unified 2024 381116 529902 -28.1
## 4 Los Angeles Unified 2024 148786 381116 -61.0
## 5 San Diego Unified 2024 95492 114330 -16.5
## 6 San Diego Unified 2024 18838 95492 -80.3
## 7 Santa Ana Unified 2024 37663 40328 -6.61
## 8 Santa Ana Unified 2024 2665 37663 -92.9District Enrollment Visualization
ggplot(major_districts, aes(x = factor(end_year), y = n_students, fill = district_name)) +
  geom_col(position = "dodge") +
  scale_y_continuous(labels = scales::comma) +
  scale_fill_brewer(palette = "Set2") +
  labs(
    title = "Enrollment in Major California School Districts",
    x = "School Year End",
    y = "Total Enrollment",
    fill = "District"
  ) +
  theme_minimal() +
  theme(legend.position = "bottom")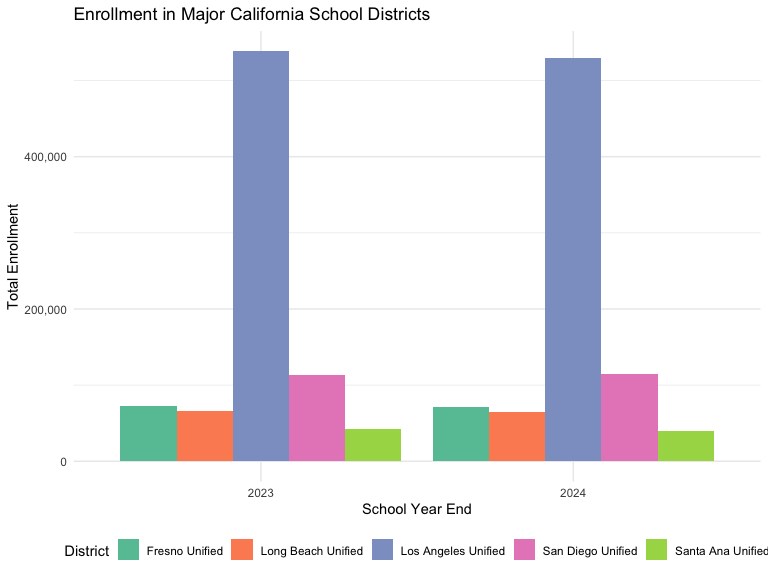
Data Completeness Analysis
Missing Data Check
# Check for missing values in key columns
missing_summary <- enr %>%
  filter(grade_level == "TOTAL", reporting_category == "TA") %>%
  summarize(
    total_records = n(),
    missing_n_students = sum(is.na(n_students)),
    missing_cds_code = sum(is.na(cds_code)),
    missing_district_name = sum(is.na(district_name) | district_name == ""),
    missing_school_name = sum(is_school & (is.na(school_name) | school_name == "")),
    .groups = "drop"
  )

missing_summary
## # A tibble: 1 × 5
## total_records missing_n_students missing_cds_code missing_district_name
## <int> <int> <int> <int>
## 1 24763 0 0 231
## # ℹ 1 more variable: missing_school_name <int>Aggregation Level Distribution
enr %>%
  filter(grade_level == "TOTAL", reporting_category == "TA") %>%
  group_by(end_year, agg_level) %>%
  summarize(
    n_entities = n(),
    total_enrollment = sum(n_students, na.rm = TRUE),
    .groups = "drop"
  ) %>%
  pivot_wider(
    names_from = agg_level,
    values_from = c(n_entities, total_enrollment)
  )
## # A tibble: 2 × 9
## end_year n_entities_C n_entities_D n_entities_S n_entities_T
## <int> <int> <int> <int> <int>
## 1 2023 58 1018 10581 1
## 2 2024 169 2354 10579 3
## # ℹ 4 more variables: total_enrollment_C <dbl>, total_enrollment_D <dbl>,
## # total_enrollment_S <dbl>, total_enrollment_T <dbl>Grade-Level Distribution
Verify that grade-level data sums to reported totals:
# Get state-level data by grade (charter_status == "All" for overall total)
state_by_grade <- enr %>%
  filter(is_state, reporting_category == "TA", charter_status == "All") %>%
  select(end_year, grade_level, n_students)

# Verify exactly 1 TOTAL row per year (no duplicates from charter breakdowns)
stopifnot(
  state_by_grade %>%
    filter(grade_level == "TOTAL") %>%
    count(end_year) %>%
    filter(n != 1) %>%
    nrow() == 0
)

# Compare sum of grades to reported total
grade_validation <- state_by_grade %>%
  group_by(end_year) %>%
  summarize(
    reported_total = n_students[grade_level == "TOTAL"],
    sum_of_grades = sum(n_students[grade_level != "TOTAL"]),
    difference = reported_total - sum_of_grades,
    pct_diff = difference / reported_total * 100,
    .groups = "drop"
  )

grade_validation
## # A tibble: 2 × 5
## end_year reported_total sum_of_grades difference pct_diff
## <int> <dbl> <dbl> <dbl> <dbl>
## 1 2023 5852544 5852544 0 0
## 2 2024 5837690 5837690 0 0
if (any(abs(grade_validation$pct_diff) > 0.1)) {
  cat("WARNING: Grade totals do not match reported totals\n")
} else {
  cat("Grade-level data sums correctly to reported totals.\n")
}
## Grade-level data sums correctly to reported totals.Demographic Subgroup Analysis
Available Subgroups
enr %>%
  filter(is_state, grade_level == "TOTAL", charter_status == "All") %>%
  select(reporting_category, subgroup) %>%
  distinct() %>%
  arrange(reporting_category)
## # A tibble: 33 × 2
## reporting_category subgroup
## <chr> <chr>
## 1 AR_03 age_0_3
## 2 AR_0418 age_4_18
## 3 AR_1922 age_19_22
## 4 AR_2329 age_23_29
## 5 AR_3039 age_30_39
## 6 AR_4049 age_40_49
## 7 AR_50P age_50_plus
## 8 ELAS_ADEL adult_el
## 9 ELAS_EL english_learner
## 10 ELAS_EO english_only
## # ℹ 23 more rowsSubgroup Enrollment Consistency
Verify that demographic breakdowns sum correctly:
# Check race/ethnicity breakdown
state_race <- enr %>%
  filter(
    is_state,
    grade_level == "TOTAL",
    charter_status == "All",
    grepl("^RE_", reporting_category)
  ) %>%
  group_by(end_year) %>%
  summarize(
    sum_race = sum(n_students, na.rm = TRUE),
    .groups = "drop"
  )

state_total <- enr %>%
  filter(is_state, grade_level == "TOTAL", reporting_category == "TA",
         charter_status == "All") %>%
  select(end_year, total = n_students)

race_validation <- state_race %>%
  left_join(state_total, by = "end_year") %>%
  mutate(
    difference = total - sum_race,
    pct_diff = difference / total * 100
  )

race_validation
## # A tibble: 2 × 5
## end_year sum_race total difference pct_diff
## <int> <dbl> <dbl> <dbl> <dbl>
## 1 2023 5852544 5852544 0 0
## 2 2024 5837690 5837690 0 0Charter School Analysis
charter_summary <- enr %>%
  filter(
    is_school,
    grade_level == "TOTAL",
    reporting_category == "TA"
  ) %>%
  group_by(end_year, charter_status) %>%
  summarize(
    n_schools = n(),
    total_enrollment = sum(n_students, na.rm = TRUE),
    .groups = "drop"
  ) %>%
  group_by(end_year) %>%
  mutate(
    pct_schools = n_schools / sum(n_schools) * 100,
    pct_enrollment = total_enrollment / sum(total_enrollment) * 100
  )

charter_summary %>%
  select(end_year, charter_status, n_schools, pct_schools, total_enrollment, pct_enrollment)
## # A tibble: 3 × 6
## # Groups: end_year [2]
## end_year charter_status n_schools pct_schools total_enrollment pct_enrollment
## <int> <chr> <int> <dbl> <dbl> <dbl>
## 1 2023 All 10581 100 5852544 100
## 2 2024 N 9298 87.9 5128055 87.8
## 3 2024 Y 1281 12.1 709635 12.2Known Data Quality Issues
Based on this analysis, the following data quality notes apply:
1. Data Availability and Format Differences
- Modern Census Day files (2024-2025): Full demographic breakdowns, all aggregation levels (state/county/district/school), and Transitional Kindergarten data
-
Historical files (2018-2023): School-level data
with race/ethnicity and gender only
- District, county, and state aggregates are computed from school data
- TK data not available (grade_tk is NA)
- Charter status not available (charter_status is “All”)
- Student group categories (SG_*) not available
2. Suppression
- CDE suppresses cell counts of 10 or fewer students with asterisks (*)
- These appear as NA values in the processed data
- This affects small schools and rare demographic categories
3. Reporting Category Coverage
- Not all schools report all demographic categories
- Some categories may have missing or zero values
- Historical data has fewer reporting categories than modern data
Summary
cat("=== Data Quality Summary ===\n\n")## === Data Quality Summary ===## Years analyzed: 2023, 2024
state_summary <- enr %>%
  filter(is_state, grade_level == "TOTAL", reporting_category == "TA",
         charter_status == "All") %>%
  arrange(end_year)

cat("\nStatewide enrollment by year:\n")
##
## Statewide enrollment by year:
for (i in 1:nrow(state_summary)) {
  format_type <- if (state_summary$end_year[i] >= 2024) "modern" else "historical"
  cat(sprintf("  %d (%s): %s students\n",
              state_summary$end_year[i],
              format_type,
              scales::comma(state_summary$n_students[i])))
}
## 2023 (historical): 5,852,544 students
## 2024 (modern): 5,837,690 students
cat("\nYear-over-year changes:\n")##
## Year-over-year changes:
for (i in 2:nrow(state_summary)) {
  change <- state_summary$n_students[i] - state_summary$n_students[i-1]
  pct <- change / state_summary$n_students[i-1] * 100
  cat(sprintf("  %d to %d: %s (%.1f%%)\n",
              state_summary$end_year[i-1],
              state_summary$end_year[i],
              scales::comma(change),
              pct))
}
## 2023 to 2024: -14,854 (-0.3%)
cat("\nMajor findings:\n")##
## Major findings:
cat("- Historical data (2023) successfully processed from school-level files\n")## - Historical data (2023) successfully processed from school-level files
cat("- Modern Census Day data (2024) includes all aggregation levels\n")## - Modern Census Day data (2024) includes all aggregation levels
cat("- Major districts successfully identified across transition years\n")## - Major districts successfully identified across transition years
cat("- Grade-level data validates against reported totals\n")## - Grade-level data validates against reported totals
cat("- Race/ethnicity breakdowns available for all years analyzed\n")## - Race/ethnicity breakdowns available for all years analyzedSession Info
## R version 4.5.2 (2025-10-31)
## Platform: x86_64-pc-linux-gnu
## Running under: Ubuntu 24.04.3 LTS
##
## Matrix products: default
## BLAS:   /usr/lib/x86_64-linux-gnu/openblas-pthread/libblas.so.3
## LAPACK: /usr/lib/x86_64-linux-gnu/openblas-pthread/libopenblasp-r0.3.26.so;  LAPACK version 3.12.0
##
## locale:
##  [1] LC_CTYPE=C.UTF-8       LC_NUMERIC=C           LC_TIME=C.UTF-8
##  [4] LC_COLLATE=C.UTF-8     LC_MONETARY=C.UTF-8    LC_MESSAGES=C.UTF-8
##  [7] LC_PAPER=C.UTF-8       LC_NAME=C              LC_ADDRESS=C
## [10] LC_TELEPHONE=C         LC_MEASUREMENT=C.UTF-8 LC_IDENTIFICATION=C
##
## time zone: UTC
## tzcode source: system (glibc)
##
## attached base packages:
## [1] stats     graphics  grDevices utils     datasets  methods   base
##
## other attached packages:
## [1] testthat_3.3.2     rmarkdown_2.30     ggplot2_4.0.2      tidyr_1.3.2
## [5] dplyr_1.2.0        caschooldata_0.1.0
##
## loaded via a namespace (and not attached):
##  [1] utf8_1.2.6         rappdirs_0.3.4     sass_0.4.10        generics_0.1.4
##  [5] hms_1.1.4          digest_0.6.39      magrittr_2.0.4     evaluate_1.0.5
##  [9] grid_4.5.2         RColorBrewer_1.1-3 fastmap_1.2.0      jsonlite_2.0.0
## [13] brio_1.1.5         httr_1.4.8         purrr_1.2.1        scales_1.4.0
## [17] codetools_0.2-20   textshaping_1.0.5  jquerylib_0.1.4    cli_3.6.5
## [21] rlang_1.1.7        crayon_1.5.3       bit64_4.6.0-1      withr_3.0.2
## [25] cachem_1.1.0       yaml_2.3.12        tools_4.5.2        parallel_4.5.2
## [29] tzdb_0.5.0         curl_7.0.0         vctrs_0.7.1        R6_2.6.1
## [33] lifecycle_1.0.5    fs_1.6.7           bit_4.6.0          vroom_1.7.0
## [37] ragg_1.5.1         pkgconfig_2.0.3    desc_1.4.3         pkgdown_2.2.0
## [41] pillar_1.11.1      bslib_0.10.0       gtable_0.3.6       glue_1.8.0
## [45] systemfonts_1.3.2  xfun_0.56          tibble_3.3.1       tidyselect_1.2.1
## [49] knitr_1.51         farver_2.1.2       htmltools_0.5.9    labeling_0.4.3
## [53] readr_2.2.0        compiler_4.5.2     S7_0.2.1